
ETHUSD Tests $2,119.28 Resistance Amid Looming Economic Data and Gold's Plunge
ETHUSD hovers around $2,119.28 as traders eye key economic releases. Gold's sharp drop signals broader risk-off sentiment, but what does this mean for crypto?
Now this is where it gets interesting! Ethereum, trading at a critical $2,119.28, finds itself at a familiar resistance point just as a torrent of high-impact economic data is set to flood the markets. The dramatic plunge in gold prices, falling nearly 3% to $4,619.23, adds a layer of complexity, hinting at a potential shift in risk appetite that could ripple through to cryptocurrencies. For traders right now, the question isn't just about ETHUSD's immediate price action, but about how the broader macroeconomic landscape, signaled by gold's sharp retreat, will dictate the next move in the digital asset space.
- ETHUSD RSI at 77.56 signals strong overbought pressure on the 1H chart, suggesting a potential pullback is due.
- Critical resistance for ETHUSD sits at $2,135.50, a level that has capped upside moves multiple times this week.
- Gold's sharp 2.92% drop to $4,619.23 indicates a potential flight to safety, impacting correlated risk assets.
- The upcoming US economic data releases, especially inflation figures, will be crucial in determining the Fed's next policy stance and its influence on crypto markets.
The cryptocurrency market, particularly Ethereum, has been in a fascinating dance with traditional financial markets. While often touted as a digital gold or an inflation hedge, ETHUSD's correlation with risk assets like the S&P 500 and Nasdaq has become increasingly pronounced. Today, with gold taking a significant tumble from $4,800.43 down to $4,619.23, we need to assess if this is a isolated event for precious metals or a harbinger of a broader market recalibration. The fact that gold, a traditional safe haven, is experiencing such a sharp decline warrants serious attention. It suggests that market participants might be rotating away from perceived havens, potentially due to shifting inflation expectations or a reassessment of geopolitical risks. This sentiment, if it persists, could create headwinds for riskier assets, including cryptocurrencies.
Navigating the Resistance: ETHUSD's Technical Crossroads
The 1-Hour Chart: Signs of Exhaustion?
Looking at the 1-hour timeframe for ETHUSD, the technical indicators are flashing a clear warning sign for the bulls. The Relative Strength Index (RSI) is soaring at 77.56, firmly in overbought territory. This suggests that the recent upward momentum might be unsustainable and a period of consolidation or even a pullback is likely. While RSI values above 70 don't immediately signal a sell, they indicate that the asset has moved up sharply and quickly, increasing the probability of a short-term correction. The MACD, though showing positive momentum with the MACD line above its signal line, is operating in an environment where the RSI is flashing red. This divergence can sometimes precede a trend reversal or a significant pause in the rally. Furthermore, the Stochastic Oscillator is deep in overbought territory, with the %K line at 88.01 and the %D line at 83.33, reinforcing the idea that the buying pressure might be overextended on this shorter timeframe. The ADX, at 25.35, indicates a strong upward trend is present, but coupled with the extreme RSI and Stochastic readings, it points to a potentially overheated trend that is vulnerable to a correction.
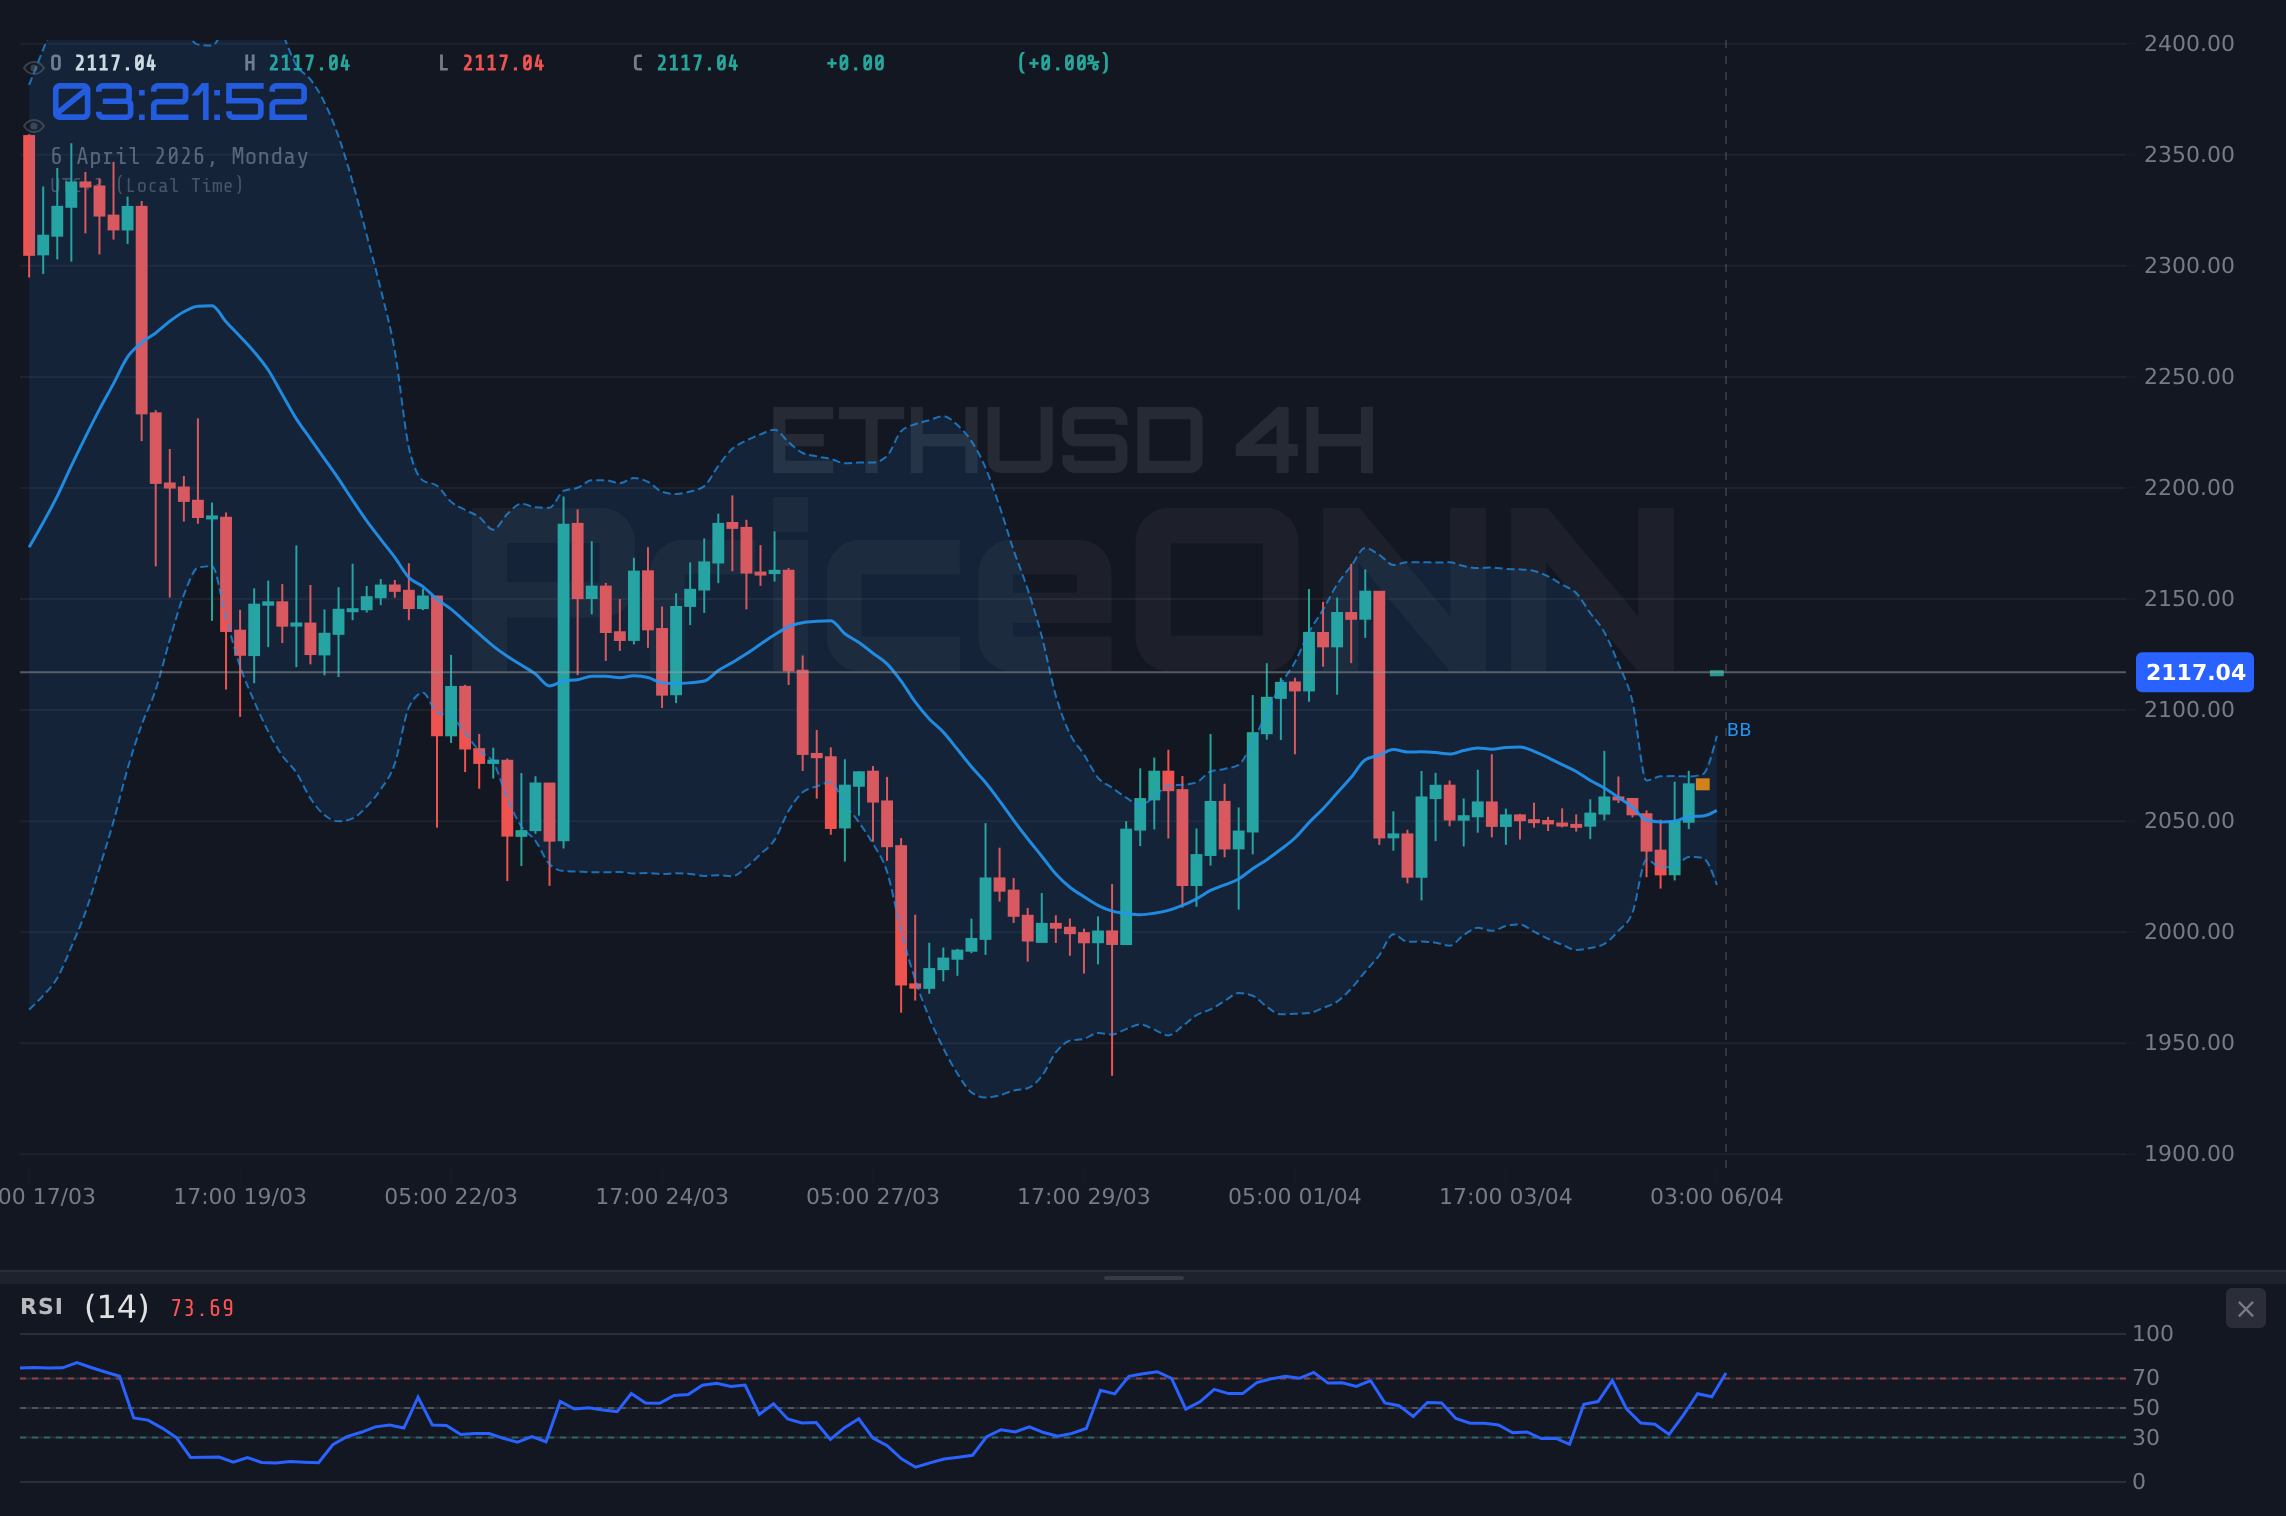
The Bollinger Bands on the 1-hour chart are also telling a story. Price is trading above the upper band, which often signals an overextended move. While this can sometimes lead to a breakout in strong trends, the confluence of other overbought indicators makes a pullback more probable. The key resistance level to watch on this timeframe is $2,135.50. A failure to decisively break and hold above this level, especially with the current technical picture, could lead to a test of the immediate support at $2,110.61, and potentially lower towards $2,097.03. The overall signal for the 1-hour timeframe is 'BUY' according to the aggregated signals (6 Buy, 2 Sell, 0 Neutral), but the extreme readings on RSI and Stochastic suggest this signal might be based on a trend that is due for a pause rather than continuation.
The 4-Hour Chart: A Different Perspective?
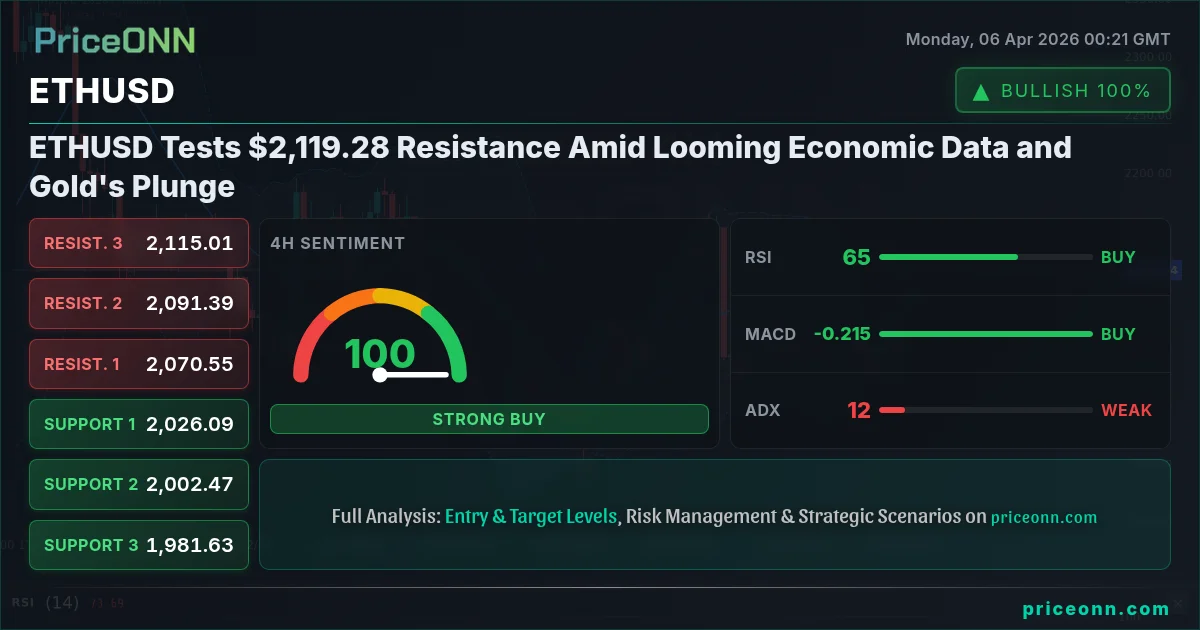
Shifting our focus to the 4-hour chart, the picture for ETHUSD becomes slightly more nuanced, though still carrying caution. The RSI here is at 64.8, still in the upper range of neutral but not as extremely overbought as on the 1-hour chart. This suggests that while the short-term momentum might be peaking, the medium-term trend still has some room to breathe. The MACD is positive and above its signal line, indicating ongoing bullish momentum on this timeframe. The Stochastic Oscillator shows %K at 52.96 and %D at 36.59, which is a bullish signal, but notably, it's not in overbought territory, offering more room for upward movement compared to the 1-hour chart. The ADX reading of 11.62 is quite low, indicating a weak trend. This suggests that the current move might be more range-bound or lacking strong directional conviction on this timeframe, despite the positive MACD and Stochastic signals.
The Bollinger Bands on the 4-hour chart show price trading above the middle band, aligning with a generally bullish inclination. However, the weak ADX is a crucial element here; it implies that any upward move might lack the strength to sustain itself significantly. The key resistance levels to monitor on this chart are $2,1091.39 and $2,115.01. A decisive break above these could signal further upside. Conversely, the support levels at $2,070.55 and $2,026.09 become relevant if the short-term overbought conditions on the 1-hour chart lead to a broader sell-off. The aggregated signals on the 4-hour chart lean heavily towards 'BUY' (8 Buy, 0 Sell, 0 Neutral), but the low ADX suggests this might be a cautious optimism, awaiting confirmation from broader market conditions or upcoming economic data.
The Daily Chart: The Long Game
On the daily chart, ETHUSD presents a more balanced, albeit cautious, outlook. The RSI is at 52.23, sitting squarely in the neutral zone. This indicates that the market is neither overbought nor oversold on a daily basis, suggesting that the longer-term trend is not yet decisively skewed in either direction, or that it's consolidating after a significant move. The MACD is positive and above its signal line, indicating bullish momentum, but the ADX at 11.82 is extremely low. This suggests a very weak trend on the daily timeframe, reinforcing the idea of a consolidating market or a period of indecision. The Stochastic Oscillator, with %K at 59.6 and %D at 39.41, provides a bullish signal as %K is above %D and not yet in overbought territory, offering potential for further upside. The Bollinger Bands are trading above the middle band, indicating a generally upward bias, but the very low ADX means any trend might lack conviction.
The daily timeframe's support levels are at $2,041.15, $2,021.66, and $2,001.42. The resistance levels are more critical for the immediate future: $2,080.88, $2,101.12, and $2,120.61. A daily close above $2,120.61 would be a significant bullish signal, potentially opening the door for a move towards higher resistance levels. However, the weak ADX and the proximity to the 1-hour chart's overbought conditions mean that such a breakout would need to be confirmed by strong volume and sustained price action. The aggregated signals on the daily chart are also leaning bullish (7 Buy, 1 Sell, 0 Neutral), but the dominant theme across all timeframes, especially the shorter ones, is the looming resistance and the potential for a pullback, amplified by the broader market's reaction to economic data and gold's price action.
The Gold Factor: A Warning Signal for Risk Assets?
The sharp 2.92% decline in gold prices, plummeting from recent highs to trade around $4,619.23, is a major event that cannot be ignored. Gold, traditionally seen as a safe-haven asset, often moves inversely to risk appetite. Its significant drop, especially when geopolitical tensions remain elevated, suggests a potential shift in market sentiment. This could be driven by several factors: perhaps markets are pricing out some of the geopolitical risk premium, or maybe upcoming economic data is expected to be stronger than anticipated, reducing the appeal of safe havens. Alternatively, it could signal a rotation into other assets perceived as better hedges against specific market conditions, or simply a large-scale profit-taking event after a significant run-up.
For ETHUSD and other cryptocurrencies, which have increasingly shown a correlation with risk assets like the S&P 500 and Nasdaq, gold's downturn is a critical data point. If the broader market sentiment is indeed shifting towards risk aversion, we could see increased selling pressure across the crypto market. The fact that gold is retreating even amidst ongoing geopolitical turmoil in the Middle East is particularly noteworthy. This suggests that the narrative might be evolving from 'geopolitical risk = buy gold' to 'geopolitical risk + potential economic slowdown = reconsidering all assets'. The recent news highlighting Robert Kiyosaki's renewed push for Bitcoin, gold, and silver as hedges against inflation and debt, while seemingly bullish for crypto, could also be interpreted as a reaction to perceived systemic risks that might also pressure speculative assets like ETHUSD if a true risk-off sentiment takes hold. The correlation between gold and Bitcoin, while not always perfect, often tightens during periods of significant macroeconomic uncertainty.
Correlations and Macroeconomic Headwinds
The Dollar's Grip: DXY at 99.99
The US Dollar Index (DXY) is currently trading at 99.99, showing a strong upward move of 0.76% today. This strengthening dollar presents a significant headwind for risk assets and commodities priced in dollars, including ETHUSD and gold. As the DXY rises, it typically becomes more expensive for holders of other currencies to buy dollar-denominated assets. This can lead to reduced demand and downward price pressure. On the 1-hour chart, the DXY's RSI is at 66.56, indicating bullish momentum, and the Stochastic Oscillator is also showing a bullish signal. The ADX at 26.08 confirms a strong upward trend. On the daily chart, the DXY is also showing a strong uptrend with an ADX of 30.46. This persistent strength in the dollar reinforces the bearish case for assets like ETHUSD that are sensitive to currency fluctuations and broader risk sentiment.
The interplay between the dollar, gold, and ETHUSD is crucial. Historically, a strong dollar often correlates with weaker gold prices and can put pressure on cryptocurrencies, especially if the strength is driven by safe-haven demand or expectations of higher-than-anticipated interest rates. While ETHUSD has shown periods of decoupling, its correlation with the broader equity market (S&P 500 and Nasdaq, which are currently showing mixed signals with S&P 500 up 0.74% and Nasdaq down 0.23%) means that a strengthening dollar combined with potential risk aversion could create a challenging environment. The current DXY level near the psychologically important 100 mark suggests that further strength is possible, especially if upcoming economic data points towards persistent inflation or a resilient US economy, which could deter the Federal Reserve from cutting rates.
Equity Market Mixed Signals: S&P 500 vs. Nasdaq
The US equity markets are currently displaying mixed signals. The S&P 500 is up 0.74% at 6572.87, indicating some resilience in the broader market. However, the Nasdaq 100 is down 0.23% at 23988.39. This divergence is interesting. The S&P 500's strength might be driven by sectors less sensitive to growth expectations, or perhaps by a rotation into value stocks, while the Nasdaq, heavily weighted towards tech and growth stocks, is showing weakness. On the 1-hour chart, the S&P 500's RSI is at 70.95, suggesting overbought conditions, while the Nasdaq's RSI is at 55.53, indicating more neutral momentum. The ADX readings on both indices are relatively high (49.72 for S&P 500, 45.8 for Nasdaq on the daily chart), indicating strong directional trends, albeit in different directions on the shorter term.
This mixed equity performance adds another layer of uncertainty for ETHUSD. A strong S&P 500 could theoretically provide a tailwind for risk assets, but the weakness in the tech-heavy Nasdaq, and the simultaneous retreat in gold, complicates this picture. If the market sentiment starts to favor risk aversion, we could see a broader sell-off across equities, which would likely drag ETHUSD down with it. The current price action suggests that while there's some resilience in certain market segments, the underlying nervousness, amplified by gold's sharp decline and the dollar's strength, might be a dominant factor heading into critical economic data releases. Traders will be closely watching if the S&P 500 can maintain its gains or if the Nasdaq's weakness is a leading indicator of further downside.
Economic Data Deluge: The Fed's Next Move?
The upcoming economic calendar is packed with high-impact events, predominantly focused on US inflation and employment data. These releases are critical because they will heavily influence the Federal Reserve's monetary policy decisions. With inflation proving 'stubborn' as per recent reports and the Fed funds futures pricing in a certain number of rate cuts, any deviation from expectations could drastically alter market dynamics. For instance, if inflation figures come in hotter than forecasted (forecast for USD is 51.1, previous was 51.7), it could signal that the Fed might need to maintain higher interest rates for longer, or even pause planned rate cuts. This would typically strengthen the dollar (DXY) and put pressure on risk assets like ETHUSD.
Conversely, if inflation data shows a significant cooling trend, it could reinforce expectations for rate cuts, potentially boosting risk appetite and providing a tailwind for ETHUSD. The market's reaction to gold's sharp fall might already be a preemptive move based on expectations of strong economic data that reduces the need for safe-haven assets or signals a Fed that is less inclined to cut rates. The current market sentiment, with gold retreating despite geopolitical tensions, could be interpreted as a signal that traders are bracing for data that supports a 'higher for longer' interest rate environment. This makes the upcoming releases not just data points, but potential catalysts for significant price movements across all asset classes.
On-Chain Metrics: What the Blockchain is Saying
While technicals and macroeconomics paint a broad picture, on-chain metrics offer a granular view of network health and user activity for ETHUSD. Active addresses, a key indicator of network engagement, will be crucial to monitor. A sustained increase in active addresses typically correlates with rising prices, indicating growing adoption and utility. Conversely, a decline might suggest waning interest or network congestion. Exchange flows are another vital component; large inflows of ETH to exchanges often precede selling pressure, as holders look to liquidate. Conversely, significant outflows from exchanges can signal accumulation and confidence from investors, potentially supporting price.
Whale movements – large transactions by major holders – can also provide clues. While whale accumulation can be a bullish sign, a sudden distribution by large holders could signal an impending price drop. The hash rate, a measure of the network's computational power securing the blockchain, has been robust, indicating strong underlying network health and security. However, even robust on-chain metrics can be overshadowed by broader market sentiment and macroeconomic events. For example, significant outflows might be occurring, but if a macro shock triggers a sell-off, those outflows might represent panic selling rather than strategic accumulation. Therefore, on-chain data should be interpreted in conjunction with price action and external market factors.
DeFi and NFT Ecosystem: Gauging Real-World Utility
The Total Value Locked (TVL) in the Ethereum DeFi ecosystem is a key barometer of its health and utility. A rising TVL indicates that more capital is being deployed into decentralized finance protocols, suggesting increasing confidence and demand for Ethereum-based services like lending, borrowing, and decentralized exchanges. Currently, the TVL across Ethereum DeFi protocols provides a fundamental underpinning for ETH's value. Developments in Layer 2 scaling solutions, such as Optimism and Arbitrum, are also critical. As gas fees on the main Ethereum network can become prohibitive during periods of high demand, the efficiency and adoption of L2s directly impact the user experience and overall network scalability.
The NFT market, while experiencing cyclical highs and lows, remains an important part of the Ethereum ecosystem. Significant trading volumes and innovation in NFT platforms can drive demand for ETH, as it's the primary currency for most NFT transactions. Regulatory news, both positive and negative, can also significantly impact the DeFi and NFT spaces. Clarity on regulations can foster institutional adoption, while uncertainty or crackdowns can stifle growth. Institutional adoption trends, particularly the interest in Ethereum ETFs or other regulated products, are crucial for long-term price appreciation. Any positive developments in this area could provide a significant boost to ETHUSD, regardless of short-term technical signals.
Trade Scenarios for ETHUSD
Bearish Scenario: Resistance Holds Firm
60% ProbabilityNeutral Scenario: Consolidation Around Key Levels
25% ProbabilityBullish Scenario: Breakout Above Resistance
15% ProbabilityFrequently Asked Questions: ETHUSD Analysis
What happens if ETHUSD fails to break above the $2,135.50 resistance level amid gold's sharp decline?
If ETHUSD fails to decisively break above $2,135.50, particularly with gold trading around $4,619.23 and the DXY strengthening towards 100, expect a move back towards the $2,110.61 support. A daily close below this level would strengthen the bearish case, potentially targeting the $2,070.55 area.
Should I buy ETHUSD at current levels of $2,119.28 given the overbought RSI at 77.56 on the 1H chart?
Buying at current levels of $2,119.28 carries significant risk due to the extremely overbought RSI (77.56) on the 1-hour chart. A more prudent approach would be to wait for a pullback to support levels like $2,110.61 or $2,097.03, or confirmation of a breakout above $2,135.50 with sustained volume.
Is the RSI at 77.56 a sell signal for ETHUSD right now?
An RSI of 77.56 on the 1-hour chart strongly indicates overbought conditions, suggesting the recent upward momentum may be exhausted. While not an immediate sell signal on its own, it significantly increases the probability of a short-term correction or consolidation, especially if ETHUSD fails to break key resistance levels.
How will upcoming US economic data affect ETHUSD around the $2,119.28 mark?
Stronger-than-expected US inflation data, potentially indicated by gold's sharp fall, could lead to a Fed 'higher for longer' narrative. This would likely strengthen the DXY towards 100 and put downward pressure on ETHUSD, making a break below $2,119.28 more probable. Conversely, cooler data could support a risk-on move, potentially pushing ETHUSD towards resistance.
The path forward for ETHUSD hinges on a delicate balance between its own technical momentum and the overwhelming influence of macroeconomic factors. While the daily chart shows underlying strength, the immediate 1-hour indicators are flashing warnings, amplified by gold's dramatic retreat and a strengthening dollar. Traders should remain vigilant, awaiting clearer signals from the upcoming economic data releases and observing how ETHUSD reacts to the $2,135.50 resistance. Patience and disciplined risk management will be key in navigating these choppy waters. The market always provides opportunities, but it demands precision and an understanding of the broader context.
Track markets in real-time
AI-powered analysis, technical indicators and real-time price data.
Join Our Telegram Channel
Breaking market news, AI analysis and trading signals instantly.
Join Channel