
BTC Tests $69,386: Kiyosaki's Gold Call & Rate Cut Fears Spark Volatility
Bitcoin hovers around $69,386 as Robert Kiyosaki champions gold and Bitcoin amid inflation worries and potential Fed rate cut delays. Technicals show mixed signals.
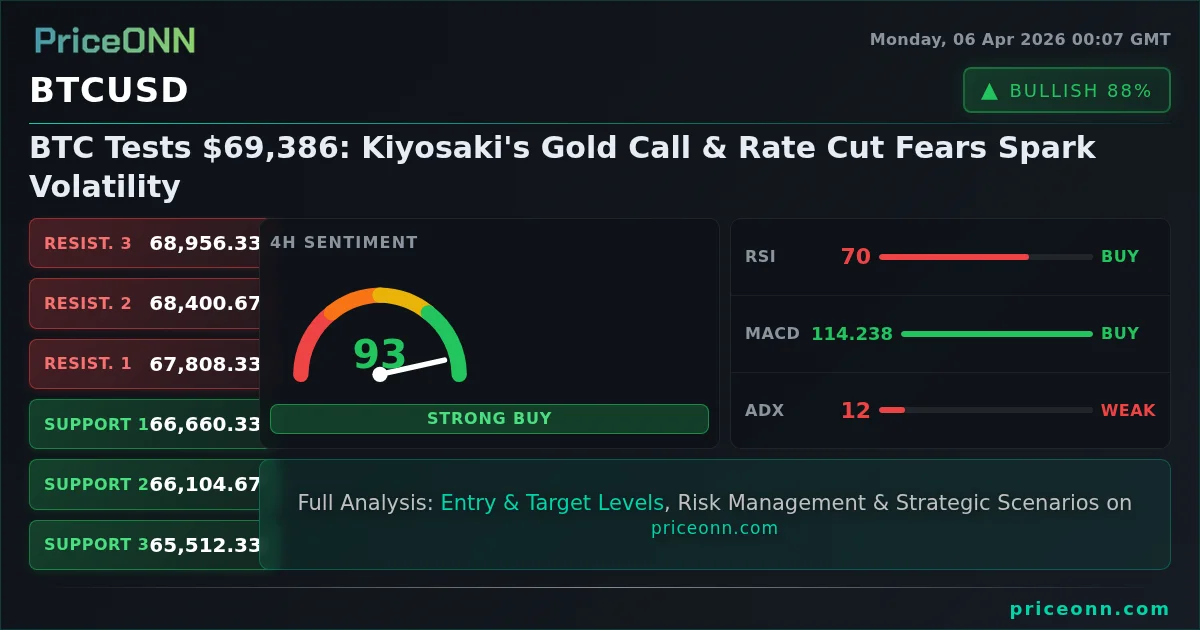
Bitcoin is currently navigating a critical juncture around the $69,386 mark, a price point that's drawing significant attention amidst a confluence of macroeconomic concerns and shifting investor sentiment. As prominent figures like Robert Kiyosaki reiterate calls for gold and Bitcoin as inflation hedges, the market is grappling with the potential impact of delayed Federal Reserve rate cuts, fueled by rising oil prices and persistent inflation fears. This complex backdrop creates a volatile environment, demanding a nuanced analysis of both technical indicators and the underlying fundamental drivers influencing BTCUSD today.
- Bitcoin's RSI at 83.74 on the 1H chart signals extreme overbought pressure, suggesting a potential pullback.
- Critical support for BTCUSD sits at $66,640.67 on the 1H timeframe, tested multiple times this week.
- The MACD histogram shows bullish divergence on the 1D chart, indicating fading upward momentum despite the current price.
- Fed rate expectations remain a key driver, with the DXY strength at 100 influencing BTCUSD's correlation.
The cryptocurrency market, led by Bitcoin, is at a fascinating crossroads. While BTCUSD is trading at a significant $69,386, the underlying technical signals present a mixed picture. On the 1-hour chart, the Relative Strength Index (RSI) is soaring at 83.74, firmly in overbought territory. This typically signals that an asset has risen too far, too fast, and may be due for a correction. Similarly, the Stochastic oscillator on the 1-hour timeframe shows %K at 90.75 and %D at 72.3, also indicating extreme overbought conditions. The MACD on the 1-hour chart shows positive momentum, with the MACD line above the signal line, suggesting buying pressure is currently in control. However, even with this short-term bullish momentum, the ADX at 34.31 on the 1H chart points to a strong uptrend, but the overbought RSI and Stochastic readings suggest caution for immediate upside continuation without a healthy pullback.
The Bull's Roadmap: Navigating Towards New Highs
For Bitcoin to sustain its upward trajectory and potentially challenge higher price levels, several conditions must be met. The immediate hurdle is overcoming the short-term overbought signals. A healthy consolidation or a minor pullback to reset the RSI and Stochastic oscillators could pave the way for a more sustainable rally. If Bitcoin can hold above the crucial 1-hour support at $67,668.67, and ideally consolidate around $68,000-$69,000, it would set the stage for a potential retest of the resistance at $68,696.67. A decisive break above this level, supported by increasing volume and a cooling of overbought indicators, could then target the next resistance at $69,051.33 and subsequently the psychological $70,000 level. On the 4-hour timeframe, the trend is currently neutral, but the MACD shows positive momentum, and the RSI at 69.45 is approaching overbought territory but still has room to run. The ADX at 11.99, however, indicates a weak trend on this timeframe, suggesting that any breakout might lack strong conviction initially. This means that while upside is possible, it needs confirmation.
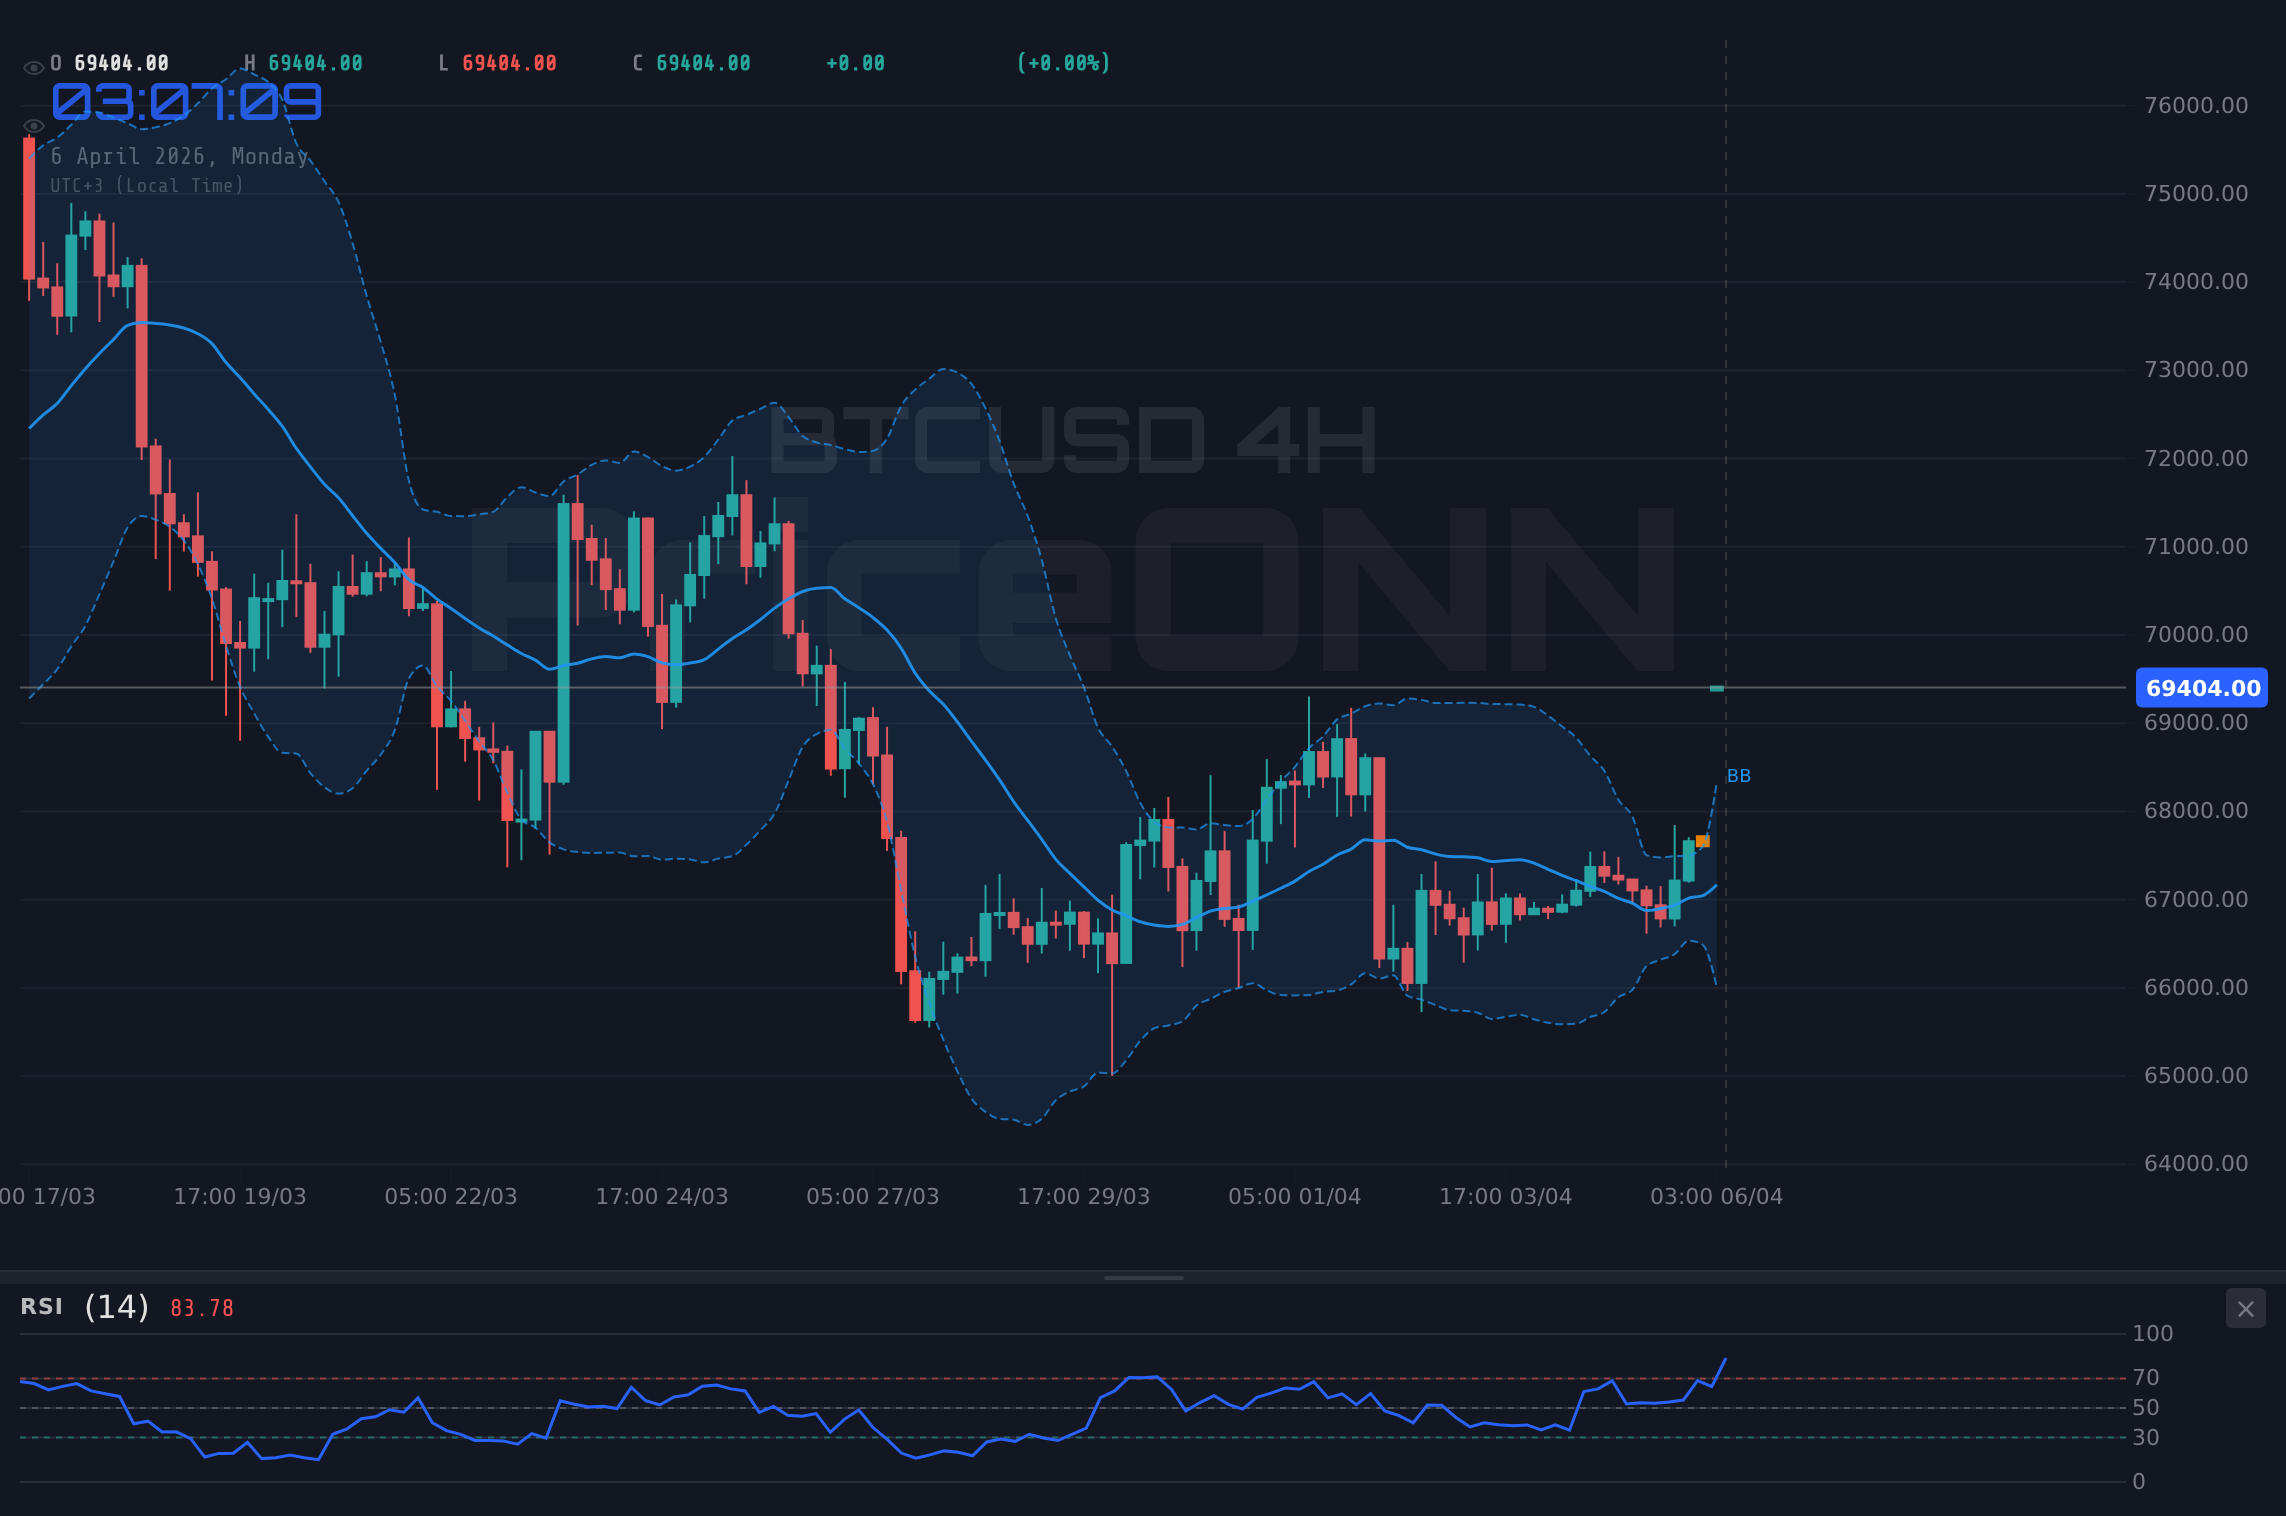
The daily chart offers a slightly different perspective. While the 1-hour and 4-hour charts show immediate bullish signals or neutral conditions, the daily chart's MACD is showing positive momentum, but the RSI at 51.75 is in neutral territory, indicating that the longer-term trend still has room to develop. The ADX at 18.77 on the daily chart still suggests a weak trend, which is a concern for sustained bullish moves. However, the Stochastic on the daily chart shows %K at 60.24 and %D at 39.51, which is a bullish signal. If Bitcoin can manage to consolidate its gains and avoid a significant drop below the $66,000 support level, the bulls could reassert control. The key for a sustained rally would be confirmation from the daily indicators, particularly the ADX showing a stronger trend, and the RSI moving higher without immediately entering overbought territory.
Where Bears Take Control: The Risks at $69,386
The bearish case for Bitcoin hinges on several key factors, primarily the overwhelming short-term overbought technicals and the macroeconomic headwinds. The RSI at 83.74 on the 1-hour chart is a significant warning sign. If Bitcoin fails to consolidate or pull back naturally, a sharp sell-off could be triggered as traders take profits. The 1-hour support level at $67,668.67 is the first line of defense. A break below this could quickly lead to a test of the next support at $66,995.33. If this level fails, the more significant 1-hour support at $66,640.67 comes into play. A decisive close below $66,640.67 on the 1-hour chart would invalidate the immediate bullish setup and could signal a deeper retracement, potentially targeting the 4-hour support levels around $66,104.67 and $65,512.33. The daily chart's ADX at 47.51 is showing a strong downward trend, which could reassert itself if the bulls fail to hold ground.
Furthermore, the macroeconomic environment poses a substantial risk. Robert Kiyosaki's renewed advocacy for gold and Bitcoin comes amid fears of rising oil prices and persistent inflation. If upcoming US CPI data proves hotter than expected, it could force the Federal Reserve to reconsider or delay anticipated rate cuts. This would likely strengthen the US Dollar Index (DXY), which is currently at 100. A rising DXY typically exerts downward pressure on risk assets like Bitcoin. The correlation between BTCUSD and DXY, while not always perfect, is a critical factor to monitor. If the DXY continues its upward trend from its current level of 100, it could exacerbate selling pressure on Bitcoin. The geopolitical tensions mentioned in recent news, particularly those impacting oil prices, add another layer of uncertainty that could lead to a risk-off sentiment, further pressuring cryptocurrencies.
The Waiting Game: Consolidation Around $69,386
A neutral scenario suggests that Bitcoin might enter a period of consolidation, trading within a defined range as market participants digest the conflicting signals and await clearer macroeconomic direction. In this scenario, BTCUSD could fluctuate between the immediate support at $67,668.67 and the resistance at $68,696.67 on the 1-hour timeframe. This period of sideways movement would allow the overbought indicators on the shorter timeframes to cool down, while the longer-term trend indicators on the daily chart remain cautiously optimistic or neutral. Such consolidation could also be driven by a lack of significant news catalysts, either positive or negative, leaving the market in a 'wait-and-see' mode. During this phase, trading volumes might decrease, and price action could become choppy, characterized by smaller price swings and difficulty in establishing a clear directional bias.
The key to identifying a consolidation phase would be the failure of price to decisively break either the immediate support or resistance levels for a sustained period. For instance, repeated rejections at the $68,696.67 resistance, coupled with bounces off the $67,668.67 support, would indicate a range-bound market. The ADX readings across multiple timeframes being relatively low (11.99 on 4H, 18.77 on 1D) also support the idea of a weak trend, which often translates to consolidation. This neutral phase could be crucial for Bitcoin to build a base before its next significant move, whether that's an upward continuation or a downward correction. Traders in this environment would likely focus on range-trading strategies, looking for opportunities at the edges of the established trading band, while keeping a close eye on the aforementioned support and resistance levels for any signs of a breakout or breakdown.
What's Driving the Price Action? Unpacking the Fundamentals
The current price action in BTCUSD is a complex interplay of technical signals and fundamental macroeconomics, with a strong undercurrent of investor sentiment shaped by figures like Robert Kiyosaki. Kiyosaki's repeated calls for Bitcoin and gold as hedges against inflation and potential economic instability resonate with a market increasingly concerned about the trajectory of interest rates. The recent surge in oil prices, pushing Brent crude above $100 and WTI near $113, is a significant inflationary driver. This directly impacts the Federal Reserve's policy calculus. Markets are now pricing in a higher probability that the Fed might delay or even halt rate cuts this year if inflation remains stubbornly high, a stark contrast to earlier expectations of multiple cuts. This uncertainty is reflected in the DXY's strength, currently holding at 100, which typically acts as a headwind for risk assets like Bitcoin.
On the crypto-specific side, while the provided data doesn't detail on-chain metrics, broader market sentiment is influenced by institutional flows and regulatory developments. The recent news highlighting Bitcoin's potential for a 'gold-like rally' suggests a narrative shift where Bitcoin is increasingly viewed not just as a speculative asset but as a store of value. This narrative is crucial for attracting longer-term capital. However, the high RSI on the 1-hour chart at 83.74 indicates that the market might be getting ahead of itself in the short term, regardless of the long-term narrative. The interplay between these macro factors, investor psychology, and Bitcoin's own market structure will dictate its path forward. The lack of specific economic calendar data in the provided context makes it harder to pinpoint immediate catalysts, but the general trend of inflation concerns and a strong dollar remains the dominant theme.
The Verdict: A Cautious Outlook with Key Levels to Watch
We are currently in a **WATCH_ZONE** for BTCUSD. The technical indicators present conflicting signals across different timeframes, and the macroeconomic environment is highly uncertain. The immediate 1-hour chart shows extreme overbought conditions (RSI 83.74), suggesting a pullback is likely. However, the daily chart shows a strong uptrend in development, albeit with a weak ADX (18.77), indicating a lack of conviction. The price is currently testing a critical resistance zone around $69,386, but the potential for a profit-taking wave or a macro-driven sell-off is significant.
A daily close above $69,724.67 on the 1-hour chart, with cooling overbought indicators and confirmation from the daily trend strength, would open the door for bullish continuation towards $70,000 and potentially higher. Conversely, a decisive break below the $66,640.67 support level on the 1-hour chart would invalidate the immediate bullish outlook and could signal a deeper correction, aligning with the bearish sentiment suggested by the high DXY and inflation fears.
The market needs to see a clear catalyst or a period of consolidation to resolve these conflicting signals. Until then, traders should exercise caution and focus on risk management. The $66,640.67 support level is paramount for the bulls, while breaking above the $69,724.67 resistance is necessary for sustained upside momentum. Given the overbought conditions on shorter timeframes and the macroeconomic uncertainty, the probability of a short-term pullback or consolidation before any significant upside move remains elevated.
What I'm Watching This Week
This week, my focus will be on three key triggers that could dictate Bitcoin's short-to-medium term direction:
- The $66,640.67 Support Level: This is the make-or-break level on the 1-hour chart. A failure to hold this support could trigger significant selling pressure.
- US CPI Data Release: Any surprise in inflation figures will directly impact Fed rate cut expectations and, consequently, the DXY and BTCUSD. A hotter-than-expected print would be a bearish catalyst.
- RSI and Stochastic Readings on Shorter Timeframes: I'll be watching to see if these indicators can reset from their overbought levels through consolidation or a mild pullback, which would be a prerequisite for any sustained rally.
Bearish Scenario: Profit-Taking Wave
65% ProbabilityNeutral Scenario: Consolidation Phase
25% ProbabilityBullish Scenario: Sustainable Rally
10% ProbabilityFrequently Asked Questions: BTCUSD Analysis
What happens if BTCUSD breaks below the $66,640.67 support level?
A break below $66,640.67 on the 1-hour chart would invalidate the immediate bullish setup. This could trigger significant selling pressure, potentially targeting the $65,512.33 level on the 4-hour chart as bears seize control.
Should I buy BTCUSD at current levels around $69,386 given the overbought RSI at 83.74?
Buying at current levels carries significant risk due to the extreme overbought RSI (83.74) on the 1-hour chart. A pullback or consolidation is more likely. A more prudent approach would be to wait for indicators to reset or for price to break key resistance levels like $69,724.67 with confirmation.
Is the RSI at 83.74 a definite sell signal for BTCUSD right now?
An RSI of 83.74 on the 1-hour chart is a strong indicator of overbought conditions, suggesting a potential for a price correction. However, it's not an absolute sell signal on its own, especially if the broader trend remains bullish. Confirmation from other indicators and price action is crucial.
How will upcoming US CPI data affect BTCUSD if it's higher than expected?
If US CPI data comes in hotter than expected, it could delay Fed rate cuts, strengthen the DXY (currently at 100), and increase inflation hedging demand for assets like Bitcoin. This would likely create bearish pressure on BTCUSD in the short term, despite its long-term inflation hedge narrative.
Track markets in real-time
AI-powered analysis, technical indicators and real-time price data.
Join Our Telegram Channel
Breaking market news, AI analysis and trading signals instantly.
Join Channel