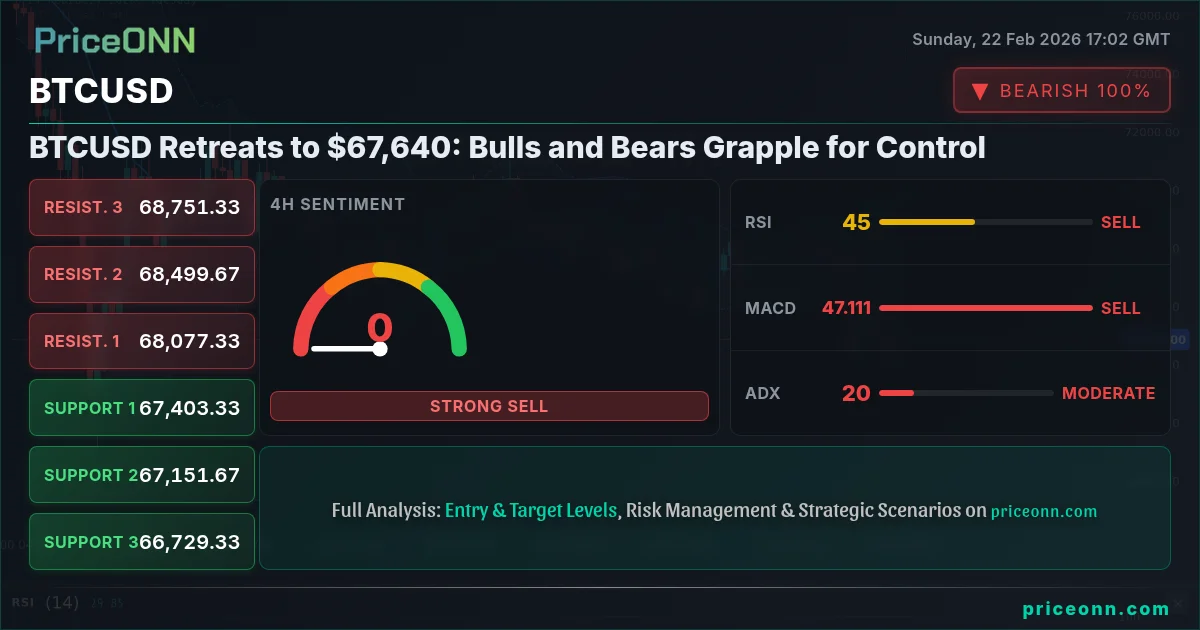
The battle for BTCUSD's direction is intensifying as it closed last Friday at $67,640. After a week of volatility, the cryptocurrency is caught between bullish hopes and bearish realities. The next week promises to be crucial, with key retail data releases potentially acting as a catalyst for a decisive move.
- BTCUSD closed last week at $67,640, facing strong bearish pressure.
- Key support level to watch is $67,306.67, a break below could trigger further declines.
- RSI at 41.85 on the 1H chart suggests potential for further downside.
- Next week's retail data could significantly impact BTCUSD's correlation with the DXY.
The Bullish Argument: Is a Rebound on the Horizon?
The bullish narrative for BTCUSD hinges on several factors. Firstly, despite the recent pullback, the broader sentiment in the crypto market remains optimistic. Many analysts believe that Bitcoin is still in the early stages of its adoption cycle, with significant upside potential as institutional interest grows. The Nasdaq100, a key indicator of tech sector performance, closed at 24996.74, showing a daily gain of 0.94%, suggesting some risk appetite remains in the market.
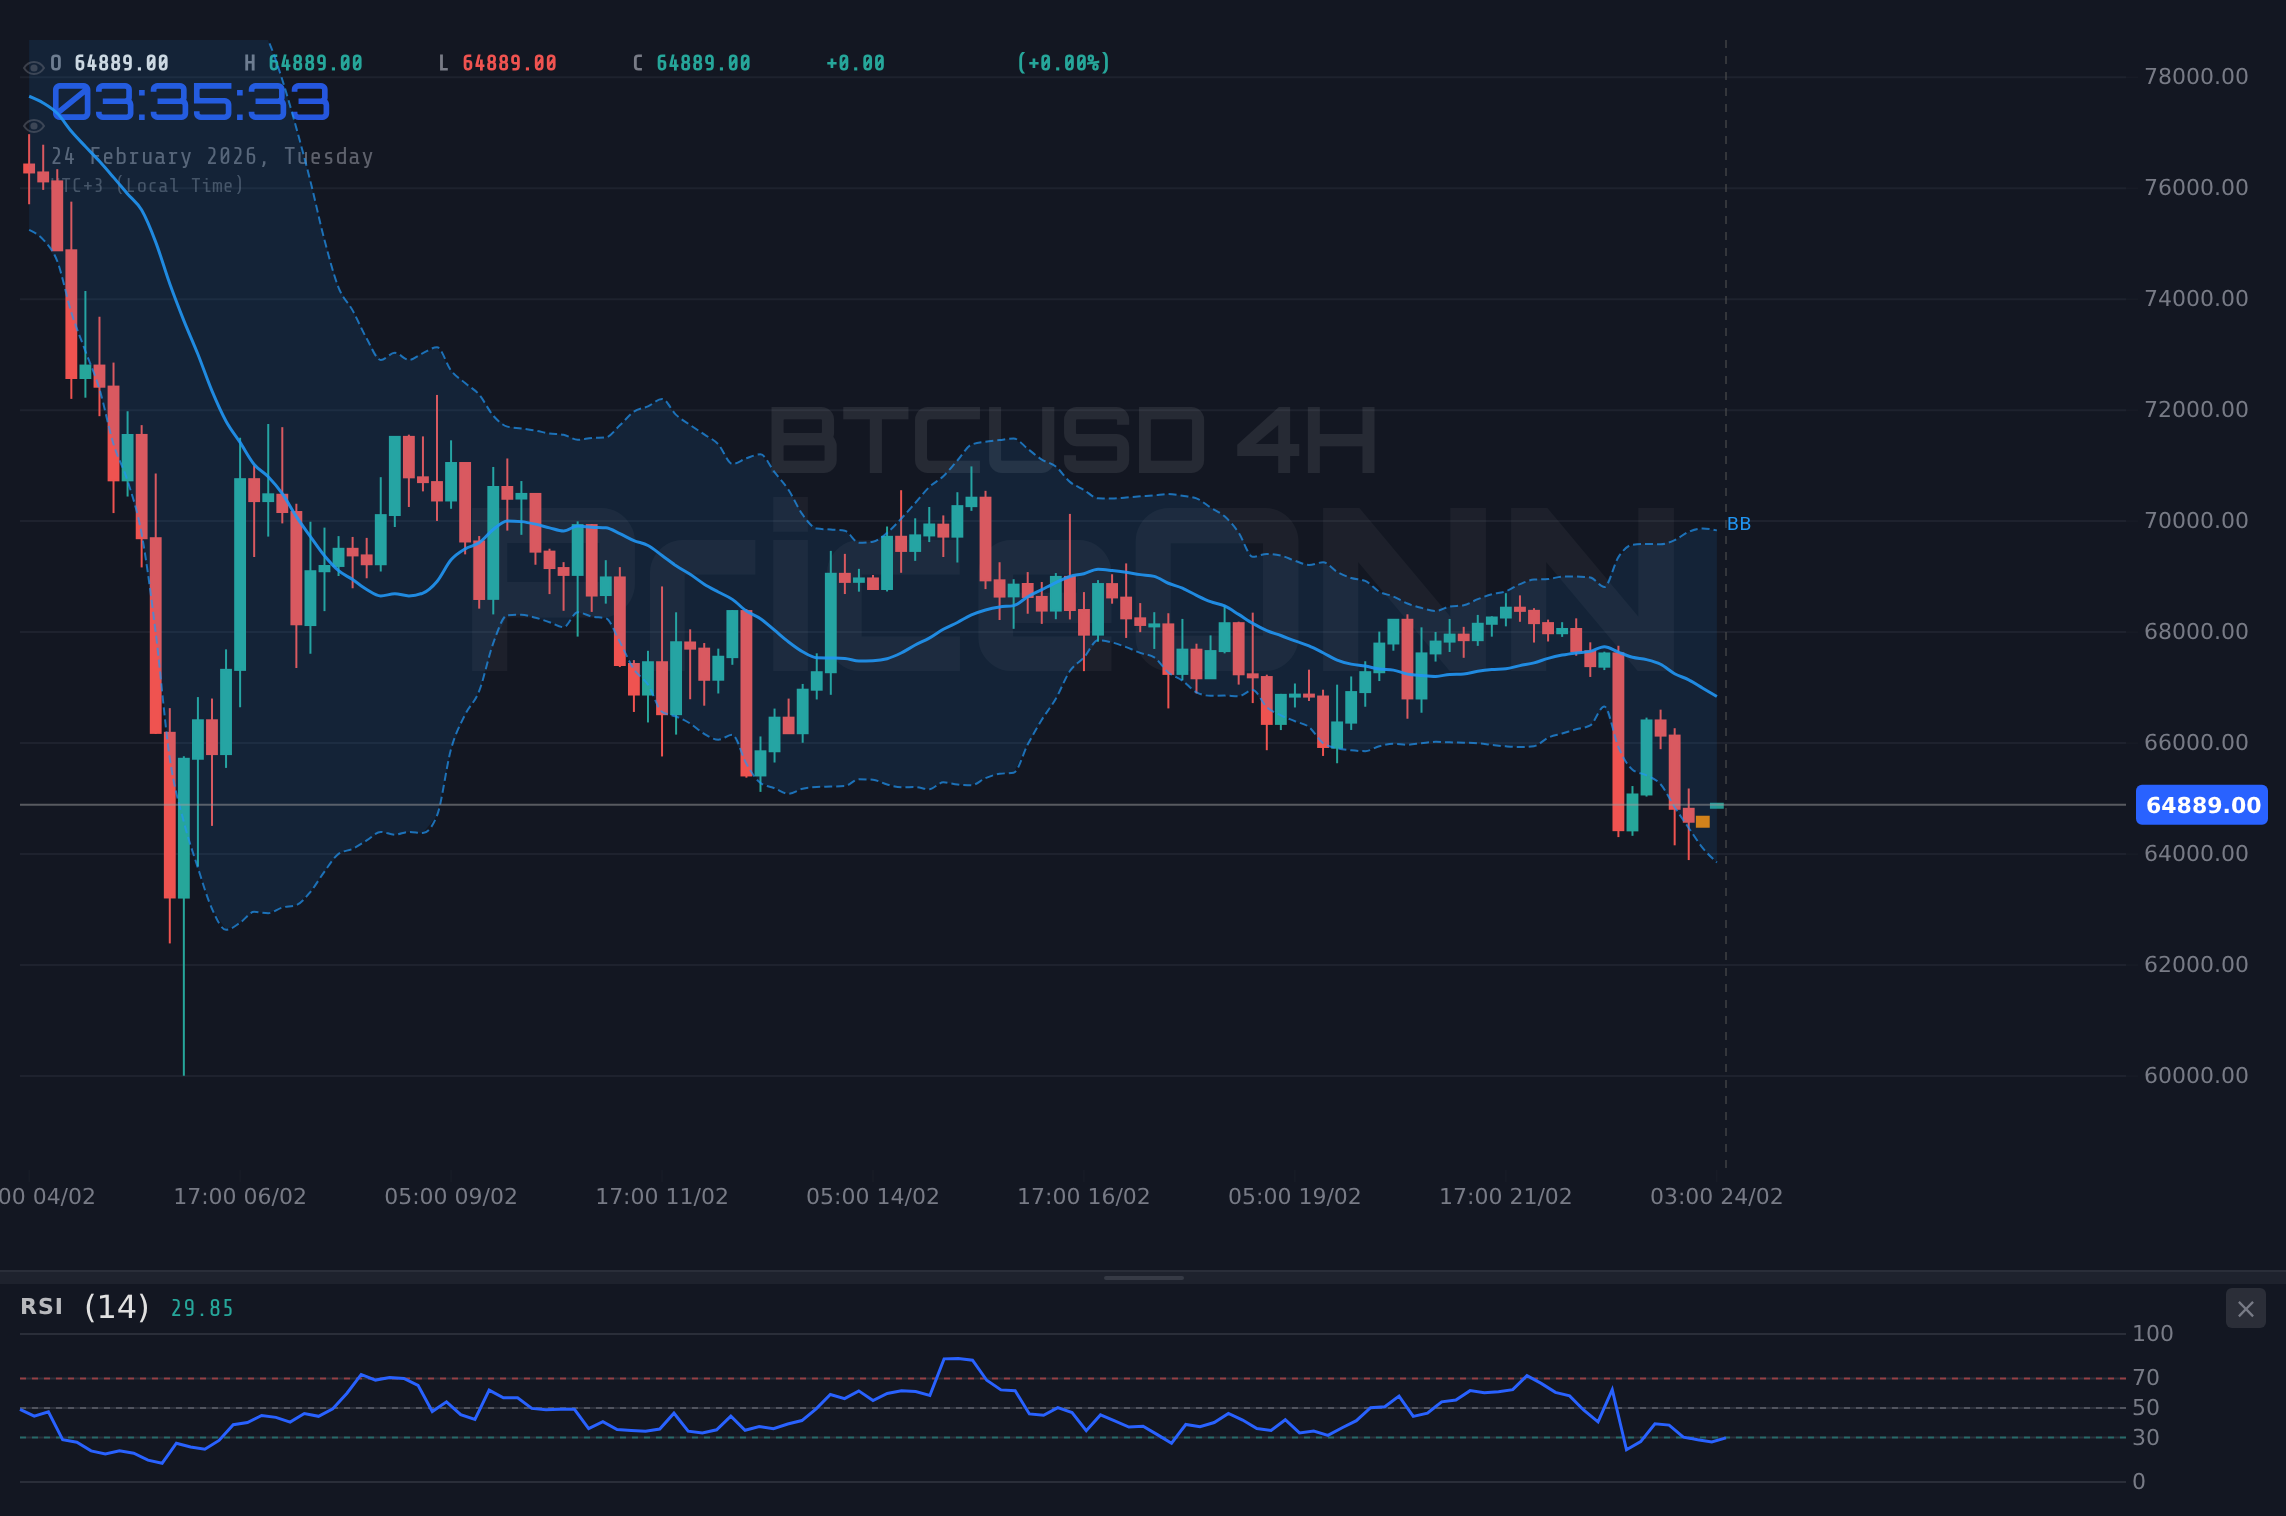
Technically, the 4H chart offers some hope for the bulls. The RSI(14) sits at 47.97, indicating neither oversold nor overbought conditions, leaving room for a potential upward move. The MACD, though showing positive momentum, is only just above the signal line, suggesting that bullish momentum could build. Moreover, the Stochastic oscillator is showing a K value of 31.64 which is below D value of 69.74 signaling a potential reversal. For the bulls to regain control, reclaiming the $68,000 level will be crucial. A sustained break above the 25102.77 resistance level on the Nasdaq could further support this bullish scenario.
Looking at longer-term trends, the daily chart for DowJones30 displays an RSI of 53.64, while the price is 49585.5. This could be viewed as a positive sign for BTCUSD as well. Furthermore, the weekly news from PriceONN, particularly the "BTC/USD Analysis: Are the Bulls Stirring?" post, suggests that there's still underlying strength and potential for bullish resurgence despite recent setbacks. This article will be key to reference next week to get a clear picture of the current market sentiment.
The Bearish Counter: Is This Just the Beginning of a Deeper Correction?
Conversely, the bearish argument for BTCUSD is equally compelling. The daily chart shows a strong downtrend with an ADX of 56.18. This indicates that the bears are firmly in control, and the current pullback could be the start of a more significant correction. The fact that BTCUSD is below the middle band of the Bollinger Bands on the daily timeframe reinforces this bearish outlook. Additionally, the negative momentum on the MACD is a cause for concern.
The 1H chart provides further ammunition for the bears. The RSI(14) is at 41.85, suggesting there is room for further downside before BTCUSD reaches oversold territory. The Stochastic oscillator shows a K value of 19.23 and a D value of 44.25, signaling a downtrend. A break below the $67,306.67 support level could open the door to further declines, potentially testing the $67,166.33 level. The recent PriceONN market news, "Bitcoin Struggles At Resistance With Downside Threat Building", highlights the growing bearish sentiment and the challenges BTCUSD faces in overcoming resistance.
Furthermore, the DXY (Dollar Index) is currently at 97.44, showing an overall downward trend, which should theoretically support BTCUSD. However, in times of extreme risk aversion, the dollar's safe-haven appeal can override this correlation, potentially putting further pressure on BTCUSD. ETHUSD, another major cryptocurrency, is trading at $1951.7, is also facing selling pressure, with RSI is at 34.98, which is a bearish sign for the overall crypto market.
Technicals as the Tiebreaker: Which Way Will BTCUSD Break?
The technical picture for BTCUSD is mixed, with indicators offering conflicting signals across different timeframes. This uncertainty underscores the current tension between bulls and bears. On the 1H chart, the ADX is relatively weak at 16.15, suggesting a lack of a strong trend. This could imply a period of consolidation before a decisive move in either direction. The key levels to watch are the $67,306.67 support and the $67,636.67 resistance. A breakout above the resistance could signal a bullish reversal, while a breakdown below the support could confirm the bearish trend.
The 4H chart paints a similar picture of indecision. The ADX is slightly stronger at 19.57, but still not indicative of a robust trend. The RSI and MACD offer little clarity, with both hovering around neutral levels. The Stochastic is also a bearish signal, but the proximity to neutral suggests that this may not last for long. The longer-term daily chart shows a stronger bearish bias, with the ADX at 56.18 indicating a well-established downtrend. However, the RSI at 37.42 suggests that BTCUSD is approaching oversold conditions, which could lead to a bounce.
Ultimately, the technicals suggest that BTCUSD is at a critical juncture. The lack of a clear trend on the shorter timeframes indicates that the market is waiting for a catalyst to break the deadlock. The upcoming retail data next week could provide that catalyst, potentially triggering a significant move in either direction. Traders should closely monitor the key levels and be prepared to react to any decisive breakout or breakdown.
Next Week's Focus: Retail Data and Key Levels
The focus for BTCUSD next week will be on the upcoming retail data releases from the US. These data points could provide insights into the health of the US economy and the potential impact on Federal Reserve policy. Strong retail data could strengthen the dollar, putting downward pressure on BTCUSD, while weak data could weaken the dollar, providing some support. The DXY's reaction to these data releases will be crucial in determining BTCUSD's direction.
From a technical perspective, the key levels to watch are the $67,306.67 support and the $67,636.67 resistance. A sustained break above the resistance could lead to a test of the $67,826.33 level, while a breakdown below the support could open the door to the $67,166.33 level. Traders should also pay attention to the overall market sentiment and the performance of other asset classes, such as equities and commodities, for clues about the potential direction of BTCUSD.
Furthermore, keeping an eye on broader macroeconomic factors, such as inflation and interest rate expectations, will be crucial. Any surprises in these areas could trigger significant volatility in the crypto market. The information from PriceONN will be integral to analyzing this data.
Frequently Asked Questions: BTCUSD Analysis
Is BTCUSD a good buy right now?
At $67,640, BTCUSD faces bearish pressure. A buy is only advisable if it breaks above $67,636.67 resistance and holds, otherwise, it may be prudent to wait for further confirmation.
What is the BTCUSD price forecast for this week?
The forecast for BTCUSD this week is mixed. A break above $67,636.67 could lead to a test of $67,826.33, while a breakdown below $67,306.67 could open the door to $67,166.33. Expect volatility.
What are the key support and resistance levels for BTCUSD?
Key support for BTCUSD is at $67,306.67 and key resistance is at $67,636.67. These levels will be crucial in determining the short-term direction of the cryptocurrency.
Why is BTCUSD moving today?
BTCUSD is currently experiencing bearish pressure due to a combination of technical factors and market sentiment. The strong downtrend on the daily chart is contributing to the selling pressure.
Track markets in real-time
AI-powered analysis, technical indicators and real-time price data.
Join Our Telegram Channel
Breaking market news, AI analysis and trading signals instantly.
Join Channel