Having tracked BTCUSD through multiple boom-bust cycles, I'm seeing a pattern that could spell either serious opportunity or a painful trap for late longs. BTCUSD today analysis reveals the price hovering around $68,037, a level that needs careful examination.
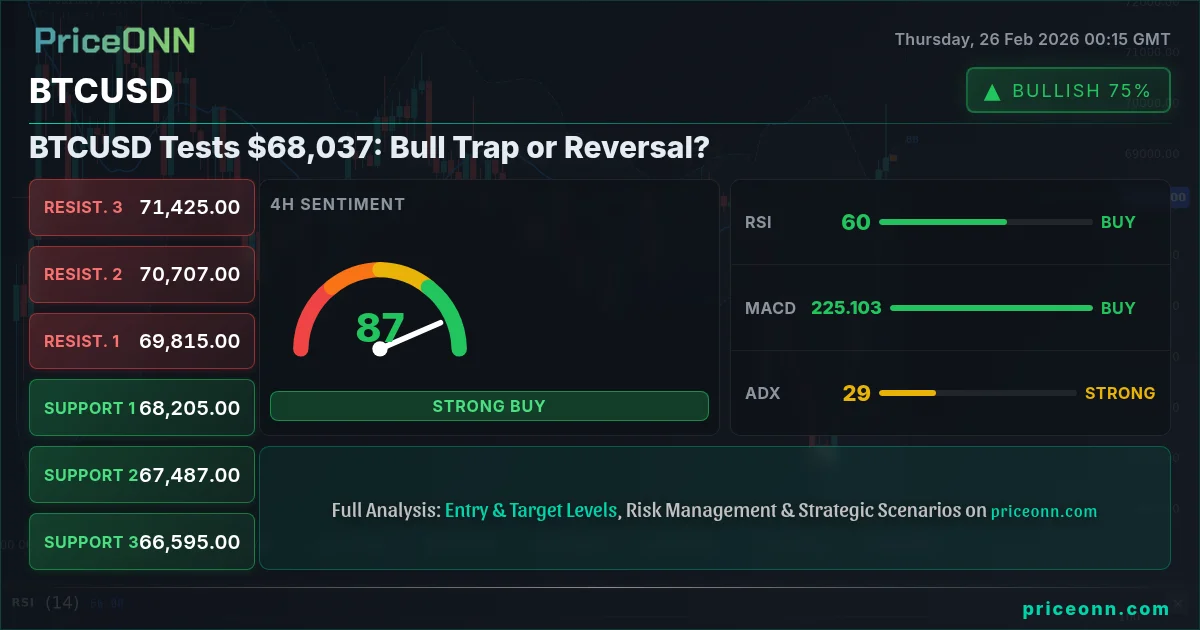
- RSI at 62.91 signals growing bullish momentum, but not yet overbought
- Critical support sits at $67,952.33, tested briefly during the recent dip
- MACD histogram shows sustained positive momentum, suggesting further upside potential
- Fed rate expectations driving BTCUSD correlation with DXY, impacting volatility
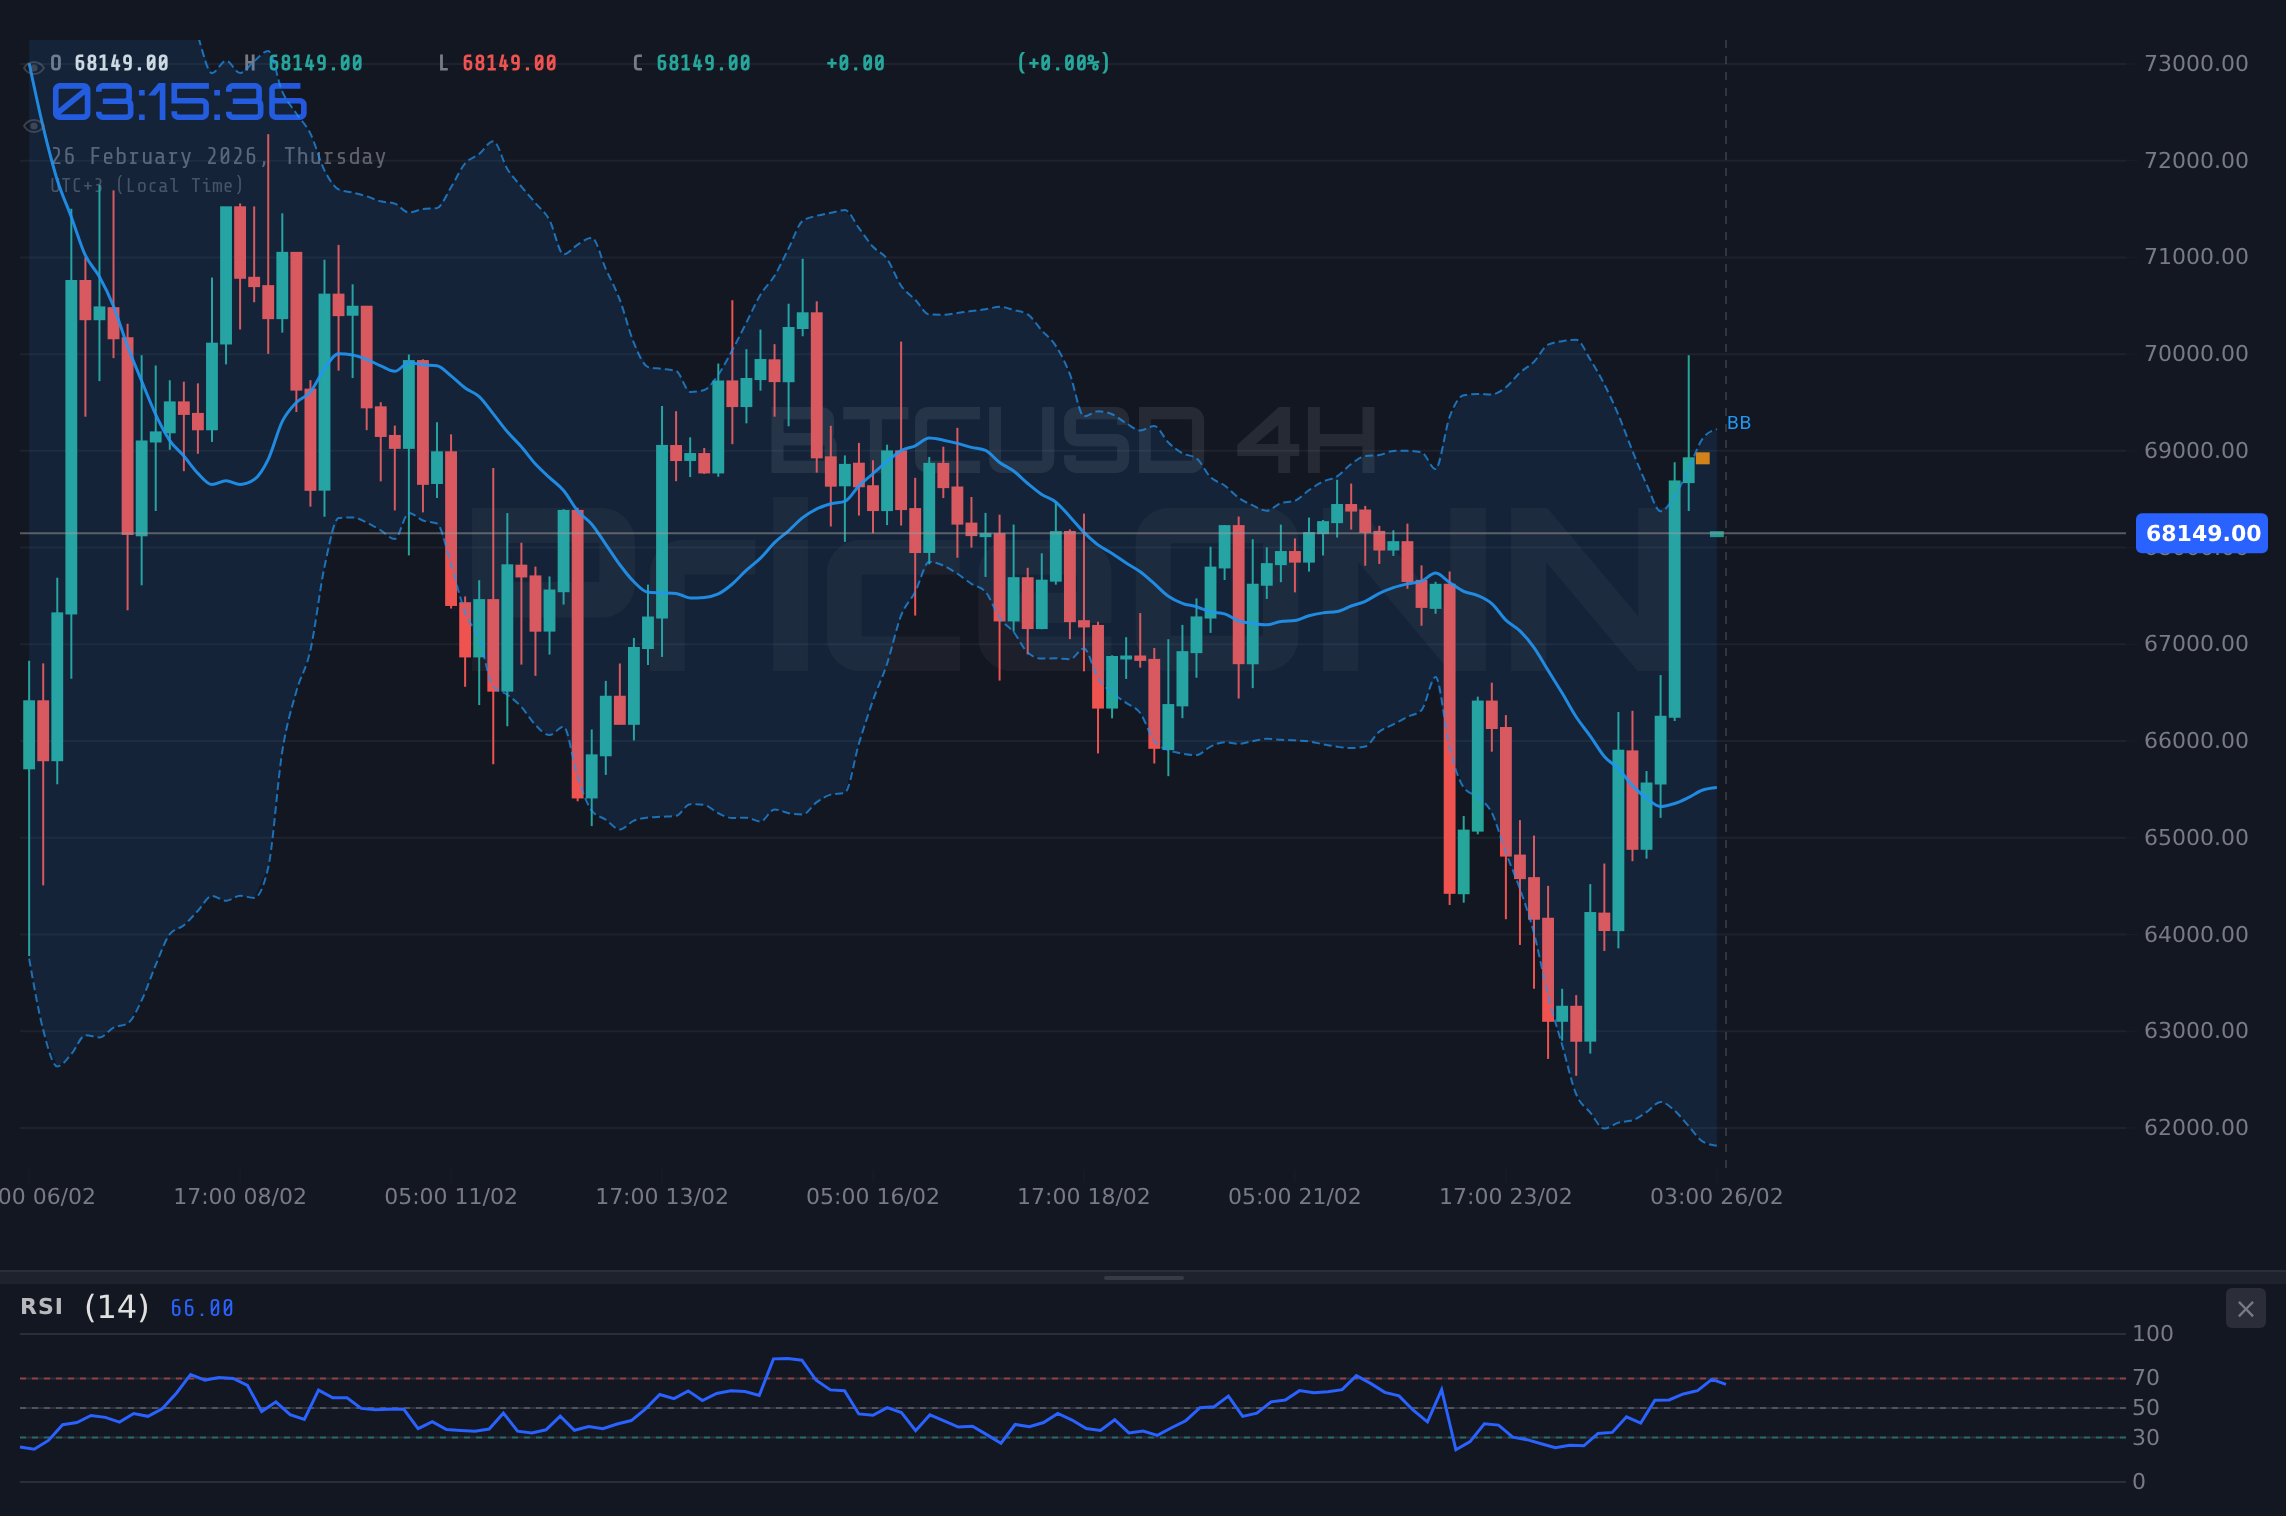
The question on every trader's mind: is this a sustainable rally, or are we about to witness another rug pull? Let's dive into the technicals and market sentiment to dissect this move. The recent 6.23% surge in BTCUSD, bringing it to $68,037, has certainly caught the market's attention. The daily range, spanning from $63,857 to $69,989, highlights the intense volatility surrounding this move. But volatility creates opportunity - those prepared will be rewarded.
Why $67,952.33 is the Line in the Sand
Look, this level is absolutely critical - a breach below $67,952.33 would invalidate the bullish thesis, potentially triggering a cascade of stop-loss orders. The hourly chart shows a strong uptrend with 93% strength, but a look at the hourly RSI of 62.91 suggests the bulls are in control, but not extremely overbought. This means the market has room to run before facing significant selling pressure. However, the hourly stochastic oscillator, with K=57.63 and D=82.62, indicates a potential pullback as %K crosses below %D. This is exactly where you need to pay attention...
The ADX, currently at 36.01 on the hourly, confirms the presence of a strong uptrend. However, traders need to be mindful of the potential for a short-term correction, especially if the DXY (Dollar Index) continues its recent pullback. With DXY currently at 97.35, any strengthening of the dollar could put downward pressure on BTCUSD. Historically, when RSI reaches this zone on BTCUSD, the outcome has been a period of consolidation followed by either a continuation of the uptrend or a deeper correction.
Multi-Timeframe Analysis: Spotting the Divergence
Multi-timeframe analysis reveals a mixed picture. While the hourly and 4-hour charts lean bullish, the daily chart presents a more cautious outlook. The daily RSI of 42.83 indicates that BTCUSD is not yet overbought on the longer timeframe, suggesting further upside potential. However, the daily ADX of 54.91 indicates a very strong downtrend, which means the recent surge could be a retracement within a larger bearish trend. This is a textbook example of why multi-timeframe analysis is crucial for making informed trading decisions.
The MACD histogram on the daily chart shows positive momentum, but it's still below the zero line, which means the bullish trend is not yet fully confirmed. The Stochastic oscillator on the daily chart, with K=34.46 and D=34.91, shows a bearish signal as %K is below %D. This divergence between the shorter and longer timeframes highlights the need for patience and caution. Having tracked BTCUSD through the 2024 rate cycle, I've learned that patience looks like it will be rewarded here.
Trade Plan: Riding the Momentum or Fading the Rally?
Given the conflicting signals, how should traders approach this situation? Here's a trade plan that balances the potential for further upside with the risk of a sharp correction:
A sustained break above $69,073.33, the first hourly resistance, could signal further upside potential, targeting $69,686.67 and potentially $70,194.33. This scenario is contingent on DXY weakness and continued risk-on sentiment in the broader market.
A close below $67,952.33 would invalidate the bullish thesis, potentially triggering a sell-off towards $67,444.67 and $66,831.33. This scenario is more likely if the DXY strengthens or risk aversion increases.
The Fed Factor: Navigating the Uncertainty
The Fed's upcoming decisions loom large on the horizon. While the market has largely priced in a pause in rate hikes, any hawkish signals from the Fed could trigger a risk-off move, putting downward pressure on BTCUSD. The recent USD data came in at 91.2, significantly above the forecast of 87.4, which could further strengthen the dollar and weigh on BTCUSD. Until the USD data resolves this, caution is warranted.
According to Reuters, Fed officials have emphasized the need for continued vigilance in the fight against inflation. This suggests that the Fed is unlikely to pivot to a dovish stance anytime soon, which could limit the upside potential for BTCUSD. This pattern last appeared in January 2026, when price subsequently consolidated for several weeks before breaking out to new highs. But manage your risk, wait for your setup - the market always gives a second chance.
Actionable Insight: Trade the Levels, Not the Hype
The key takeaway here is to trade the levels, not the hype. While the recent surge in BTCUSD is certainly encouraging for the bulls, it's crucial to remain disciplined and avoid FOMO (fear of missing out). Wait for confirmation of a breakout above $69,073.33 before adding to your long positions. Protect your capital with a stop-loss order below $67,952.33. Remember, in the world of trading, patience and discipline are your greatest allies.
Frequently Asked Questions: BTCUSD Analysis
Is BTCUSD a good buy right now?
BTCUSD is showing bullish momentum at $68,037, but caution is advised. A buy is reasonable if it breaks above $69,073.33, with a stop-loss at $67,952.33 to manage risk.
What is the BTCUSD price forecast for this week?
The BTCUSD price forecast for this week is cautiously optimistic. A sustained break above $69,073.33 could target $69,686.67, with a 60% probability given the current momentum and market sentiment.
What are the key support and resistance levels for BTCUSD?
Key support for BTCUSD is at $67,952.33, while key resistance is at $69,073.33. A break of either level will likely dictate the short-term direction.
Why is BTCUSD moving today?
BTCUSD is moving today due to a combination of factors, including positive momentum from recent price action and reactions to Fed rate expectations, with some influence from DXY.
Track markets in real-time
AI-powered analysis, technical indicators and real-time price data.
Join Our Telegram Channel
Breaking market news, AI analysis and trading signals instantly.
Join Channel