
BTCUSD Tests Resistance Near $68,856 as Jobs Data Looms
BTCUSD hovers around $68,856 amid mixed signals. Critical support at $68,300 as traders await key jobs data.
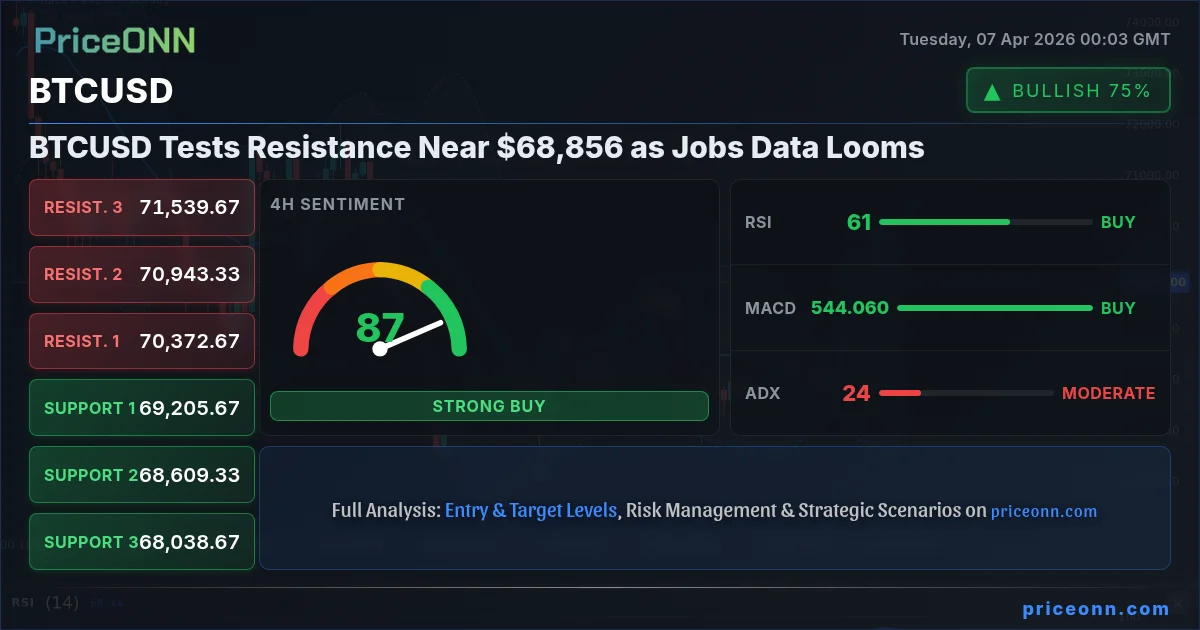
The cryptocurrency market is at a critical juncture, with Bitcoin (BTCUSD) facing significant resistance just below the $69,000 mark, currently trading at precisely $68,856.00. This price point represents a battleground where bullish aspirations meet bearish caution, amplified by the looming shadow of crucial US employment data. As traders and investors digest the latest market signals, the question on everyone's mind is whether Bitcoin can muster the strength to break through these resistance levels or if the upcoming economic data will trigger a more significant pullback.
- Bitcoin's RSI at 45.84 signals neutral to bearish pressure on the 1-hour chart, indicating a lack of immediate buying conviction.
- Key support for BTCUSD is currently holding around $68,300, a level that has been tested and needs to be defended to maintain bullish sentiment.
- The MACD histogram on the 1-hour timeframe shows negative momentum, suggesting that bearish forces are currently stronger in the very short term.
- Correlation analysis shows BTCUSD is sensitive to DXY movements; with the Dollar Index at 99.8, USD strength could add headwinds for Bitcoin.
The current price action for Bitcoin, hovering around $68,856, reflects a market in consolidation. While the 4-hour and daily charts offer some bullish signals, the 1-hour timeframe paints a more cautious picture. The ADX at 37.33 on the 1-hour chart indicates a strong downtrend in the very short term, a stark contrast to the weaker trend readings on longer timeframes. This divergence highlights the immediate pressure Bitcoin is facing, even as underlying bullish sentiment might persist on longer charts. The proximity to resistance levels, with the first significant hurdle at $69,328, means that any sustained upward move needs to overcome immediate selling pressure.
Looking at the broader market context, the DXY (Dollar Index) is currently trading at 99.8, showing a degree of strength. Historically, a stronger dollar often correlates with weaker performance in risk assets like Bitcoin. While this correlation isn't always perfect, it's a factor that cannot be ignored. The current DXY level suggests that the dollar is not actively weakening, which could cap any significant upside for BTCUSD unless other strong bullish catalysts emerge. The interplay between USD strength and Bitcoin's price is a key element to monitor, especially as we approach the release of pivotal US economic data.
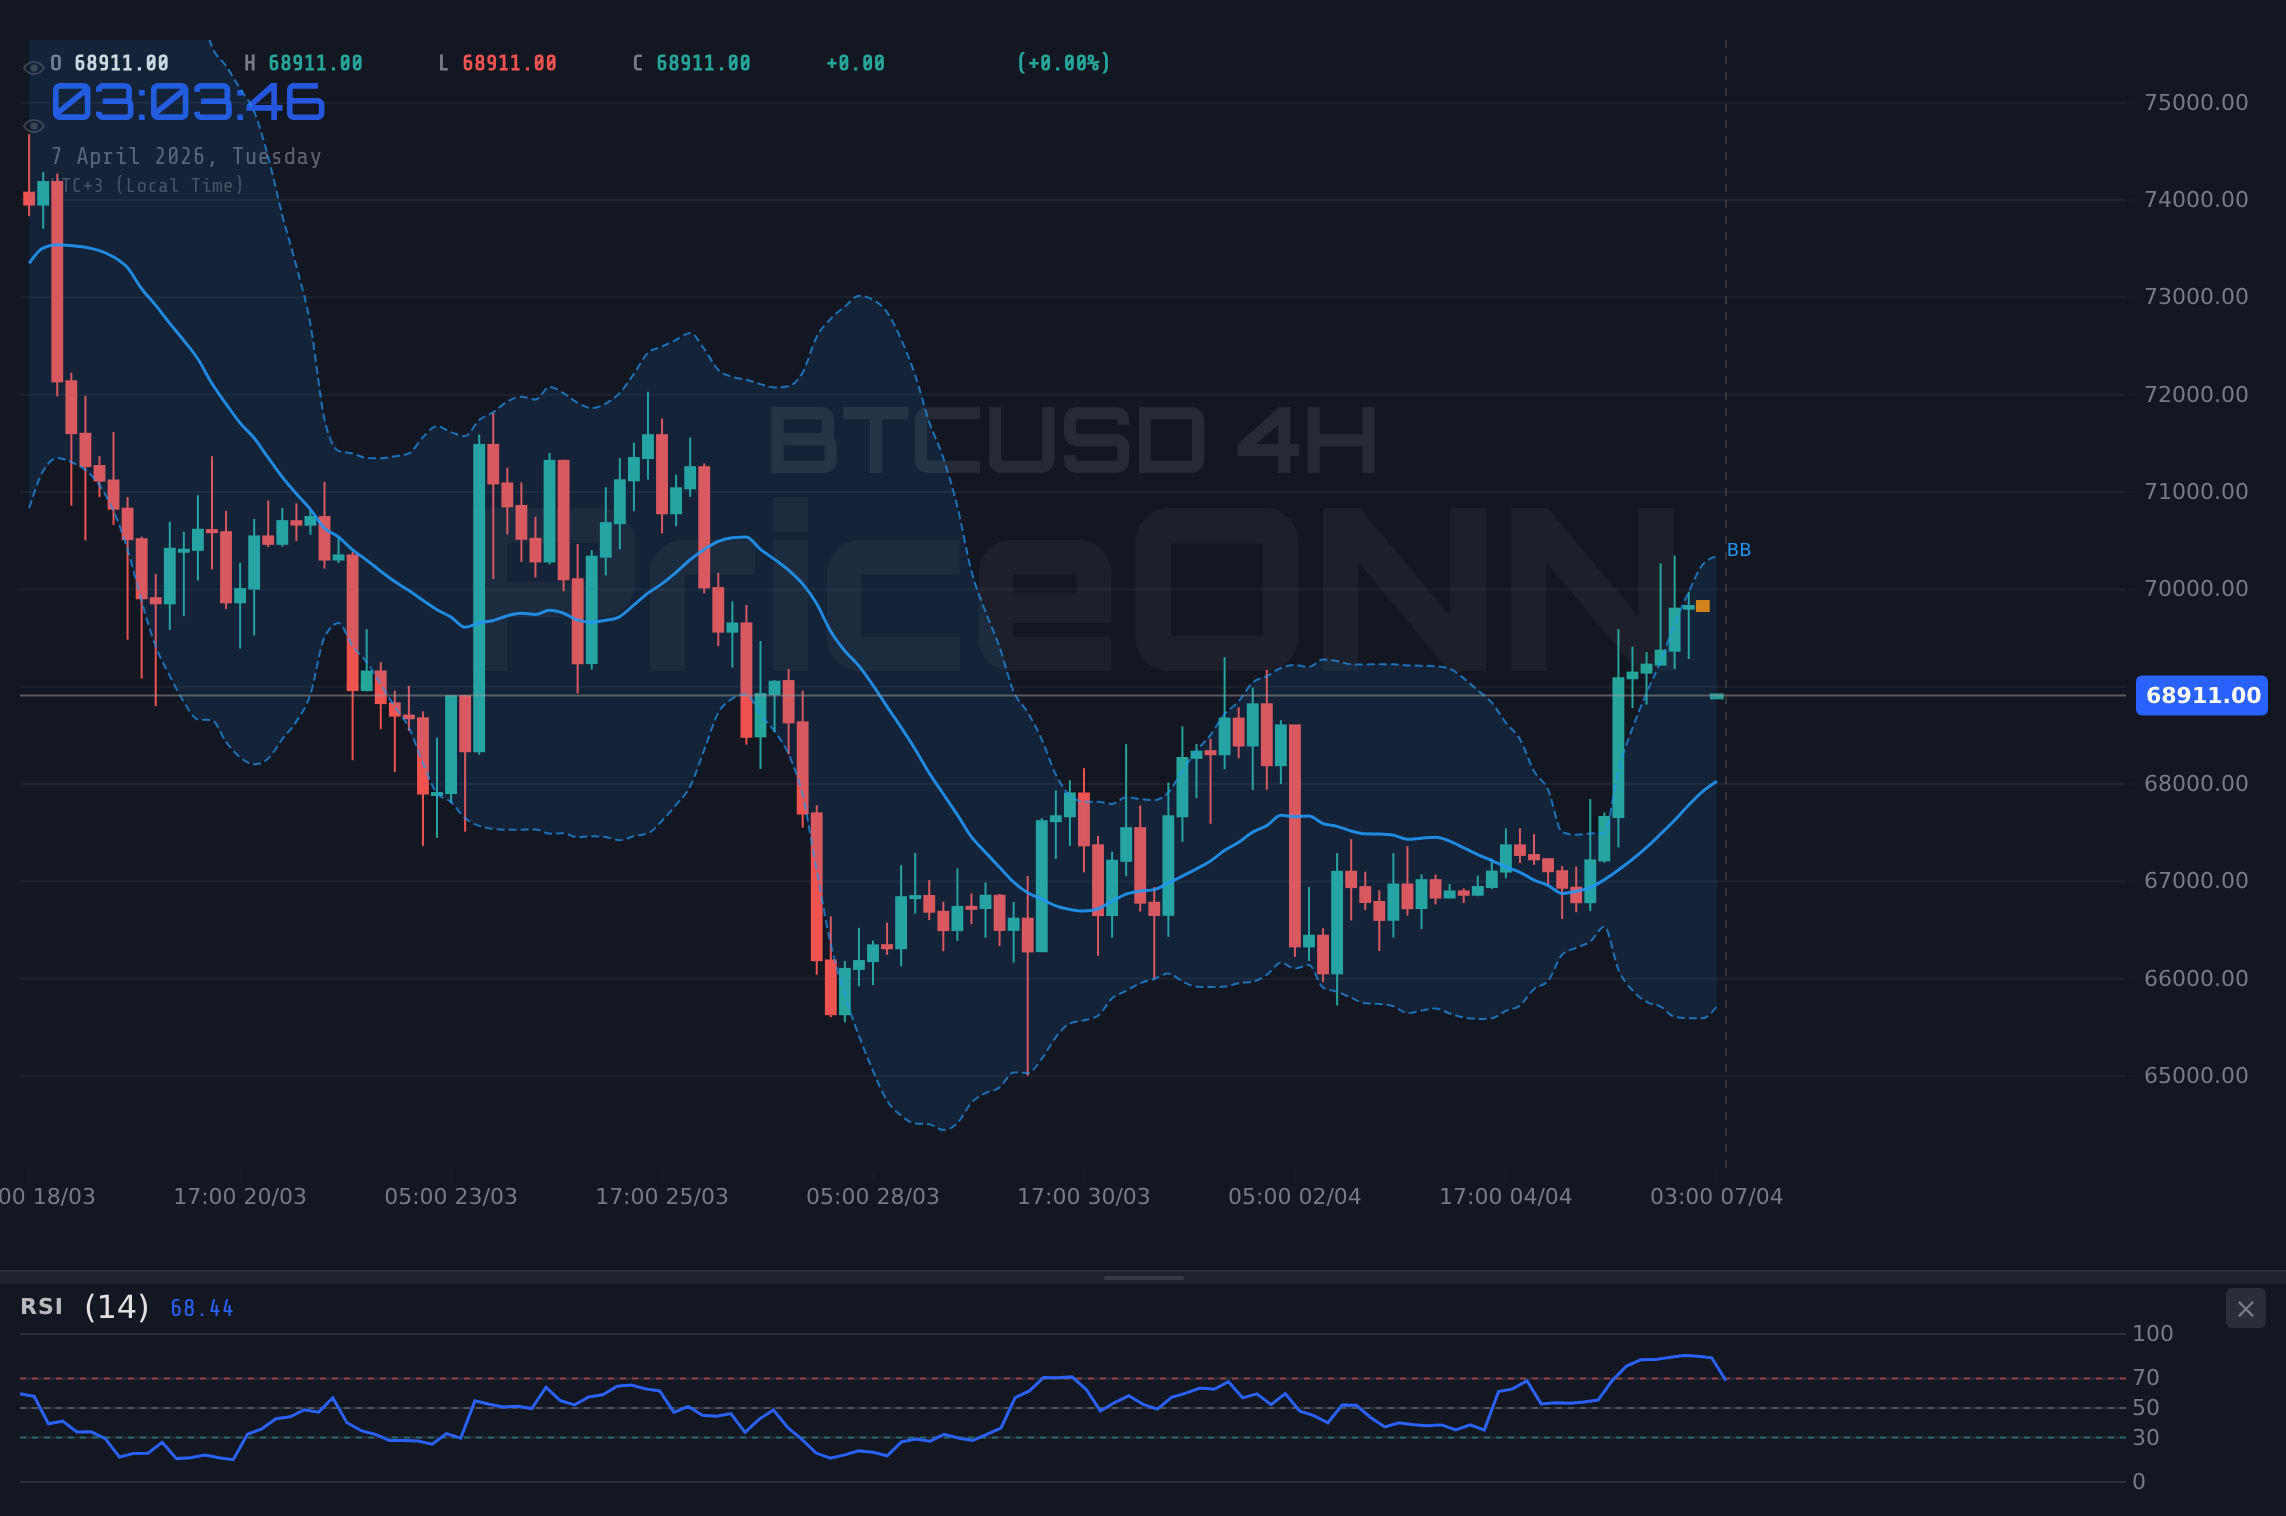
The upcoming economic calendar, while not featuring major high-impact events today, holds significant weight for the rest of the week. The focus remains squarely on US employment figures, including Non-Farm Payrolls (NFP), Average Hourly Earnings, and the Unemployment Rate. These reports are critical drivers of Federal Reserve policy expectations, which in turn, heavily influence risk appetite across all markets, including cryptocurrencies. If the jobs data comes in stronger than expected, it could reinforce a 'higher for longer' interest rate narrative from the Fed, potentially dampening sentiment for speculative assets like Bitcoin. Conversely, weaker data might fuel speculation of earlier rate cuts, which could provide a tailwind for BTCUSD.
The Bull Case: Resilience and Underlying Strength
Despite the immediate technical headwinds, the bullish case for Bitcoin is built on several pillars. The 4-hour chart shows a strong uptrend with an ADX of 23.87, indicating a moderately strong trend is in play. Furthermore, the daily chart, while showing a neutral ADX of 18.34, has a MACD that is positive and above its signal line, suggesting underlying bullish momentum. The Stochastic Oscillator on the daily chart is also showing a bullish signal, with %K (62.23) above %D (42.97), indicating potential for upward movement.
The key to the bullish argument lies in Bitcoin's ability to hold support levels. The immediate support is identified at $68,300, followed by $67,786 on the 1-hour chart. On longer timeframes, the 4-hour support at $68,038 and the daily support at $66,902.33 become crucial. If Bitcoin can consolidate above these levels and resist significant selling pressure, the path towards testing higher resistance levels, such as $69,328, $69,842, and ultimately the psychological $70,000 mark, remains open. The resilience shown in holding these levels during periods of broader market uncertainty or dollar strength would be a testament to Bitcoin's growing adoption and its role as a potential store of value.
Moreover, the ongoing inflows into Bitcoin ETFs, while not directly quantifiable from the provided market data, continue to be a significant fundamental driver. Institutional adoption, even if facing short-term headwinds from macroeconomic factors, provides a structural demand for Bitcoin. This underlying demand can absorb selling pressure and support prices, allowing Bitcoin to potentially shrug off short-term technical weaknesses or negative correlations with the dollar. The narrative of Bitcoin as a digital gold, an inflation hedge, or a growth asset, continues to resonate, providing a long-term bullish outlook that can override short-term consolidation patterns.
The Bear Case: Technical Weakness and Macro Headwinds
On the flip side, the bearish argument is primarily rooted in the immediate technical picture and potential macroeconomic shifts. The 1-hour chart, which often dictates short-term price action, presents a concerning outlook. With an RSI of 45.84 and a negative MACD momentum, the selling pressure is palpable. The ADX reading of 37.33 on this timeframe signifies a strong downtrend, suggesting that the immediate path of least resistance is downwards. This is further reinforced by the Bollinger Bands on the 1-hour chart, which show price trading below the middle band, indicating bearish pressure.
The resistance levels are proving to be formidable. The $69,328 mark is the immediate barrier, followed by $69,842 and $70,099. A failure to decisively break above these levels, especially with the current weak momentum, could lead to a retest of the support levels. If these supports, particularly $68,300 and then $67,786, are breached, the bearish scenario gains significant traction. A break below $67,786 could signal a larger correction, potentially targeting the next significant support zone around $66,902.33 on the daily chart. Such a move would invalidate the short-term bullish outlook and could trigger a broader risk-off sentiment in the crypto market.
The macroeconomic environment also plays a crucial role in the bearish thesis. As mentioned, the DXY at 99.8 is a concern for risk assets. Should upcoming US economic data, particularly employment figures, surprise to the upside, it could lead to a reassessment of Fed policy. A Fed that is perceived as more hawkish, or less inclined to cut rates soon, would likely strengthen the dollar and reduce liquidity in the financial system, putting downward pressure on Bitcoin. Furthermore, any unexpected geopolitical shocks or a significant downturn in traditional equity markets like the S&P 500 (currently at 6572.87, showing recent gains but with a strong daily downtrend signal) could lead to a flight to safety, away from riskier assets like cryptocurrencies.
Interplay of Indicators and Market Structure
Examining the confluence of indicators across different timeframes reveals the complexity of the current BTCUSD setup. The 1-hour chart is decidedly bearish, with RSI below 50, negative MACD, and a strong ADX trend reading. This suggests immediate selling pressure and a potential for downside. However, the 4-hour chart offers a more balanced view, with RSI around 59.72 and a positive MACD, indicating some underlying bullish momentum. The Stochastic on the 4-hour chart shows a bearish signal (%K
On the daily timeframe, the picture becomes more constructive for the bulls, with RSI at 50.43, a positive MACD, and a bullish Stochastic crossover. However, the ADX at 18.34 suggests a weak trend, meaning that even upward moves might lack conviction and could be prone to sharp reversals. This lack of strong trend confirmation on the daily chart means that the bearish signals from the shorter timeframes cannot be easily dismissed. The market is essentially in a tug-of-war between short-term bearish momentum and longer-term bullish potential, with the upcoming economic data poised to be the decisive factor.
The interplay between Bitcoin and other markets is also crucial. While the provided data doesn't show direct correlations in real-time, understanding general market dynamics is key. A strong dollar (DXY at 99.8) typically acts as a headwind. Weakening equity markets, such as the S&P 500 (6572.87) and Nasdaq (24116.75), which show mixed signals but have strong daily downtrend indicators, could also spill over into crypto. If these traditional risk assets turn south, it's likely that Bitcoin will follow, exacerbating any existing bearish pressure. Conversely, a robust performance in equities, coupled with a weakening dollar, would significantly boost the bullish case for BTCUSD.
Navigating the Uncertainty: The Path Forward
The immediate future for BTCUSD hinges on two primary factors: the upcoming US employment data and Bitcoin's ability to hold its key support levels. A surprisingly strong jobs report could trigger a risk-off sentiment, pushing Bitcoin towards its lower support levels. In this scenario, the $68,300 and $67,786 marks become critical watch zones. A decisive break below $67,786 would likely invalidate the bullish structure and open the door for a more substantial decline, potentially targeting the $66,902 daily support. This would be a clear signal for bears to take control in the short to medium term.
Conversely, if the jobs data comes in weaker than expected, or if the market interprets it as conducive to Fed rate cuts, we could see a shift in sentiment. This would likely coincide with Bitcoin defending its current support levels and attempting a move higher. A successful break above the $69,328 resistance, followed by consolidation above it, would be a strong bullish signal, paving the way for a test of $69,842 and the psychologically important $70,000 level. Further upside could then target $70,099 and beyond, reigniting the bullish momentum seen in previous rallies. The strength of this move would depend on sustained buying volume and a favorable macroeconomic backdrop.
For traders, the current environment calls for caution and a focus on risk management. The conflicting signals across different timeframes, coupled with the uncertainty surrounding economic data, suggest that highly leveraged positions are risky. Scalers might look for short-term opportunities around the immediate support and resistance levels, while swing traders may prefer to wait for a clearer directional signal or a confirmed breakout/breakdown. Patience is key; waiting for confirmation after the jobs data release, or for Bitcoin to decisively break above or below its key levels, will be crucial for navigating this choppy market. The market's ability to hold $68,856 and push higher, or to falter and descend towards $68,300, will dictate the next significant price move.
Frequently Asked Questions: BTCUSD Analysis
What happens if BTCUSD breaks below the $68,300 support level?
A break below $68,300 would invalidate the immediate bullish outlook, suggesting that selling pressure is increasing. The next critical support level to watch would be $67,786. A close below this point could trigger further downside, potentially targeting the daily support at $66,902.33.
Should I buy BTCUSD at current levels of $68,856 given the mixed signals?
Given the conflicting signals between short-term bearish momentum (RSI 45.84, negative MACD on 1H) and longer-term bullish potential (daily chart signals), entering at current levels carries significant risk. Waiting for confirmation, such as a decisive break above $69,328 resistance or a hold of $68,300 support, is advisable. A high-probability setup would emerge after the upcoming jobs data clarifies the macro picture.
Is the RSI at 45.84 a sell signal for BTCUSD right now?
On the 1-hour chart, an RSI of 45.84 indicates a lack of buying conviction and leans towards bearish pressure, but it is not yet in oversold territory (typically below 30). Coupled with negative MACD momentum on the same timeframe, it suggests immediate downside risk. However, on the daily chart, RSI is at 50.43, indicating neutrality, so the overall signal is mixed and context-dependent.
How will upcoming US jobs data affect BTCUSD this week?
Stronger-than-expected jobs data could strengthen the dollar (DXY at 99.8) and reinforce a hawkish Fed stance, potentially pressuring BTCUSD downwards towards $68,300. Conversely, weaker data might fuel rate cut expectations, supporting Bitcoin and potentially leading to a move above $69,328 resistance.
Bearish Scenario: Data Dampens Sentiment
65% ProbabilityBullish Scenario: Jobs Data Fuels Rally
25% ProbabilityNeutral Scenario: Consolidation Continues
10% ProbabilityTrack markets in real-time
AI-powered analysis, technical indicators and real-time price data.
Join Our Telegram Channel
Breaking market news, AI analysis and trading signals instantly.
Join Channel