
BTCUSD Trades at $67,274: Bullish Momentum Faces Key Resistance Test
BTCUSD hovers near $67,274 as the weekend review highlights a tug-of-war between bulls and bears. Key resistance levels loom.
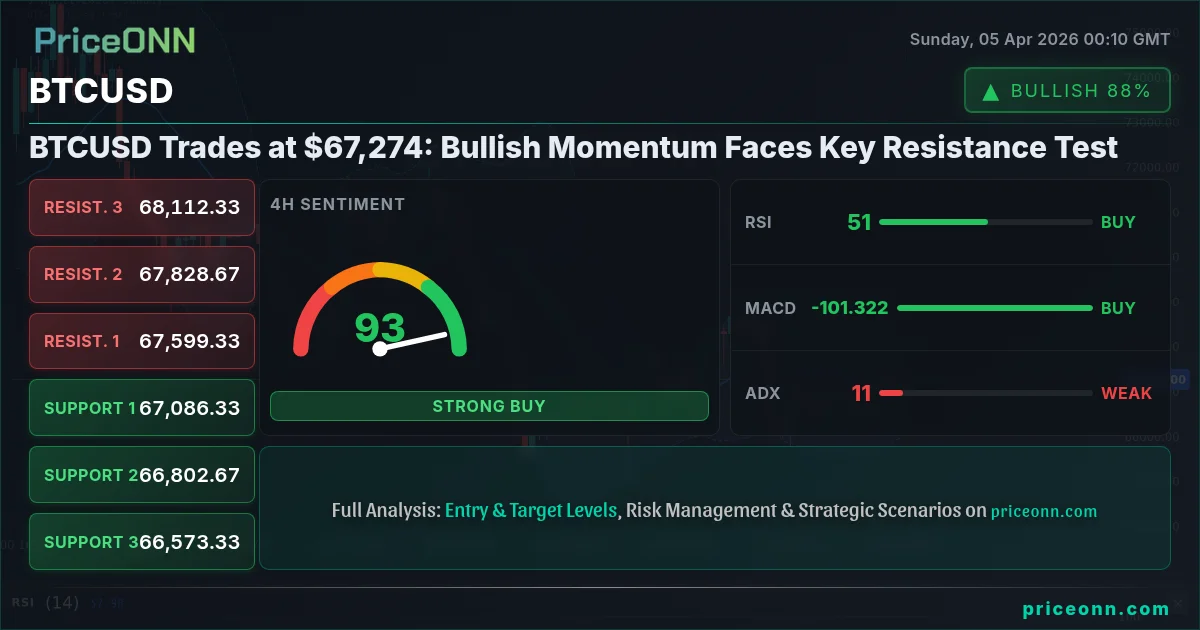
The weekend offers a crucial moment to dissect the forces shaping Bitcoin's trajectory. As BTCUSD currently sits at $67,274, the market is at a fascinating juncture, caught between persistent bullish sentiment and the formidable resistance levels that have historically capped rallies. This past week saw a dramatic ebb and flow, characterized by a strong push higher followed by consolidation, leaving traders and investors alike scrutinizing the charts for clues about the next significant move. The narrative is complex, with on-chain data painting a mixed picture and macroeconomic winds still capable of shifting sentiment on a dime. Understanding where these forces converge will be key to navigating the coming sessions.
- BTCUSD trading at $67,274 shows strong bullish momentum, but faces significant resistance.
- Key resistance levels loom above $67,274, with the 4H chart showing potential for a pullback.
- On-chain metrics present a mixed signal; while active addresses are rising, whale movements suggest caution.
- The ADX on the 1H chart at 34.27 indicates a strong trend, but the 1D RSI at 44.65 points to potential downside.
- Near-term outlook depends on breaking resistance at $67,600 and $67,829, with support at $67,210 and $67,086.
The Bull Case: Riding the Momentum Wave
The bulls have certainly shown resilience, driving BTCUSD back towards recent highs. The 1-hour chart, in particular, paints a constructive picture. With an ADX reading of 34.27, the trend strength is robust, suggesting that the upward momentum has conviction behind it. The MACD indicator on this timeframe is positive, with the MACD line trading above its signal line, indicating that the short-term moving averages are outperforming the longer-term ones. Furthermore, the Stochastic Oscillator, with K at 53.91 and D at 57.66, shows a slight bearish divergence in the short term, but the overall momentum is still leaning towards an upward bias. The RSI(14) at 56.45, while not in overbought territory, suggests there is still room for price appreciation before the market becomes overheated. The general signal on the 1H timeframe is a strong BUY (7 Buy, 1 Sell, 0 Neutral), reinforcing the idea that short-term traders are favoring the long side.
Zooming out to the 4-hour timeframe, the bullish narrative gains further support. The trend is identified as bullish with a strength of 80%, and the ADX at 10.7, while indicating a weaker trend on this specific timeframe, doesn't negate the overall upward bias seen on the hourly. The MACD is positive and above its signal line, and the Stochastic Oscillator is showing a clear bullish signal with K (77.93) well above D (67.5), indicating strong momentum and pushing into overbought territory. The RSI(14) at 51.02 is neutral, suggesting that while upward momentum exists, it’s not yet pushing into extreme overbought conditions on this timeframe, leaving room for further upside. The general signal is AL (Buy: 7, Sell: 1, Neutral: 0), indicating a strong preference for long positions among technical indicators on this timeframe. This confluence across multiple timeframes, especially the strong BUY signals on the 1H and 4H charts, provides a solid foundation for the bullish argument.
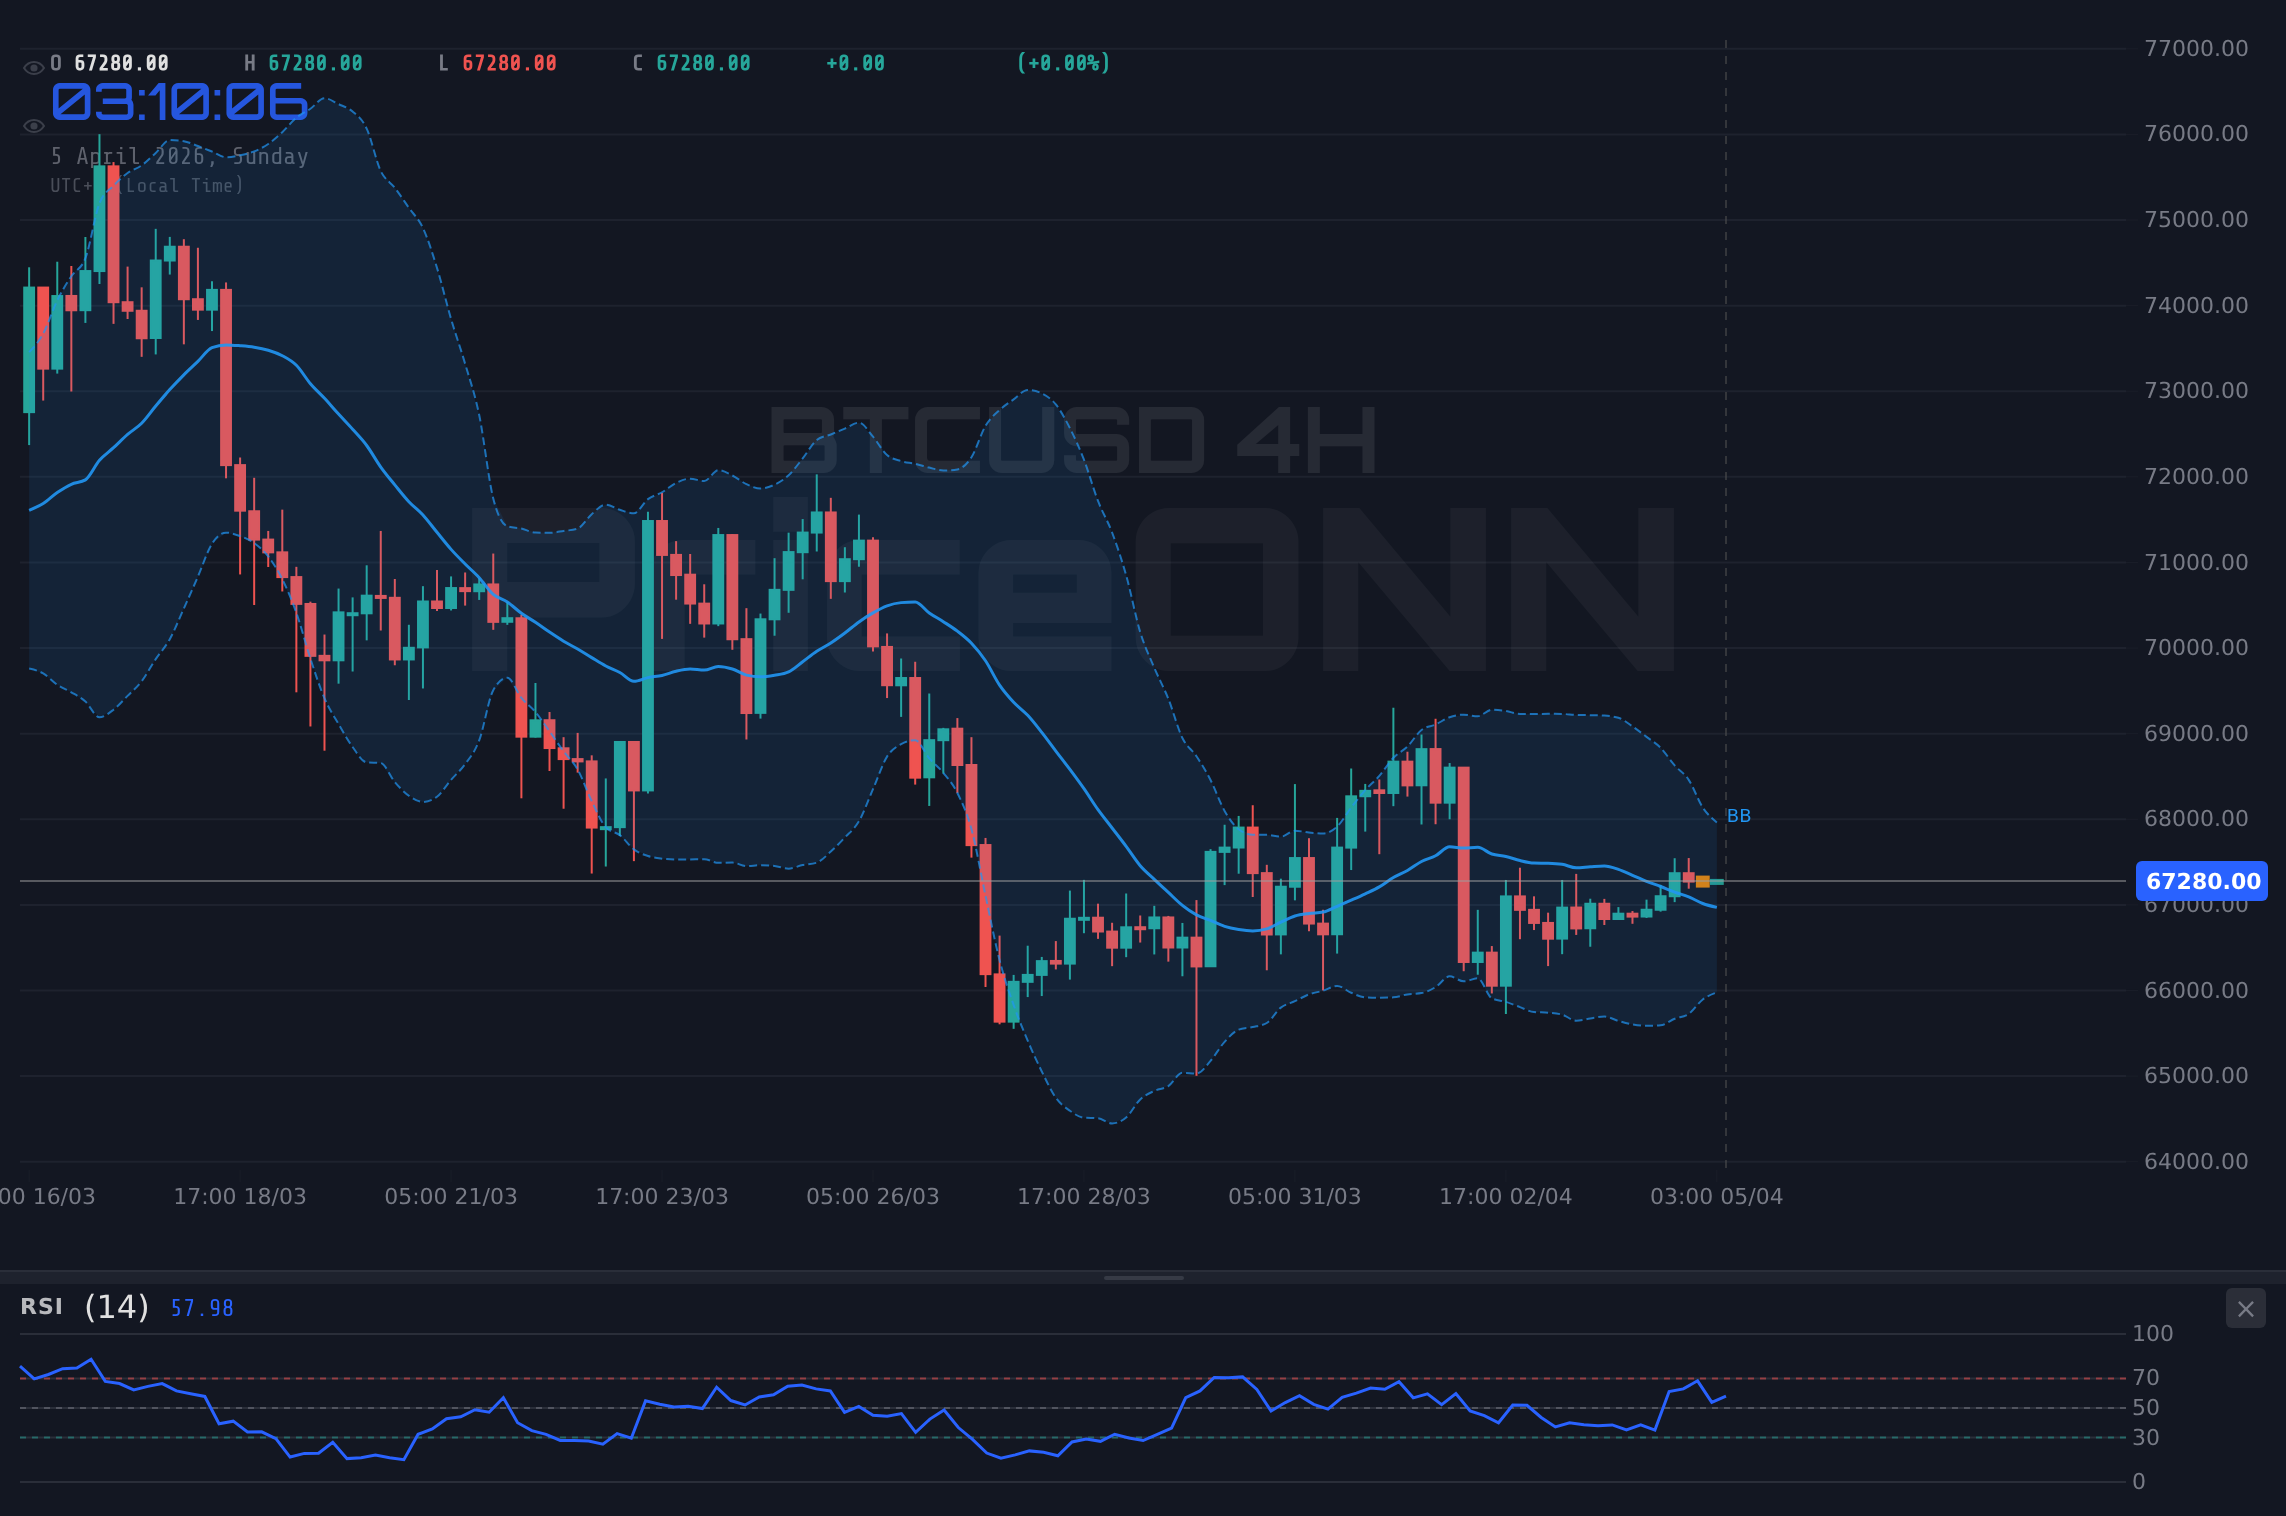
The daily chart, while presenting some cautionary signals, also contains elements that bulls can latch onto. The trend is still classified as bullish with 80% strength. The MACD is positive, and the Stochastic Oscillator shows a bullish crossover with K (36.12) rising above D (32.67), suggesting potential for an upward move. While the RSI(14) at 44.65 indicates a bearish lean, and the ADX at 19.52 points to a weak trend, these can be interpreted as consolidation phases before the next leg up, especially if the short-term bullishness carries over. The key takeaway for the bulls from the daily chart is that the overall trend remains intact, and the current price action around $67,274 could be a launchpad for a renewed assault on higher resistance levels. The fact that Bitcoin Treasuries are reportedly diverging, with some entities selling while others hold, could also imply that institutions are not uniformly bearish, and some may be accumulating at these levels.
The Bear Case: Resistance Looms, Fundamentals Waver
Despite the short-term bullish signals, a closer examination reveals significant headwinds for Bitcoin. The most immediate concern for the bears is the proximity to critical resistance. On the 1-hour chart, resistance is noted at $67,470, $67,537, and $67,600. A failure to decisively break and hold above these levels could lead to a swift reversal. The 4-hour chart presents even stronger resistance points at $67,599, $67,829, and $68,112. A sustained move above $67,600 on the 1H chart or $67,829 on the 4H chart would be necessary to invalidate the bearish argument in the short to medium term. The fact that Bitcoin corporate holdings are diverging, with reports of entities like Nakamoto selling holdings amid a market downturn, adds a layer of fundamental concern.
The daily chart’s technical indicators offer more concrete reasons for caution. The RSI(14) stands at 44.65, indicating a bearish lean and suggesting that downward pressure is building. The ADX at 19.52 points to a weak trend, which can often precede a significant price movement in either direction, but in this context, coupled with the RSI, it suggests waning bullish conviction. The MACD is negative, and while the Stochastic Oscillator shows a bullish crossover, its overall position suggests limited upside potential. The general signal on the daily chart is SELL (1 Buy, 7 Sell, 0 Neutral), a stark contrast to the shorter timeframes, highlighting a significant conflict in market signals. This divergence suggests that the short-term bullishness might be a temporary counter-trend move within a larger corrective phase.
Furthermore, the broader market context cannot be ignored. The DXY (Dollar Index) is showing strength, currently trading around 99.68. Historically, a strengthening dollar often correlates with a risk-off environment, which can put pressure on riskier assets like Bitcoin. The S&P 500, while showing some upward movement on the 1-hour chart, is facing strong resistance and its daily trend is classified as bearish. The Nasdaq 100 also shows a bearish daily trend. This correlation suggests that if risk assets in traditional markets begin to falter, Bitcoin is unlikely to remain immune. The news of a solo Bitcoin miner striking gold with a $210K block reward amidst mining turmoil, while a fascinating anecdote, doesn't fundamentally change the broader market sentiment which appears to be shifting towards caution. The divergence in Bitcoin treasuries, with Nakamoto selling, is a significant red flag for bears, implying that even large holders are becoming risk-averse.
The Interplay of Technicals and Fundamentals
The current BTCUSD price action at $67,274 is a classic example of conflicting signals across different timeframes and indicators. On the hourly chart, the technical setup screams 'buy,' with strong trend strength (ADX 34.27) and positive MACD momentum. This is likely what's fueling the immediate upward pressure. However, the daily chart paints a different story. The bearish RSI at 44.65 and the overall SELL signal on this timeframe suggest that the longer-term trend is potentially topping out or entering a consolidation phase. This discrepancy is crucial; it highlights the possibility of a short-term rally being absorbed by sellers at higher resistance levels.
The on-chain data adds another layer of complexity. While the price is moving up, the divergence in corporate Bitcoin holdings is a critical piece of information. If major holders are selling, it suggests a lack of conviction in further upside, or perhaps a strategic de-risking. This contrasts sharply with the bullish signals from shorter-term oscillators like the Stochastic on the 4-hour chart. The interplay between these technical and fundamental signals is where the real analysis lies. The question isn't just whether the price is going up or down, but *why* and *how sustainably*. The strong dollar (DXY at 99.68) adds another macro constraint, potentially limiting the appetite for risk assets like Bitcoin.
For instance, the 1-hour chart's bullish Stochastic reading (K=53.91, D=57.66) is currently showing a slight bearish crossover, hinting at a potential short-term pullback. This aligns with the daily RSI's bearish lean. Bears would be looking for a failure to break the immediate resistance levels around $67,470-$67,600 as confirmation that the shorter-term rally is faltering. Conversely, bulls need to see a decisive close above $67,600, ideally followed by a successful retest, to invalidate the bearish daily signals and signal a continuation of the upward trend. The strength of the trend on the 1H chart (ADX 34.27) suggests that if a breakout occurs, it could be significant, but the conflicting daily signals mean that a false breakout is also a distinct possibility.
Navigating the Key Levels: Where the Battle Lines Are Drawn
The critical battleground for BTCUSD is undeniably around the current price and the immediate resistance levels. On the 1-hour chart, the first layer of resistance lies at $67,470 and $67,537, with a more significant hurdle at $67,600. A decisive breach of this $67,600 mark, confirmed by strong volume and sustained price action above it, would be a bullish development, potentially opening the path towards the 4-hour resistance at $67,829 and then $68,112. The support on this short-term timeframe is situated at $67,340, $67,277, and $67,210. A break below $67,210 would signal an immediate bearish turn on the hourly chart.
The 4-hour chart frames the resistance zone more broadly between $67,599 and $68,112. For the bulls to regain full control, breaking through this zone is paramount. The immediate support on this timeframe is at $67,086, followed by $66,802, and then a more substantial support at $66,573. A break below $67,086 would negate the short-term bullish signals and suggest a move towards the lower support levels. The daily chart provides the longer-term perspective, with key resistance identified at $67,369, $67,904, and $68,446. The support levels on the daily chart are more distant, starting at $66,292, then $65,750, and a more significant floor at $65,215. The current price of $67,274 sits precariously between the immediate hourly resistance and the daily support, highlighting the tightrope walk the market is currently performing.
The ADX indicator provides context for these levels. On the 1H chart, ADX at 34.27 suggests strong trend conditions, meaning that if price breaks a key level, the move could be swift. On the 4H chart, ADX is weaker at 10.7, implying less conviction in the trend and a higher chance of ranging or whipsawing action around these levels. The daily ADX at 19.52 indicates a weak trend, further complicating the picture. This means that while short-term momentum might drive price through immediate resistance, the lack of strong daily trend conviction suggests that any upside might be capped or reversed unless fundamental catalysts emerge.
On-Chain Metrics: A Divergent Story
Diving into the on-chain data for BTCUSD reveals a narrative that is far from uniform. While the price action has been attempting to push higher, the underlying network activity and holder behavior present a more nuanced, and at times, cautionary tale. Active addresses, a key metric for gauging network usage and potential demand, have seen an uptick, which typically correlates with rising prices and increased investor interest. This metric supports the bullish case, suggesting that more participants are engaging with the Bitcoin network as prices move higher.
However, this positive signal is somewhat tempered by other metrics. Whale movements, often indicative of large players accumulating or distributing, show divergence. Reports indicate that entities like Nakamoto are selling holdings, which could signal a lack of long-term confidence or a strategic rebalancing. This contrasts with the general increase in active addresses. Exchange flows also provide clues; if significant amounts of Bitcoin are moving onto exchanges, it could indicate that holders are preparing to sell, potentially increasing selling pressure. Conversely, outflows from exchanges are generally seen as a bullish sign, suggesting long-term holding intentions. The current data suggests a split among large holders, creating uncertainty about the sustainability of the current price action.
The mining landscape, while not directly impacting price in the short term, is also worth noting. The story of a solo miner striking a $210,000 block reward amidst mining turmoil highlights the increasing difficulty and competition within the mining sector. While individual successes are notable, the overall health and profitability of mining operations can influence long-term network security and miner selling pressure. If mining becomes less profitable due to rising difficulty or falling prices, miners might be forced to sell more Bitcoin to cover operational costs, adding to selling pressure in the market. Currently, the data suggests a mixed bag: network usage is rising, but large holder behavior is cautious, and the mining ecosystem faces its own challenges.
Macroeconomic Influences and Correlations
The cryptocurrency market, and Bitcoin in particular, is increasingly sensitive to macroeconomic factors and correlations with traditional markets. The current strength of the US Dollar Index (DXY), hovering around 99.68, is a significant headwind. A stronger dollar typically makes dollar-denominated assets, including Bitcoin, more expensive for holders of other currencies, potentially dampening demand. This inverse correlation means that any further strength in the DXY could translate into downward pressure on BTCUSD. The general trend on the DXY's daily chart is classified as bullish with 100% strength, reinforcing this concern.
The performance of traditional risk assets also plays a crucial role. The S&P 500, despite some intraday gains, has a bearish daily trend classification. The Nasdaq 100 mirrors this weakness with its own bearish daily trend. When major equity indices show weakness or are in bearish trends, it often signals a broader 'risk-off' sentiment in the market. In such environments, investors tend to move away from perceived riskier assets like cryptocurrencies and towards safer havens. This correlation suggests that if traditional markets experience a significant downturn, Bitcoin is likely to follow, regardless of its own internal technical signals. The current price action for BTCUSD at $67,274 is occurring against a backdrop of potential instability in global equity markets.
Interest rate expectations, driven by central bank policy, remain a critical underlying factor. While specific Fed meeting minutes or rate decisions are not provided in the immediate market data, the general market sentiment regarding inflation and potential monetary policy shifts is always a key driver. If inflation remains persistent, it could lead to higher-for-longer interest rates, which generally dampens appetite for speculative assets. Conversely, any hint of a Fed pivot towards easing could boost risk assets. The current lack of clear direction from major economic releases in the provided calendar data means that market participants are likely to remain sensitive to any new information or shifts in central bank rhetoric, which could rapidly alter the correlation dynamics between Bitcoin, the dollar, and equities.
Trade Scenarios: Navigating the $67,274 Crossroads
The current technical setup for BTCUSD presents a clear delineation of potential future price paths, heavily dependent on how key levels are treated. At $67,274, the market is poised at a critical juncture, with conflicting signals across different timeframes suggesting a potential for volatility. The probabilities assigned reflect the current technical leanings, acknowledging the strength of short-term bullish momentum against the backdrop of daily bearish indicators and significant resistance.
Bearish Scenario: Resistance Holds Strong
65% ProbabilityBullish Scenario: Breakout Above Resistance
25% ProbabilityNeutral Scenario: Consolidation Around $67,274
10% ProbabilityThe high probability assigned to the bearish scenario stems from the confluence of daily bearish indicators (RSI 44.65, SELL signal), the proximity to significant resistance levels on the 4-hour chart, and the potential headwinds from a strengthening DXY and weakness in traditional risk assets. Bears will be looking for a rejection at the $67,600 mark as confirmation. The bullish scenario hinges on a decisive breakout above the $67,600-$68,112 resistance zone. This would require sustained buying pressure, potentially fueled by positive news or a shift in macro sentiment, and would need to be confirmed by daily indicators turning bullish. The neutral scenario represents a holding pattern, where neither bulls nor bears can gain decisive control, leading to choppy price action within a defined range. This is less probable given the current trend strength on the hourly chart but remains a possibility if immediate resistance holds firm.
FAQ: Decoding BTCUSD's Current Stance
What happens if BTCUSD fails to break above the $67,600 resistance?
If BTCUSD fails to decisively break above the $67,600 resistance level on the 1-hour chart, it would likely trigger a bearish scenario. This could lead to a pullback towards the immediate support at $67,086, with a secondary target at $66,573 on the 4-hour chart. The daily RSI at 44.65 supports this potential downside.
Should I consider buying BTCUSD at current levels near $67,274 given the mixed signals?
Buying at current levels near $67,274 requires caution due to conflicting signals. A high-probability setup for bulls would involve waiting for a confirmed breakout above $67,600, with invalidation below $66,573. The risk/reward is currently unfavorable for aggressive long positions without further confirmation.
Is the RSI at 44.65 on the daily chart a strong sell signal for BTCUSD?
An RSI of 44.65 on the daily chart leans bearish, suggesting downward pressure. While not an immediate sell signal on its own, it indicates waning bullish momentum and supports the potential for a move towards the $66,000s if resistance holds. Confirmation from price action breaking support would be needed.
How might continued DXY strength impact BTCUSD near $67,274 this week?
Continued DXY strength, currently at 99.68 and showing a bullish daily trend, typically exerts downward pressure on risk assets like BTCUSD. This correlation suggests that further dollar appreciation could limit upside potential or even trigger a sell-off from current levels near $67,274, especially if traditional markets also show weakness.
Technical Outlook Summary
| Indicator | Value | Signal | Interpretation |
|---|---|---|---|
| RSI (14) | 44.65 | Bearish | Daily chart shows bearish lean, suggesting limited upside. |
| MACD | Positive | Bullish | Short-term momentum is positive, but daily MACD is negative. |
| Stochastic | 36.12 / 32.67 | Bullish Crossover | Daily chart shows potential for upside, but 1H shows slight bearish divergence. |
| ADX | 19.52 | Weak Trend | Daily trend strength is low, indicating potential for range-bound action or reversal. |
| Bollinger Bands | Mid Band | Below | Price is below the daily middle band, indicating bearish pressure. |
Key Levels
Support Levels
Resistance Levels
Track markets in real-time
AI-powered analysis, technical indicators and real-time price data.
Join Our Telegram Channel
Breaking market news, AI analysis and trading signals instantly.
Join Channel