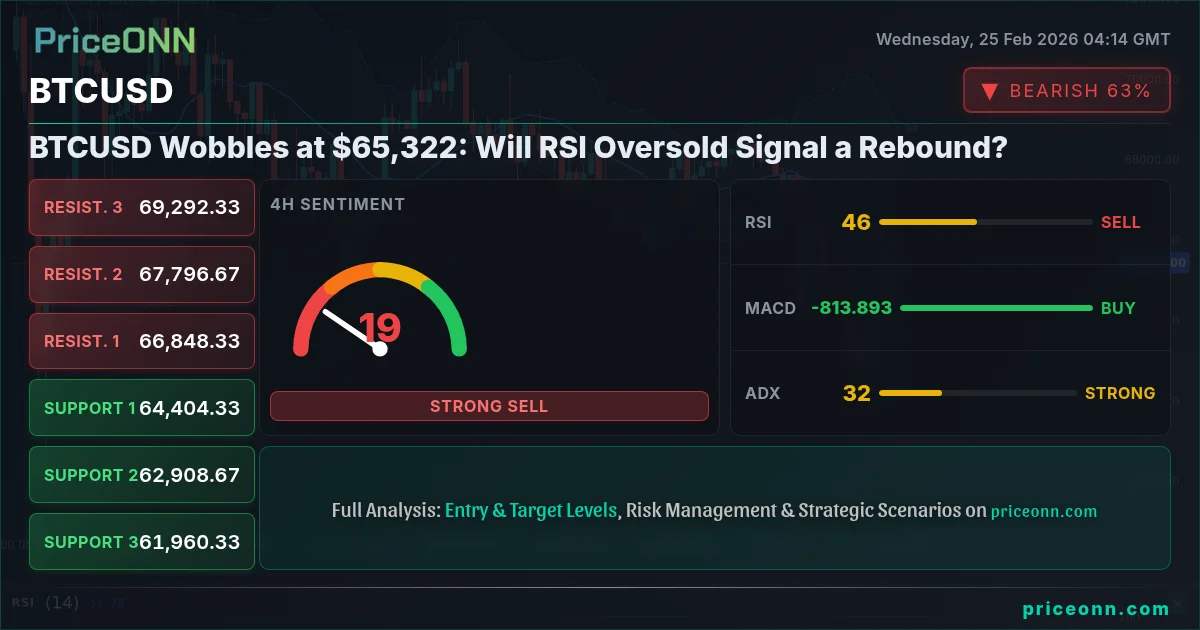
Bitcoin's price is currently trading at $65,322, a level that's proving to be a critical juncture for the cryptocurrency. After a period of sustained bullish momentum, BTCUSD has encountered considerable headwinds, leading to a notable correction. The question now is whether this pullback represents a healthy consolidation before another leg higher, or the start of a deeper bearish trend.
- RSI at 35.7 on the daily chart signals oversold conditions, potentially indicating a near-term bounce.
- Key support level at $62,715.67 must hold to prevent further downside pressure.
- MACD histogram shows positive momentum on the daily timeframe, suggesting a possible trend reversal.
- DXY's recent weakness is providing a mild tailwind for BTCUSD, but this could change quickly.
Having tracked BTCUSD through multiple market cycles, what's particularly interesting right now is the conflicting signals we're seeing across different timeframes. On the hourly chart, BTCUSD shows a neutral trend with an ADX of 31.97, suggesting a lack of strong directional conviction. The RSI on the hourly chart sits at 60.7, indicating that there is room for further upside before the asset becomes overbought.
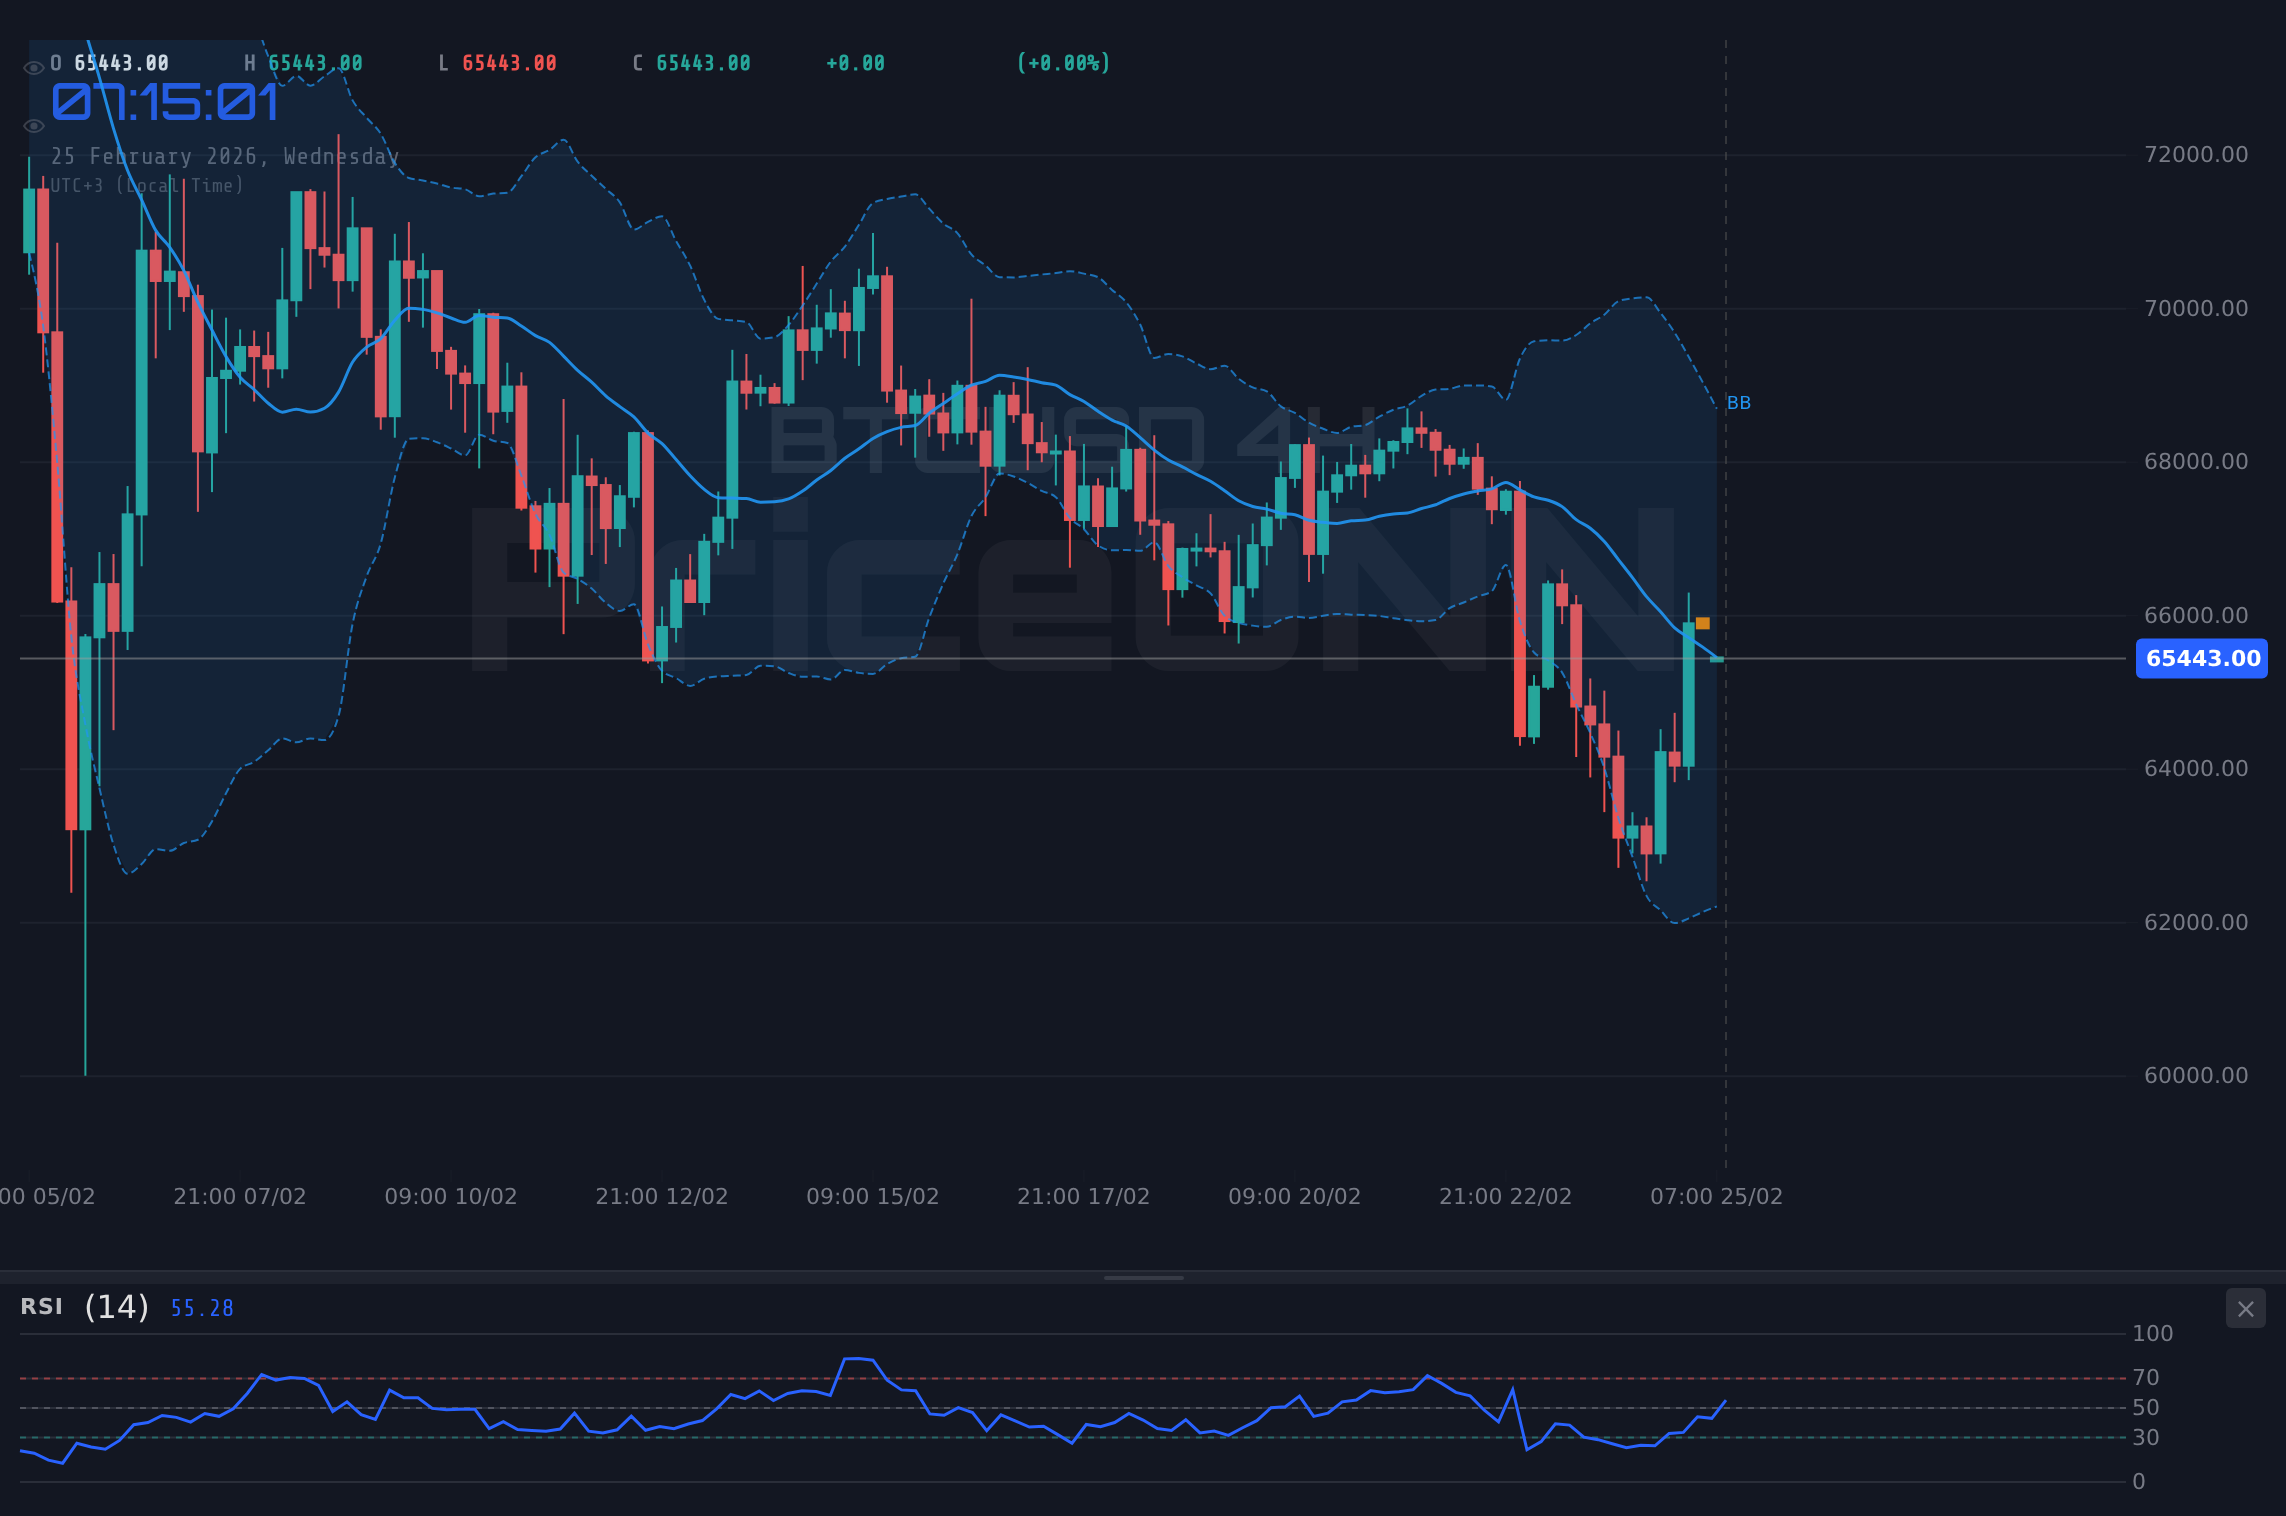
However, zooming out to the 4-hour timeframe reveals a different picture. The 4-hour trend is bearish with an ADX of 33.94, indicating a strong downtrend. The RSI on the 4-hour chart is at 47.86, leaving room for further declines before the asset reaches oversold territory. The MACD histogram is showing negative momentum, further supporting the bearish outlook on this timeframe. It’s critical to acknowledge that the stochastic shows a value of K=50.82 and D=22.42, suggesting a potential bullish crossover, which could signal a short-term relief rally.
The daily chart for BTCUSD presents an even more complex scenario. The daily trend is bearish, evidenced by an ADX reading of 56.75, indicative of a very strong downtrend. The daily RSI is at 35.7, near oversold territory, which historically has been a level where buyers step in. Yet, the stochastic shows a value of K=23.71 and D=33.12, a bearish signal, reinforcing the overall negative sentiment. The MACD histogram is showing positive momentum, which might foreshadow a potential trend reversal, but this needs to be confirmed with other indicators before making any definitive conclusions.
Now, this is where it gets interesting! The interplay between these indicators across different timeframes suggests a market at a critical decision point. The hourly chart offers a glimpse of potential short-term upside, while the 4-hour and daily charts paint a more bearish picture. This divergence highlights the importance of multi-timeframe analysis in understanding the underlying dynamics of BTCUSD.
From a price action perspective, BTCUSD is currently testing a key support level around $62,715.67, as mentioned in the daily support levels. This level has acted as a crucial area of confluence in the past, with multiple tests confirming its significance. A sustained break below this level could open the door for further downside, potentially targeting the next support level at $61,385.33. On the upside, immediate resistance can be found around $65,199.67. A successful breach of this level could pave the way for a retest of the recent highs. Look, this level is absolutely critical - if buyers can't defend it, we could see a swift move lower.
With the DXY currently showing a downward trend, it's providing some respite to BTCUSD. The dollar index sits at 97.46, down 0.12% on the day. Typically, a weaker dollar lends support to Bitcoin, as it becomes relatively cheaper for investors holding other currencies. However, this correlation is not always consistent, and other factors, such as risk sentiment and regulatory news, can override this relationship. The SP500 is up 0.11% at 6893.55, which is indicative of a generally risk-on environment. A falling SP500 could dampen risk appetite and increase safe-haven demand, potentially benefiting BTCUSD.
The weakness in the DXY could be attributed to recent economic data. While the actual value is 91.2, exceeding the forecast of 87.4, this positive data has not translated into sustained dollar strength. This could be due to the market already pricing in the positive data, or concerns about other aspects of the US economy. Investors are keenly awaiting the upcoming economic data releases, which could provide further clues about the direction of the dollar and BTCUSD. The upcoming data will be crucial in determining the next move for both the dollar and BTCUSD.
Considering the conflicting technical signals and the broader market context, a cautious approach is warranted. The bearish trend on the daily and 4-hour charts suggests that the path of least resistance is to the downside. However, the oversold RSI on the daily chart and the positive momentum on the MACD histogram could foreshadow a potential relief rally. Therefore, traders should be prepared for both scenarios and manage their risk accordingly.
Based on the current technical picture, a potential trade plan for BTCUSD could involve waiting for a confirmed break below the $62,715.67 support level before initiating a short position. Alternatively, a long position could be considered on a sustained break above the $65,199.67 resistance level. In both cases, it's crucial to implement appropriate stop-loss orders to manage risk. This is exactly where you need to pay attention...the market always gives a second chance, so be patient and wait for your setup.
A sustained break above $65,199.67 could trigger a rally towards $66,353.33, with potential for further upside towards $67,683.67 if momentum continues.
A break below $62,715.67 could lead to a decline towards $61,385.33, with potential for further downside towards $60,231.67 if selling pressure intensifies.
Frequently Asked Questions: BTCUSD Analysis
Is BTCUSD a good buy right now?
At $65,322, BTCUSD is at a critical level. A confirmed break above $65,199.67 could signal a buying opportunity, but caution is advised given the bearish trend on the 4-hour and daily charts.
What is the BTCUSD price forecast for this week?
The BTCUSD price forecast for this week is mixed. A sustained break above $65,199.67 could lead to $66,353.33, while a break below $62,715.67 could lead to $61,385.33. The probability of each scenario depends on upcoming data and market sentiment.
What are the key support and resistance levels for BTCUSD?
Key support levels for BTCUSD are $62,715.67 and $61,385.33. Key resistance levels are $65,199.67 and $66,353.33. These levels are based on recent price action and act as potential areas of buying or selling pressure.
Why is BTCUSD moving today?
BTCUSD is moving today due to a combination of technical factors and broader market sentiment. The recent pullback is testing key support levels, while the DXY's weakness is providing some support. The upcoming economic data releases could also be a factor.
Technical Outlook Summary
| Indicator | Value | Signal |
|---|---|---|
| RSI (14) | 35.7 | Neutral |
| MACD Histogram | Positive | Bullish |
| Stochastic | 23.71/33.12 | Bearish |
| ADX | 56.75 | Strong Downtrend |
| Bollinger | Middle Band | Watch |
Key Levels
Support Levels
Resistance Levels
Track markets in real-time
AI-powered analysis, technical indicators and real-time price data.
Join Our Telegram Channel
Breaking market news, AI analysis and trading signals instantly.
Join Channel