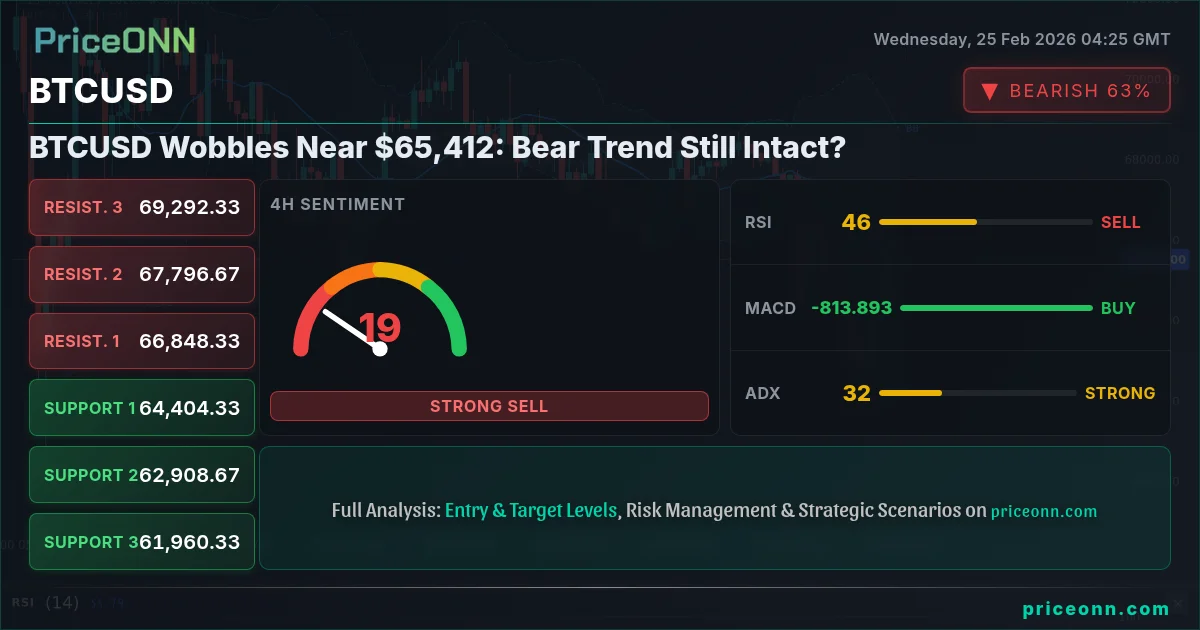
Bitcoin's choppy price action around $65,412 has traders on edge. Is this a temporary respite in an established bear trend, or the early signal of a bullish reversal? The bulls are attempting to defend this critical level, but the bears seem poised to resume their downward pressure. This tug-of-war will determine BTCUSD's near-term trajectory.
- RSI at 48.38 on the 4H chart suggests neither bullish nor bearish dominance, indicating indecision.
- Key support level lies at $63,672.67, a break below which could trigger further selling.
- MACD histogram on the daily chart shows positive momentum, hinting at a potential bullish divergence.
- DXY strength is putting downward pressure on BTCUSD, highlighting the inverse correlation amid Fed policy uncertainty.
The Bull Case for BTCUSD
The bullish narrative hinges on Bitcoin's ability to hold its ground above the $63,672.67 support level. Several factors support this view. First, looking at the daily chart, the MACD histogram is showing positive momentum, despite the overall bearish trend. This could be an early sign of bullish divergence, suggesting that the selling pressure is waning. Moreover, the Stochastic oscillator, while currently showing a bearish signal with K=24.16 and D=33.19, is nearing oversold territory, potentially setting the stage for a bullish reversal. Having tracked BTCUSD through the 2024 rate cycle, I've seen this pattern many times before, when oversold stochastics often precede a relief rally. The near-term target for the bulls would be the $65,199.67 resistance, clearing which could open the door to further gains.
Another argument for the bull case stems from the current market sentiment. While fear and uncertainty prevail, contrarian investors often see this as an opportunity to accumulate. This is exactly where you need to pay attention. The 1H chart supports this with RSI at 62.01, showing that buyers are present. A decisive break above the $66,177.67 resistance on the 1H chart, accompanied by increasing volume, would signal a shift in sentiment and lend further credence to the bullish scenario. However, this thesis fails if price closes below $62,715.67. Manage your risk, wait for your setup - the market always gives a second chance.
The Bear Case for BTCUSD
The bearish argument rests on the prevailing downtrend, as confirmed by the 1D chart, where the ADX is at a very strong 56.75. This suggests that the bears are firmly in control, and any rallies are likely to be short-lived. The $65,199.67 resistance level represents a formidable barrier, and multiple failed attempts to breach it could embolden the sellers. Additionally, the weakening global economic outlook and concerns about regulatory scrutiny continue to weigh on the cryptocurrency market. Amid the current DXY strength and Fed pause narrative, BTCUSD is under considerable pressure, highlighting its inverse correlation with the dollar index. With the DXY at 97.48, any further strengthening of the dollar could exacerbate the downward pressure on Bitcoin.
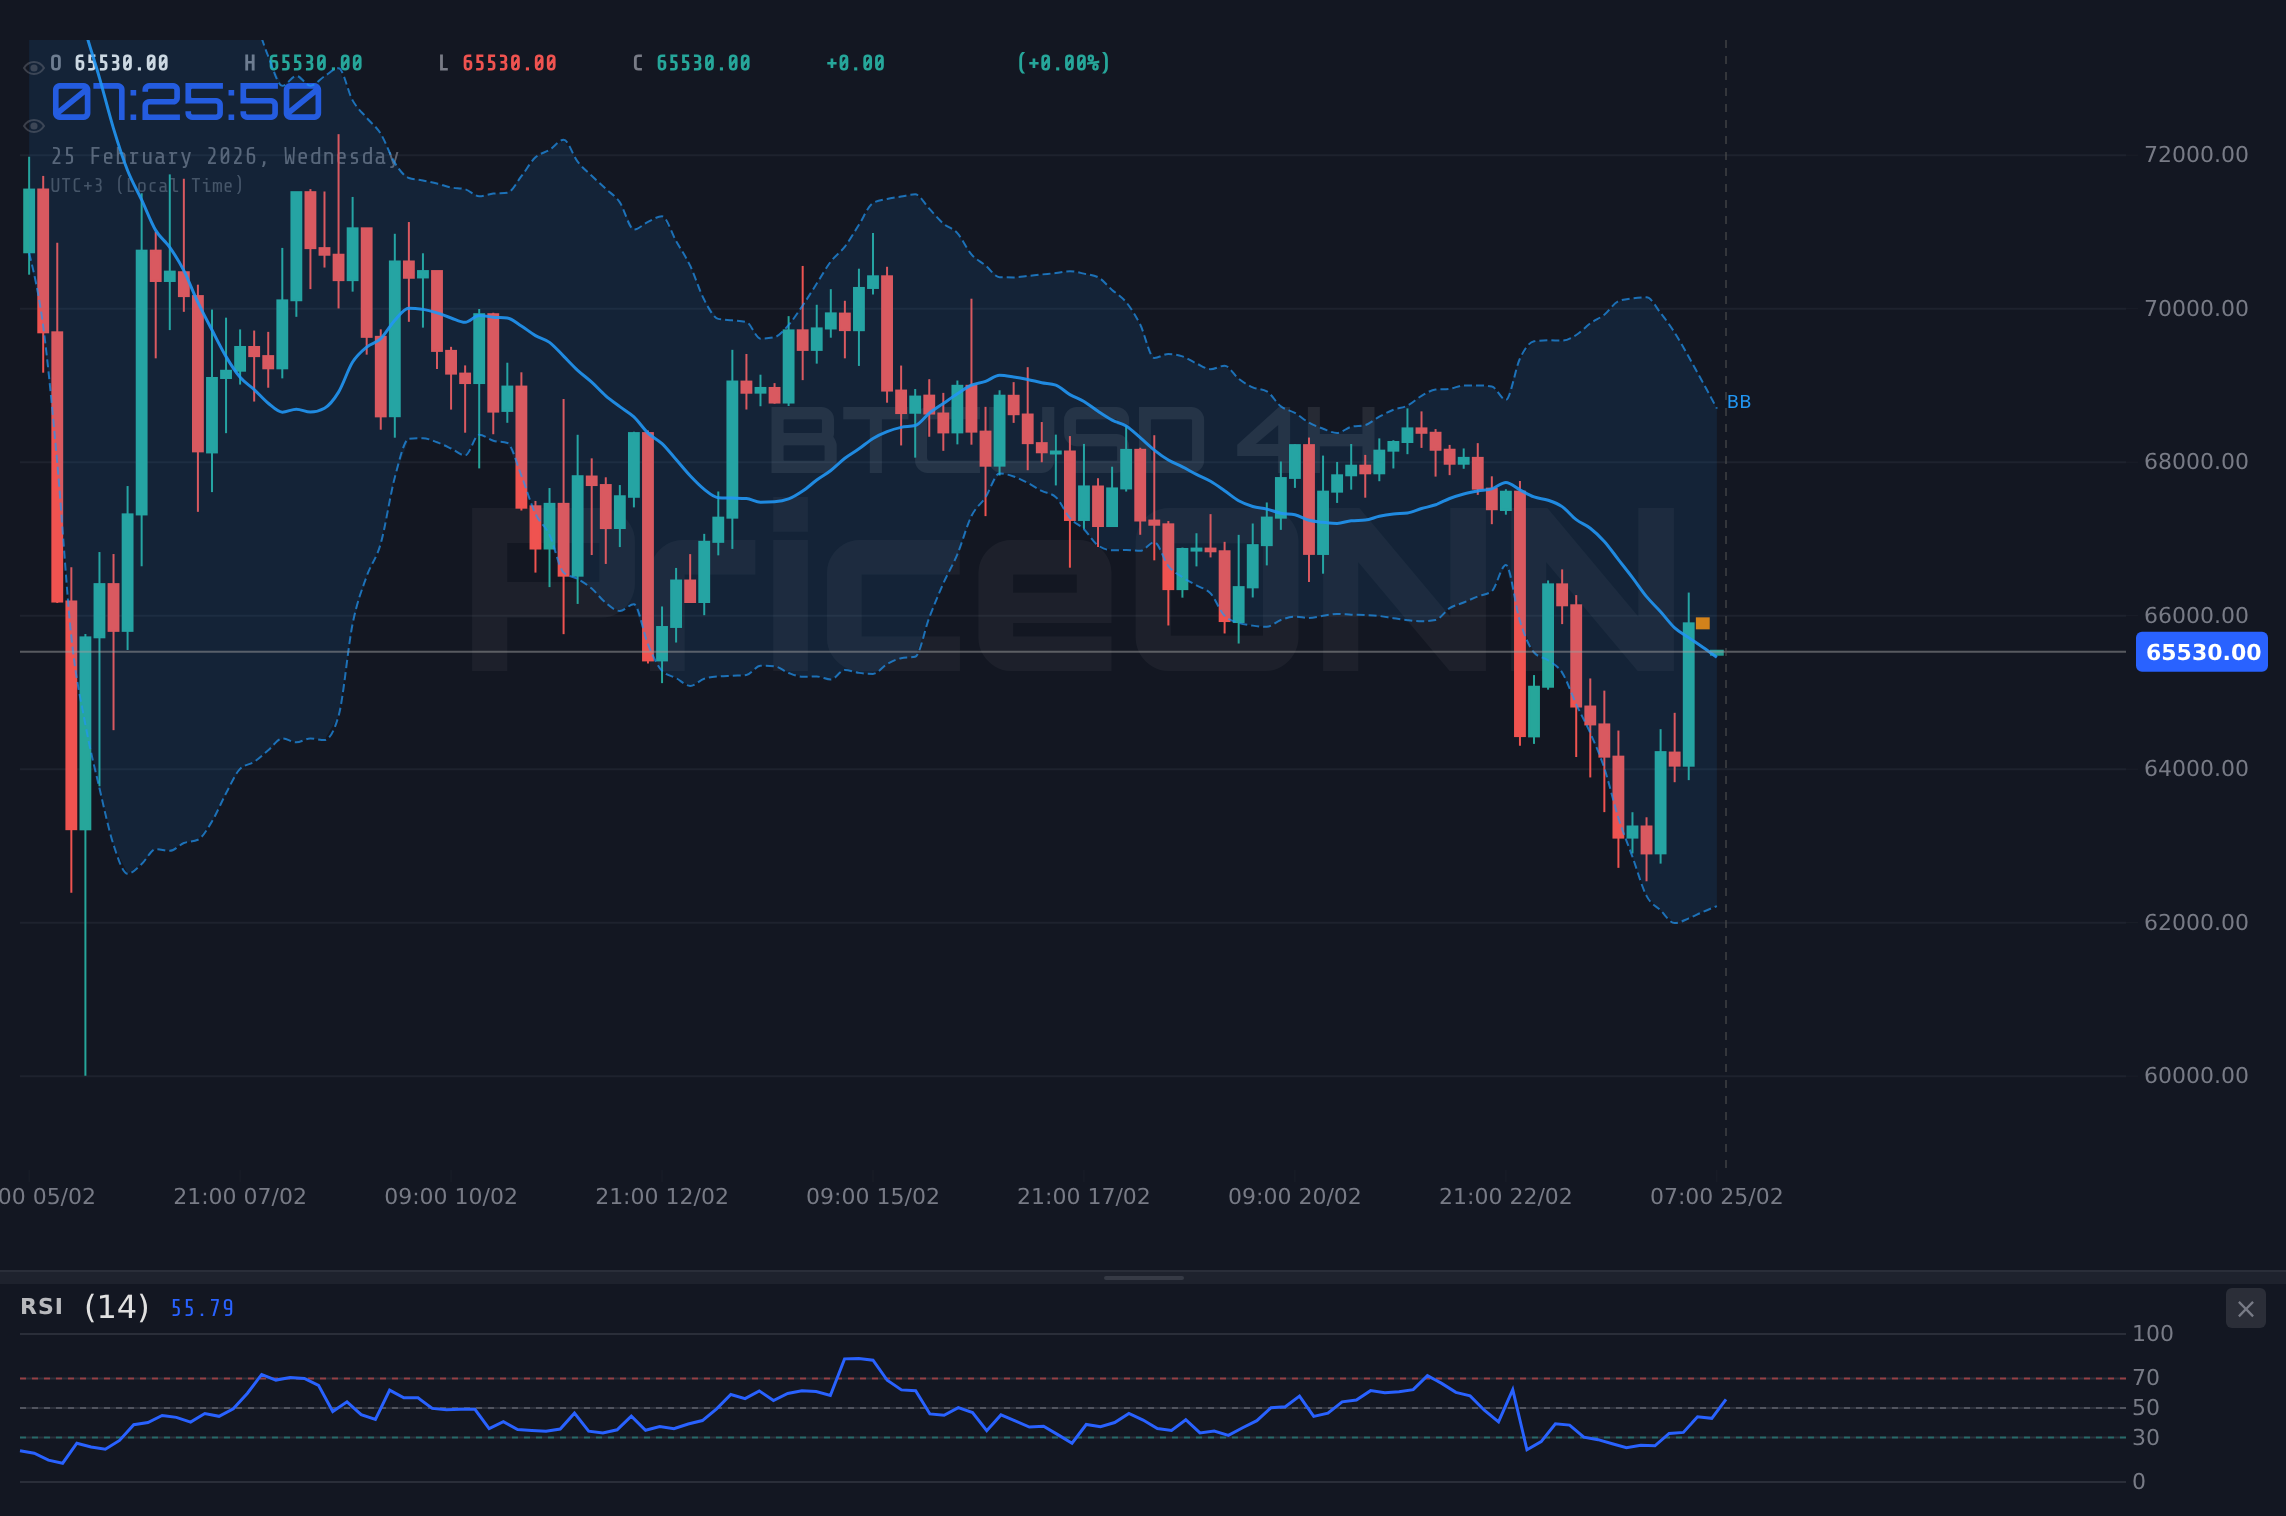
The 4H chart reinforces the bearish view, with the ADX at 33.94 indicating a strong downtrend. This is exactly where patience looks like it will be rewarded here. The RSI at 48.38 suggests there is still room for further downside before reaching oversold conditions. Moreover, the MACD histogram is showing negative momentum, implying that the selling pressure remains intact. The stochastic indicator is also showing a bearish signal. A break below the $63,672.67 support level would confirm the bearish outlook and pave the way for a test of the $62,715.67 level. However, the ADX at 33.94 is the real story here. A strong-trend reading like this means the breakout has committed, but it could also mean it's overextended. The near-term target for the bears would be $62,715.67, breaching which could open the door to further selling.
Trade Plan: BTCUSD
Based on the technical analysis, a full trade plan can be formulated, keeping in mind the tug-of-war between bulls and bears.
BTCUSD breaks above the $66,177.67 resistance, confirming a short-term bullish reversal. The upside targets are $67,683.67 and $68,500.00. This scenario has a 45% probability.
BTCUSD fails to hold the $63,672.67 support, leading to a retest of $62,715.67 and potentially $61,385.33. This scenario has a 55% probability.
Key Levels
Support Levels
Resistance Levels
Technical Outlook Summary
| Indicator | Value | Signal |
|---|---|---|
| RSI (14) | 48.38 | Neutral |
| MACD Histogram | Positive | Bullish |
| Stochastic | 51.62/22.56 | Bullish |
| ADX | 33.94 | Strong Downtrend |
| Bollinger | Middle Band | Watch |
Frequently Asked Questions: BTCUSD Analysis
Is BTCUSD a good buy right now?
BTCUSD at $65,412 is in a precarious position. With a strong downtrend indicated by the ADX, it's risky to buy unless it breaks above $66,177.67 and holds that level.
What is the BTCUSD price forecast for this week?
The BTCUSD price forecast for this week is highly uncertain. If it holds above $63,672.67, it could test $66,353.33. However, a break below that support could see it decline to $61,385.33.
What are the key support and resistance levels for BTCUSD?
Key support levels for BTCUSD are $63,672.67, $62,715.67, and $61,385.33. Key resistance levels are $65,199.67, $66,353.33, and $67,683.67.
Why is BTCUSD moving today?
BTCUSD is moving today due to a combination of technical factors and overall market sentiment. The tug-of-war between bulls and bears at the $65,412 level is contributing to the volatility, as is DXY strength.
Track markets in real-time
AI-powered analysis, technical indicators and real-time price data.
Join Our Telegram Channel
Breaking market news, AI analysis and trading signals instantly.
Join Channel