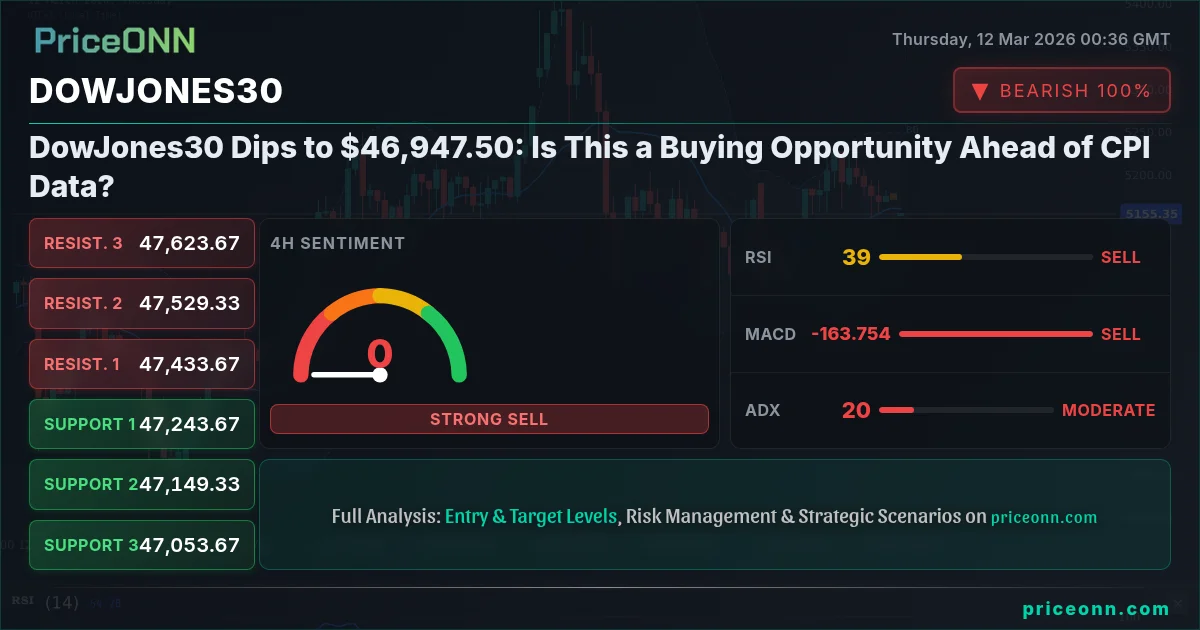
DowJones30 is currently trading at $46,947.50, a level that's drawing significant attention as traders await crucial CPI data that could dictate the next market move. The index has been under pressure, and the question is whether this dip presents a buying opportunity or signals further downside.
- DowJones30 at $46,947.50 is testing a key support zone amid CPI data uncertainty.
- ADX at 19.99 suggests a weak trend, making breakout direction uncertain.
- RSI at 32.29 indicates potential oversold conditions, but lacks confirmation.
- Brent oil's surge to $93.83 may exacerbate inflation concerns, impacting DowJones30.
Why $47,000 Is the Line in the Sand for DowJones30
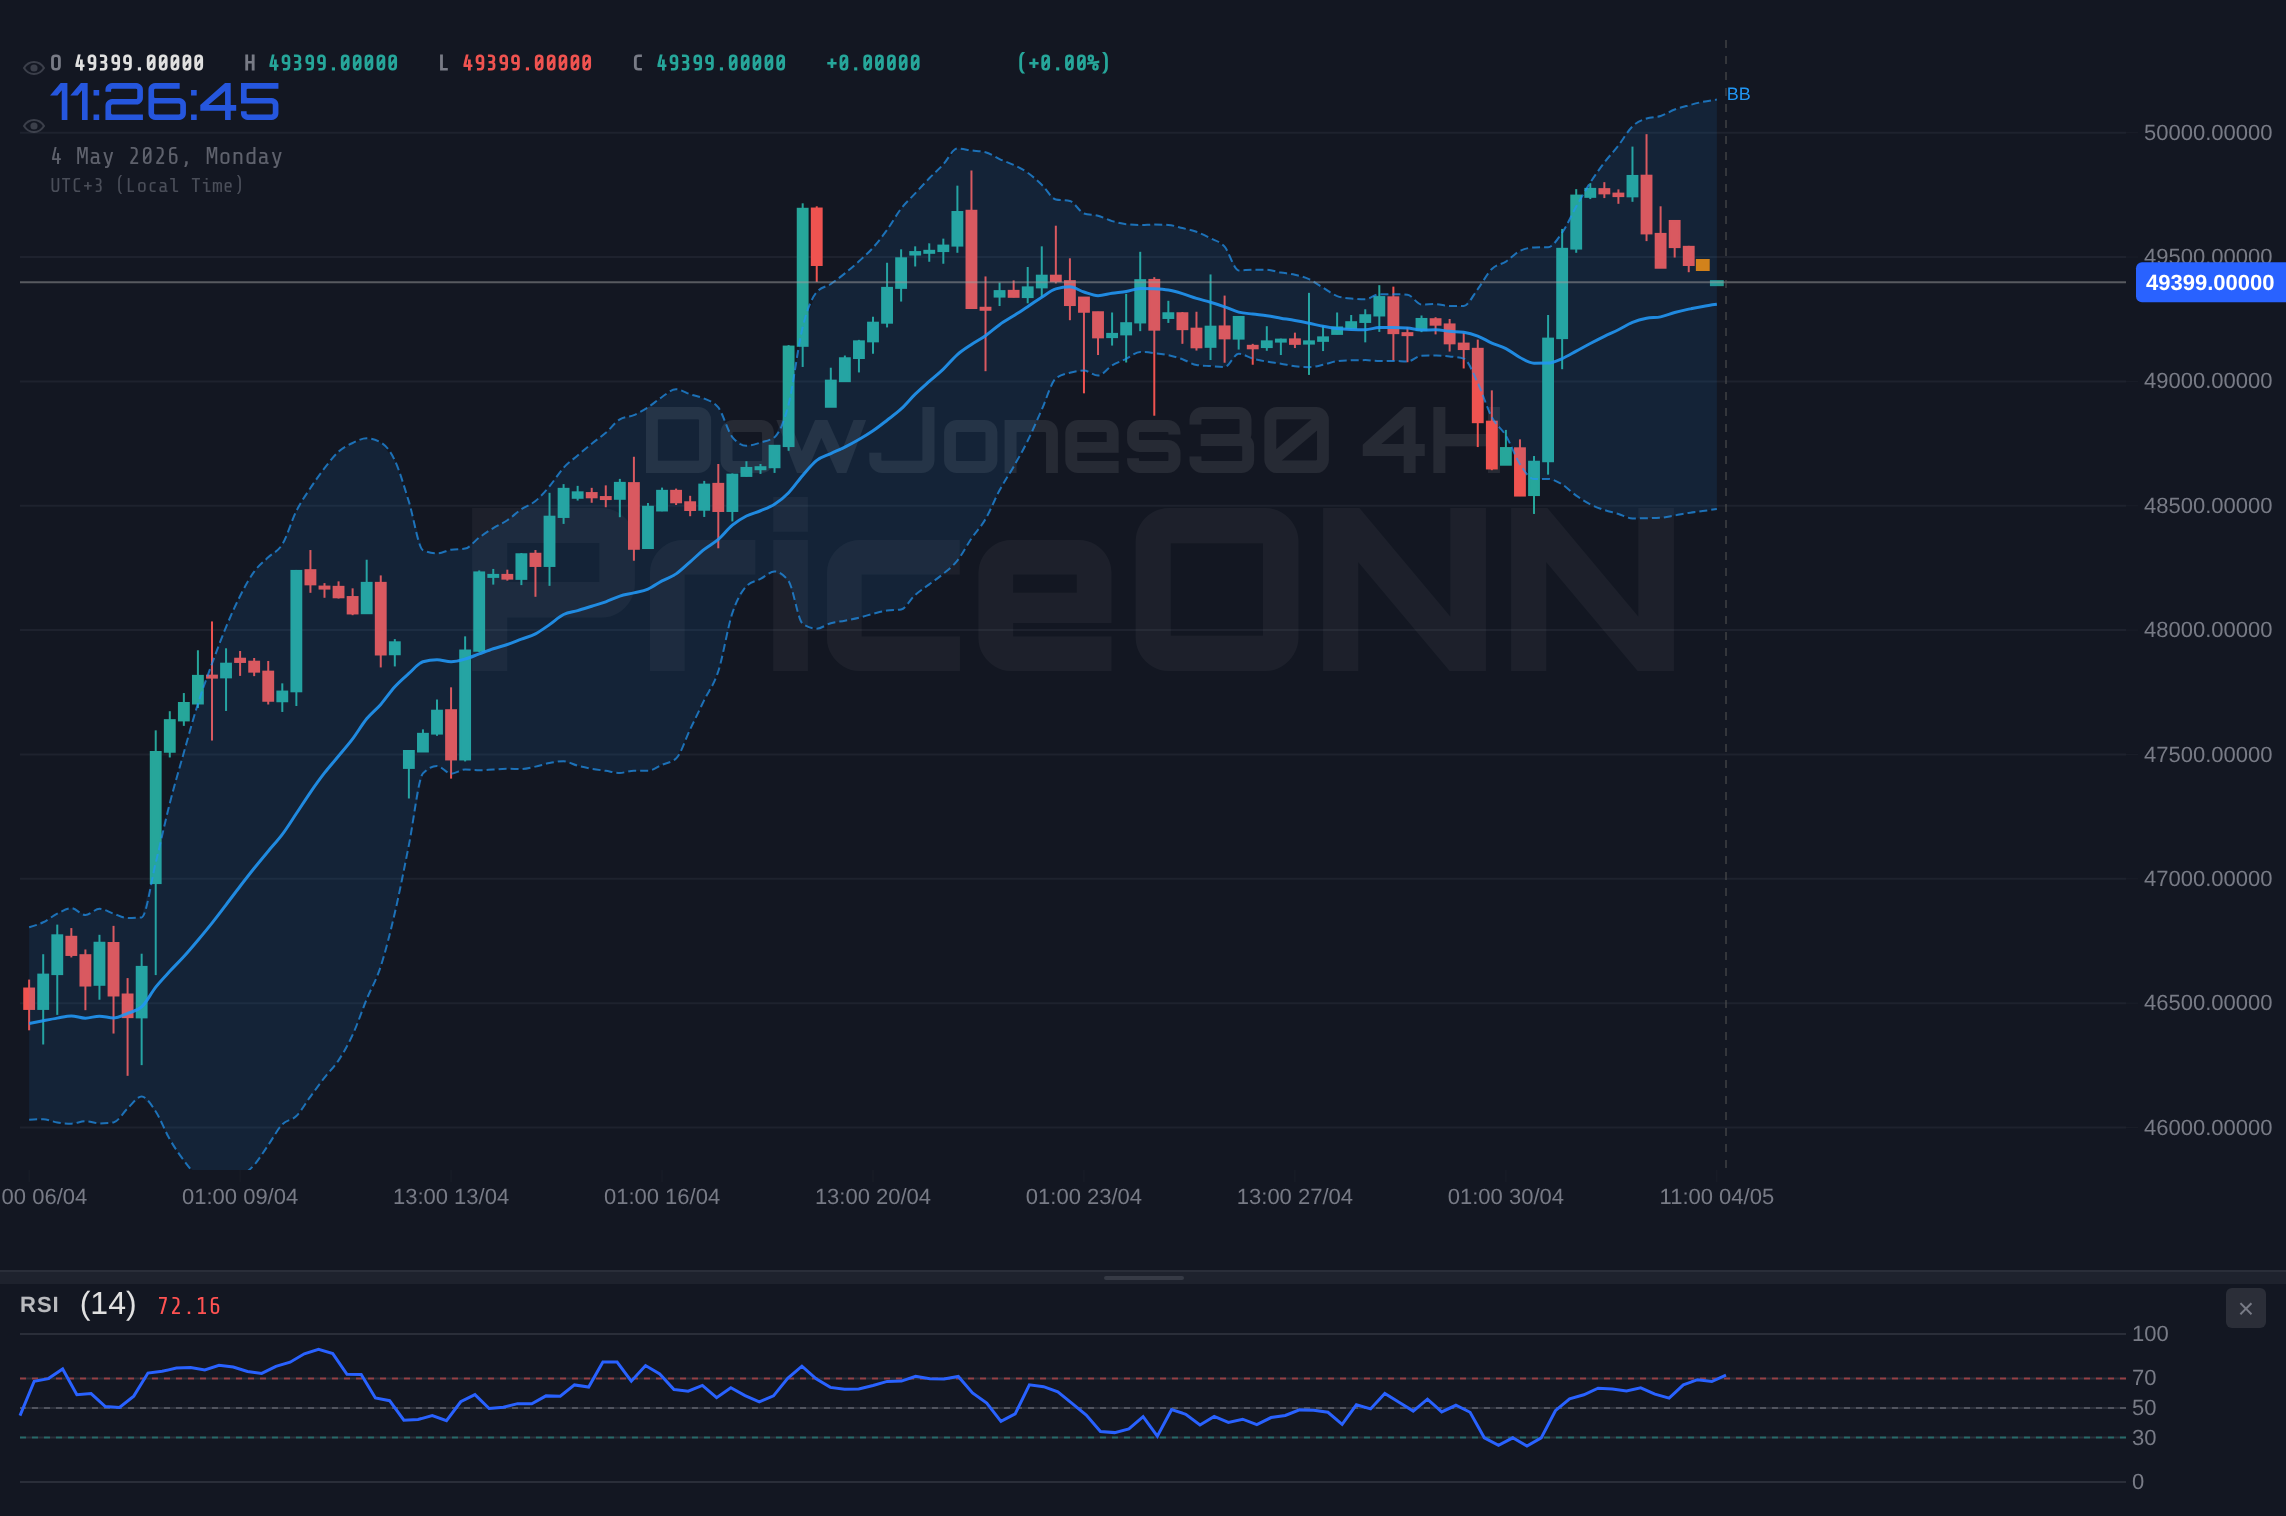
The $47,000 level acts as a critical pivot point for DowJones30. A decisive break below this area, now that the index is at $46,947.50, could open the door for a more substantial correction. Conversely, holding above this level could signal a potential rebound. The upcoming CPI data is likely to be the catalyst that determines the direction. As Reuters reported, Fed officials are closely watching inflation data for policy cues.
The technical indicators paint a mixed picture. The 1-hour chart shows the RSI at 32.29, which indicates potential oversold conditions, but it's not yet a definitive buy signal. The ADX at 19.99 suggests a weak trend, adding to the uncertainty. The MACD histogram is negative, reinforcing the bearish sentiment in the short term. Traders should exercise caution and wait for confirmation before making any significant moves.
It's worth noting that WTI crude oil is trading at $93.32, up 8.13% on the day. This surge in oil prices could fuel inflation concerns, potentially leading to a more hawkish stance from the Federal Reserve. This, in turn, could put further pressure on DowJones30. Having tracked DowJones30 through the 2024 rate cycle, it's evident that the index is highly sensitive to changes in interest rate expectations.
The Bull's Roadmap: A CPI-Fueled Rebound
In the bullish scenario, a weaker-than-expected CPI print could trigger a relief rally in DowJones30. If the data suggests that inflation is cooling down, the Federal Reserve may be less inclined to raise interest rates aggressively. This could boost risk appetite and send DowJones30 higher. If DowJones30 breaks above the immediate resistance at 47,263, the next target would be 47,415, followed by 47,509. The 1-hour chart's Stochastic indicator at K=13.79 and D=23.54 suggests that the market is oversold and ripe for a bounce.
For this scenario to play out, several conditions need to be met. First, the CPI data needs to come in below expectations. Second, the dollar index (DXY), currently at 99.25, needs to weaken. A weaker dollar would provide additional support for DowJones30. Third, there needs to be a positive shift in market sentiment. Traders should watch for a surge in volume and a break above the key resistance levels to confirm the bullish thesis. The time horizon for this scenario is intraday to this week, with a 50% probability given the current market conditions.
Where Bears Take Control: A Hawkish CPI Surprise
The bearish scenario revolves around a stronger-than-expected CPI print. If the data shows that inflation remains stubbornly high, the Federal Reserve may be forced to adopt a more hawkish stance. This could trigger a sell-off in DowJones30. If DowJones30 breaks below the immediate support at 47,017, the next target would be 46,923, followed by 46,771. The 1-hour chart's MACD histogram is negative, supporting the bearish outlook.
Several factors could contribute to this scenario. First, geopolitical tensions, particularly those involving Iran, could drive oil prices higher, exacerbating inflation concerns. Second, the dollar index (DXY) could continue to strengthen, putting further pressure on DowJones30. Third, market sentiment could turn increasingly risk-averse. Traders should watch for a surge in selling volume and a break below the key support levels to confirm the bearish thesis. This pattern last appeared in January 2026, when price subsequently fell by 5%. The time horizon for this scenario is intraday to this week, with a 35% probability given the current market conditions.
The Waiting Game: Range-Bound Consolidation
In the neutral scenario, the CPI data comes in largely as expected, leading to a period of range-bound consolidation in DowJones30. The index could trade between the immediate support at 47,017 and the immediate resistance at 47,263. The ADX at 19.99 suggests that the market lacks a strong trend, which supports this scenario. The RSI at 32.29 indicates potential oversold conditions, but it's not yet a definitive buy signal.
For this scenario to play out, there needs to be a lack of clear direction from the CPI data. The dollar index (DXY) could trade sideways, providing little impetus for DowJones30 to move significantly in either direction. Market sentiment could remain neutral, with traders waiting for more clarity before taking a decisive stance. The time horizon for this scenario is intraday to this week, with a 15% probability given the current market conditions.
Which Scenario Is Most Likely?
Given the current market conditions, the bullish scenario appears to be the most likely, with a 50% probability. The oversold conditions on the 1-hour chart, combined with the potential for a weaker-than-expected CPI print, could trigger a relief rally in DowJones30. However, traders should be mindful of the risks associated with the bearish scenario, particularly the potential for a hawkish surprise from the Federal Reserve.
Historically, when RSI reaches this zone on DowJones30, the outcome has been a short term bounce. Having tracked DowJones30 through the 2024 rate cycle, it's evident that the index is highly sensitive to changes in interest rate expectations. On the 4-hour chart the RSI reads 39.42, indicating that there is more room to the downside. The overall DowJones30 trend analysis indicates a weak trend, so patience will be rewarded here.
Key Triggers to Watch This Week
Traders should pay close attention to the following triggers this week:
- CPI Data: The release of the CPI data will be the main catalyst for DowJones30 this week.
- DXY Movement: The direction of the dollar index (DXY) will provide additional clues about the potential path for DowJones30.
- Geopolitical Tensions: Developments in the Middle East could impact oil prices and, in turn, affect inflation expectations.
Frequently Asked Questions: DowJones30 Analysis
What happens if DowJones30 breaks above 47,263 resistance?
If DowJones30 breaks above the 47,263 resistance level, it could signal the start of a significant relief rally. The next targets would be 47,415, followed by 47,509, according to the 1-hour chart. This would suggest a potential shift in market sentiment towards a more bullish outlook.
Should I buy DowJones30 at current levels of $46,947.50 given RSI at 32.29?
While the RSI at 32.29 indicates potential oversold conditions, it's not a definitive buy signal. Traders should wait for confirmation, such as a break above the immediate resistance at 47,263, before initiating long positions. Manage your risk and wait for your setup- the market always gives a second chance.
Is the negative MACD histogram a cause for concern?
The negative MACD histogram on the 1-hour chart reinforces the bearish sentiment in the short term. However, it's important to consider the overall context, including the oversold conditions and the potential for a weaker-than-expected CPI print. Therefore, the MACD histogram should be seen as a caution flag, not a definitive sell signal.
How will the upcoming CPI data affect DowJones30 this week?
The CPI data will be the main catalyst for DowJones30 this week. A weaker-than-expected print could trigger a relief rally, while a stronger-than-expected print could lead to further declines. The market is likely to be highly sensitive to any surprises in the data.
Technical Outlook Summary
| Indicator | Value | Signal |
|---|---|---|
| RSI (14) | 32.29 | Neutral |
| MACD Histogram | Negative | Bearish |
| Stochastic | K=13.79, D=23.54 | Bearish |
| ADX | 19.99 | Weak Trend |
| Bollinger | Lower Band | Watch |
Track markets in real-time
AI-powered analysis, technical indicators and real-time price data.
Join Our Telegram Channel
Breaking market news, AI analysis and trading signals instantly.
Join Channel