The cryptocurrency market is currently under pressure, with Bitcoin experiencing a significant correction and Ethereum following suit. The question on every trader's mind: Is this a temporary pullback or the start of a more prolonged bearish phase? The answer may lie in a combination of macroeconomic factors and technical indicators, particularly the Relative Strength Index (RSI), which is nearing oversold territory for ETHUSD.
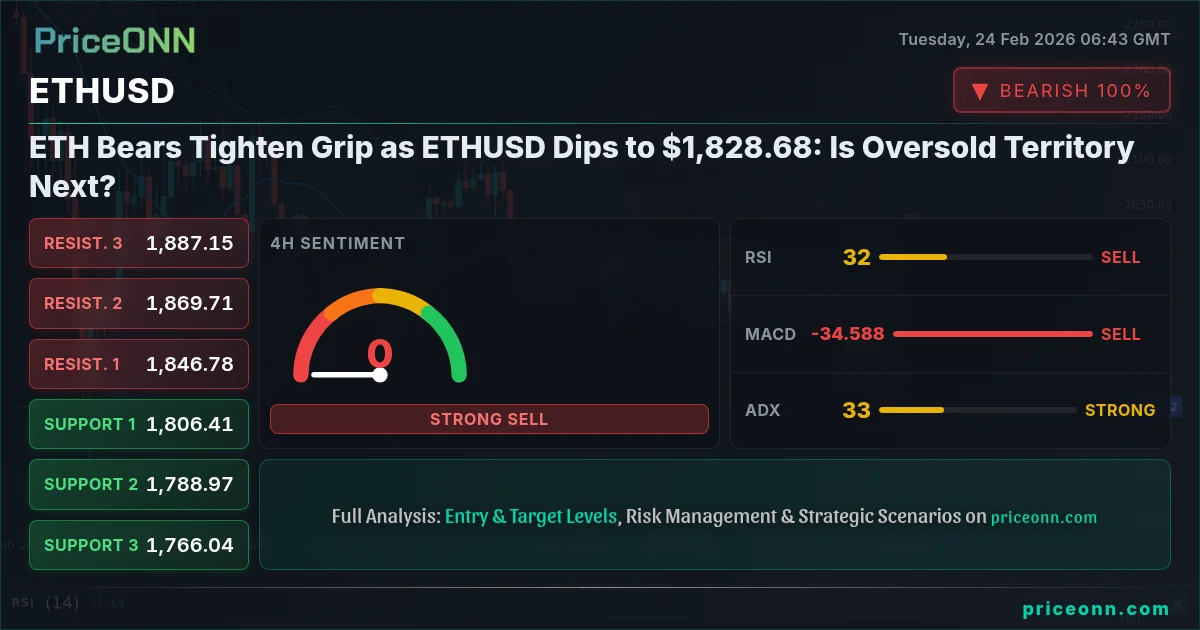
- ETHUSD currently trades at $1,828.68, reflecting a 1.76% daily decline.
- The 1-hour RSI at 29.57 suggests ETHUSD is approaching oversold conditions, potentially signaling a reversal.
- Key support lies at $1,811.25, a break below which could accelerate the downtrend.
- DXY strength is negatively impacting ETHUSD, highlighting the inverse correlation between the two assets.
Having tracked ETHUSD through multiple market cycles, I've learned that market corrections can create opportunities for patient investors. The current dip in ETHUSD presents a compelling case for examining the underlying factors driving the price action and identifying potential entry points for a strategic long position.
Macroeconomic Winds: DXY Strength Weighs on ETHUSD
One of the primary drivers impacting ETHUSD is the strength of the U.S. dollar. The DXY (Dollar Index) currently trades at 97.51, reflecting a 0.1% daily increase. A rising DXY typically puts downward pressure on assets like ETHUSD, which are priced in dollars. As the dollar strengthens, it becomes relatively more expensive to purchase Ethereum, thus reducing demand. The inverse correlation between DXY and ETHUSD is a key factor to consider in the current market landscape. According to Reuters, Fed officials are closely monitoring inflation data, which could influence future monetary policy decisions. Any hawkish signals from the Fed could further strengthen the dollar and exacerbate the downside pressure on ETHUSD.
Technical Breakdown: RSI Nears Oversold Territory
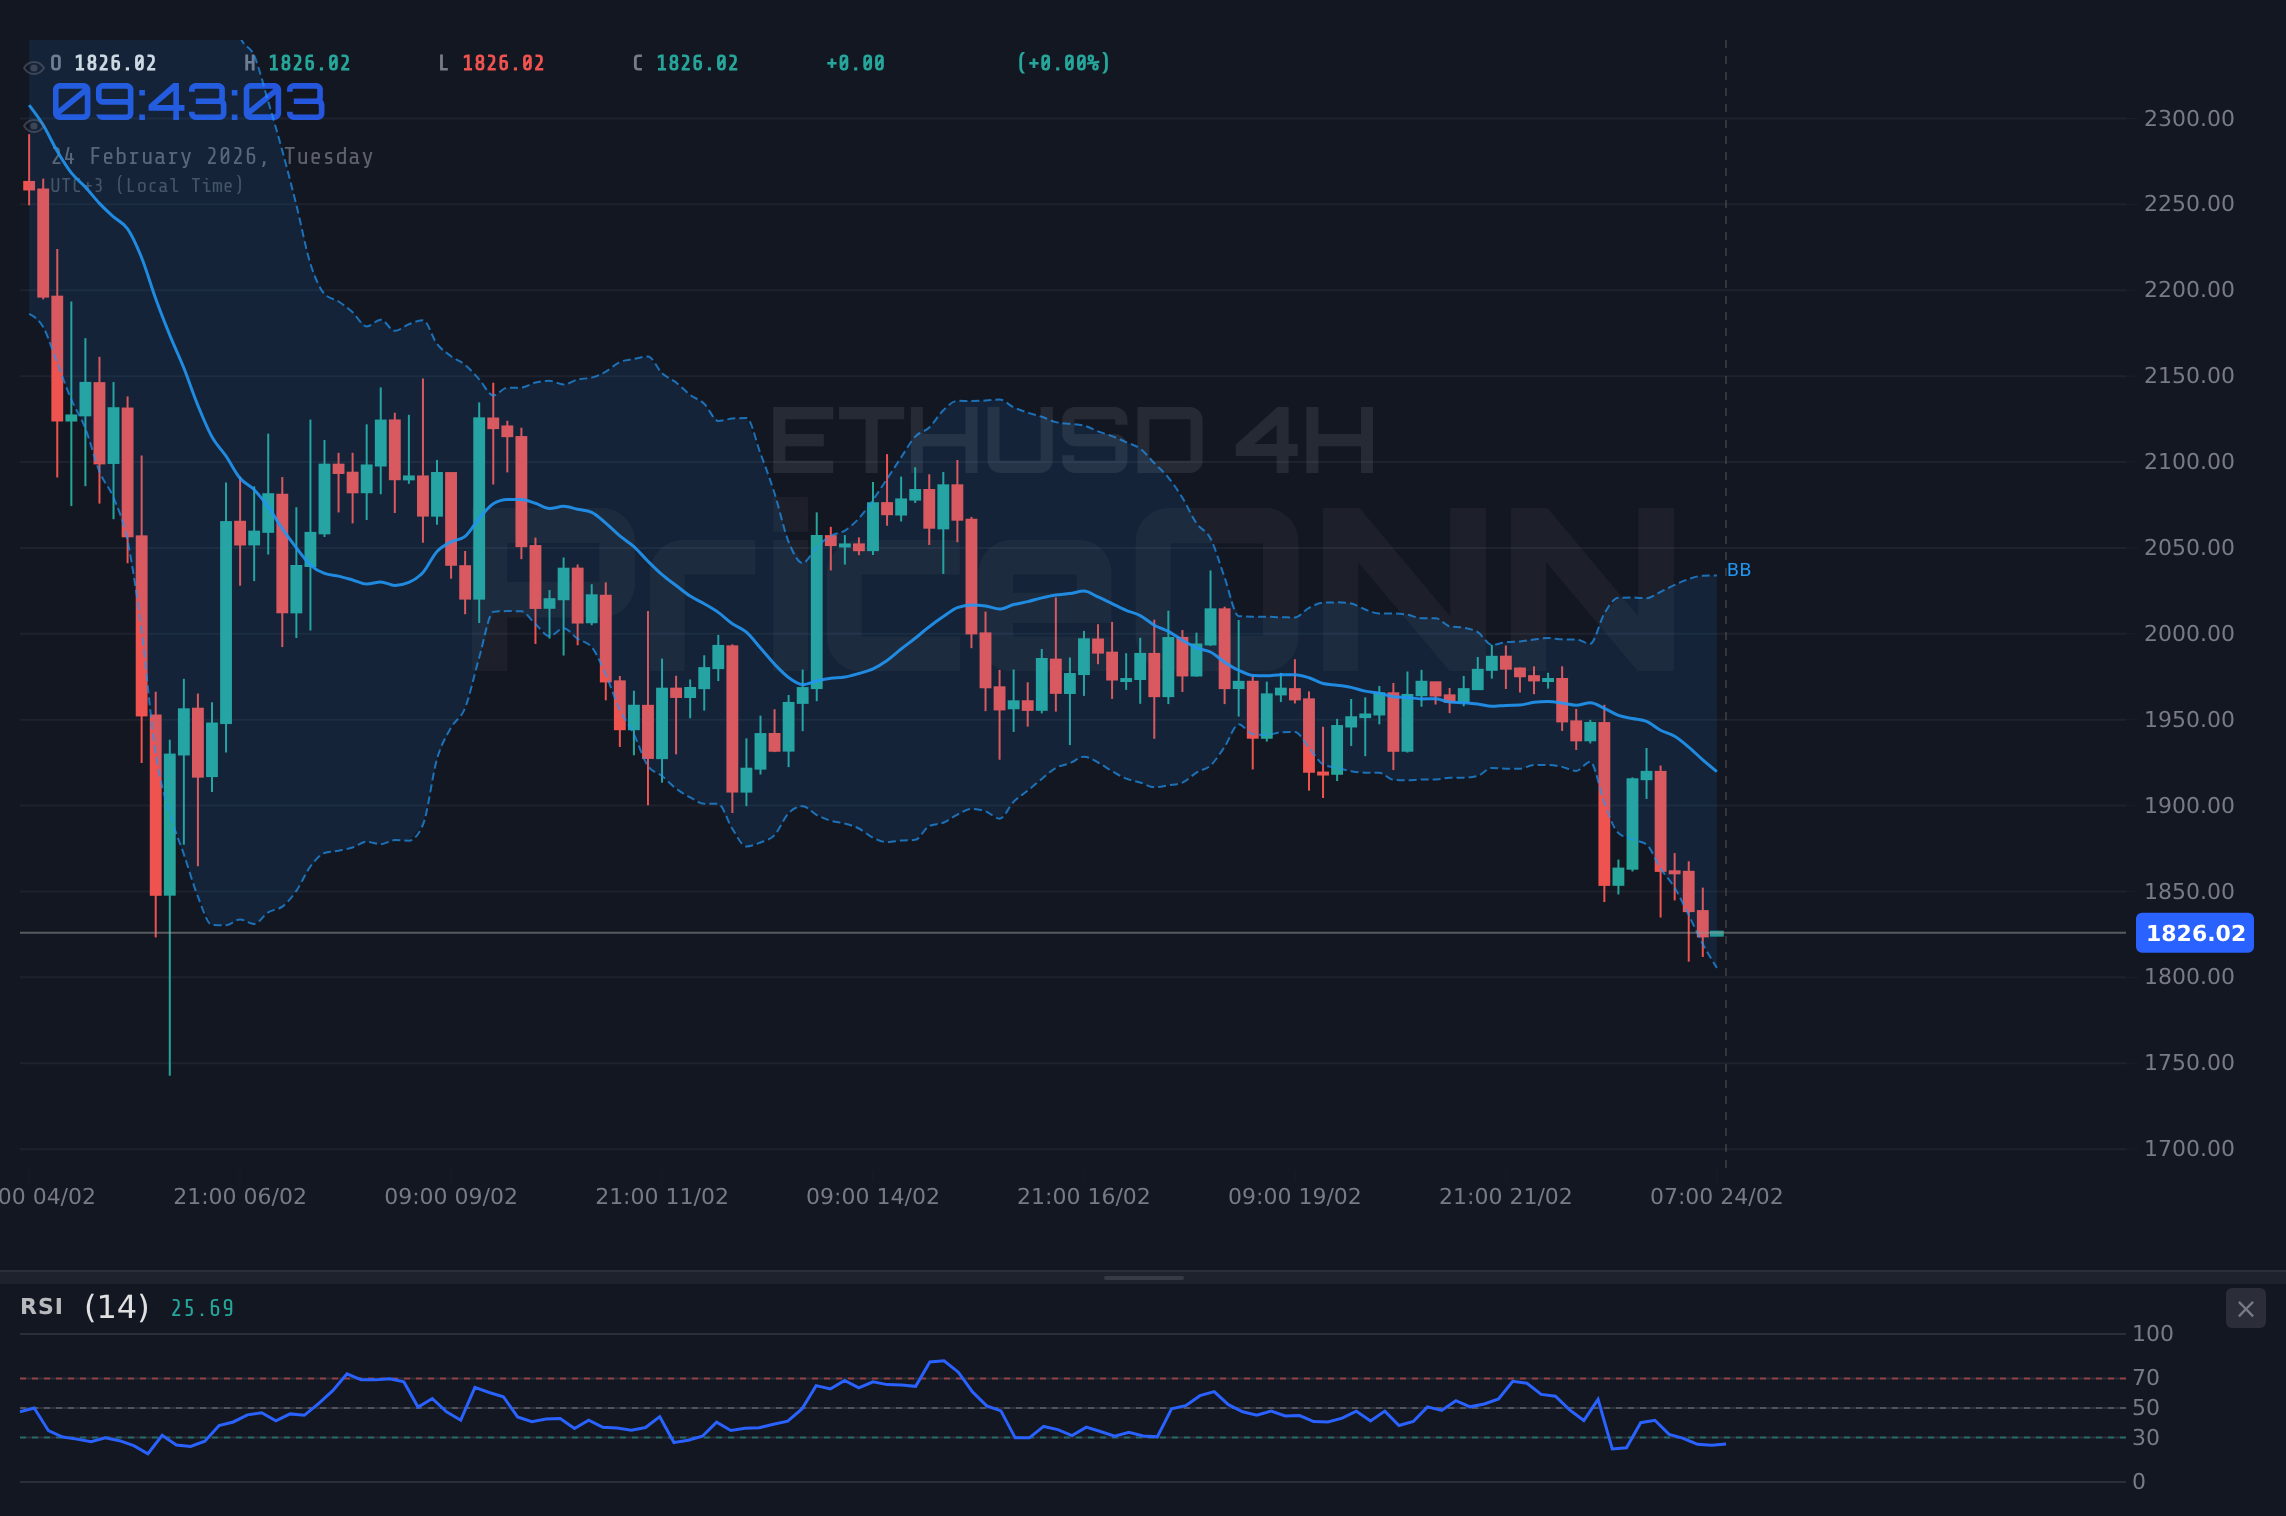
From a technical perspective, ETHUSD is exhibiting several bearish signals. The 1-hour chart reveals a neutral trend with a 50% strength rating. However, the RSI at 29.57 suggests that the asset is nearing oversold territory. Historically, when the RSI reaches this level on ETHUSD, it often precedes a short-term bounce. However, it's important to note that oversold conditions can persist for extended periods during strong downtrends. The MACD histogram shows negative momentum, further confirming the bearish sentiment. The price is currently trading below the middle band of the Bollinger Bands, indicating a potential continuation of the downtrend. The Stochastic oscillator also signals a bearish outlook, with %K at 33.89 and %D at 38.61, where %K
Zooming out to the 4-hour timeframe, the trend remains neutral with a 50% strength rating. The RSI is at 32.18, also nearing oversold conditions. The MACD histogram shows negative momentum, mirroring the 1-hour chart. The Stochastic oscillator further confirms the bearish bias, with %K at 16.96 and %D at 28.74, where %K
Key Levels to Watch: Support at $1,811.25
Identifying key support and resistance levels is crucial for navigating the current market conditions. On the daily chart, immediate support lies at $1,811.25. A break below this level could trigger a further decline towards the next support zone at $1,761.09. On the upside, initial resistance is located at $1,935.13. Clearing this resistance would require a significant shift in market sentiment. For scalpers, the 1-hour chart offers intraday support and resistance levels to monitor. Support levels are at $1,816.40, $1,804.25 and $1,796.60. Intraday resistance levels are $1,836.20, $1,843.85 and $1,856.00.
Key Levels
Support Levels
Resistance Levels
Economic Calendar: Watching for Catalysts
The economic calendar is relatively light this week, but several key data releases could impact ETHUSD. Investors are awaiting the release of durable goods orders data, which could provide insights into the strength of the U.S. economy. Stronger-than-expected data could further boost the dollar and add to the downside pressure on ETHUSD. The minutes from the latest FOMC meeting will also be closely scrutinized for clues about the Fed's future monetary policy intentions. Any hawkish signals from the Fed could trigger a further sell-off in risk assets, including Ethereum.
Traders should exercise caution ahead of the FOMC minutes release, as unexpected hawkish comments could trigger significant volatility in ETHUSD.
Trade Plan: Capitalizing on Oversold Conditions (30% Probability)
Given the current technical and fundamental landscape, a strategic trade plan is essential for capitalizing on potential opportunities. The RSI nearing oversold territory suggests a potential for a short-term bounce, but the overall downtrend requires a cautious approach.
ETHUSD finds support at $1,811.25 and bounces, targeting $1,935.13 resistance. Confirmation requires a break above the 1-hour 200 SMA and a positive shift in market sentiment.
ETHUSD breaks below $1,811.25 support, accelerating the downtrend towards $1,761.09 and potentially $1,687.37. This scenario is likely if the DXY continues its upward trajectory.
Risk Management: Protecting Your Capital
Effective risk management is paramount in volatile markets. Traders should implement stop-loss orders to protect their capital and avoid excessive losses. A stop-loss order placed slightly below the $1,811.25 support level would be a prudent approach. Position sizing should also be carefully considered to align with individual risk tolerance and account size. Avoid over-leveraging positions, as this can amplify both gains and losses.
Frequently Asked Questions: ETHUSD Analysis
Is ETHUSD a good buy right now?
ETHUSD is approaching oversold conditions, but the overall trend remains bearish. A cautious approach is warranted, waiting for confirmation of a reversal before initiating a long position. Look for a sustained break above $1,836.20 as an initial signal.
What is the ETHUSD price forecast for this week?
The ETHUSD price forecast for this week is highly dependent on the direction of the DXY and overall market sentiment. A bullish scenario could see ETHUSD testing $1,935.13, while a bearish scenario could lead to a retest of $1,761.09.
What are the key support and resistance levels for ETHUSD?
Key support levels for ETHUSD are $1,811.25, $1,761.09, and $1,687.37. Key resistance levels are $1,935.13, $2,008.85, and $2,059.01.
Why is ETHUSD moving today?
ETHUSD is primarily moving due to the strength of the U.S. dollar and overall bearish sentiment in the cryptocurrency market. The strength in the DXY is putting downward pressure on ETHUSD. The decline may also be attributed to profit taking after the recent rally.
Technical Outlook Summary
| Indicator | Value | Signal |
|---|---|---|
| RSI (14) | 29.57 | Oversold |
| MACD Histogram | Negative | Bearish |
| Stochastic | K=33.89, D=38.61 | Bearish |
| ADX | 37.94 | Strong Trend |
| Bollinger | Middle Band | Watch |
Track markets in real-time
AI-powered analysis, technical indicators and real-time price data.
Join Our Telegram Channel
Breaking market news, AI analysis and trading signals instantly.
Join Channel