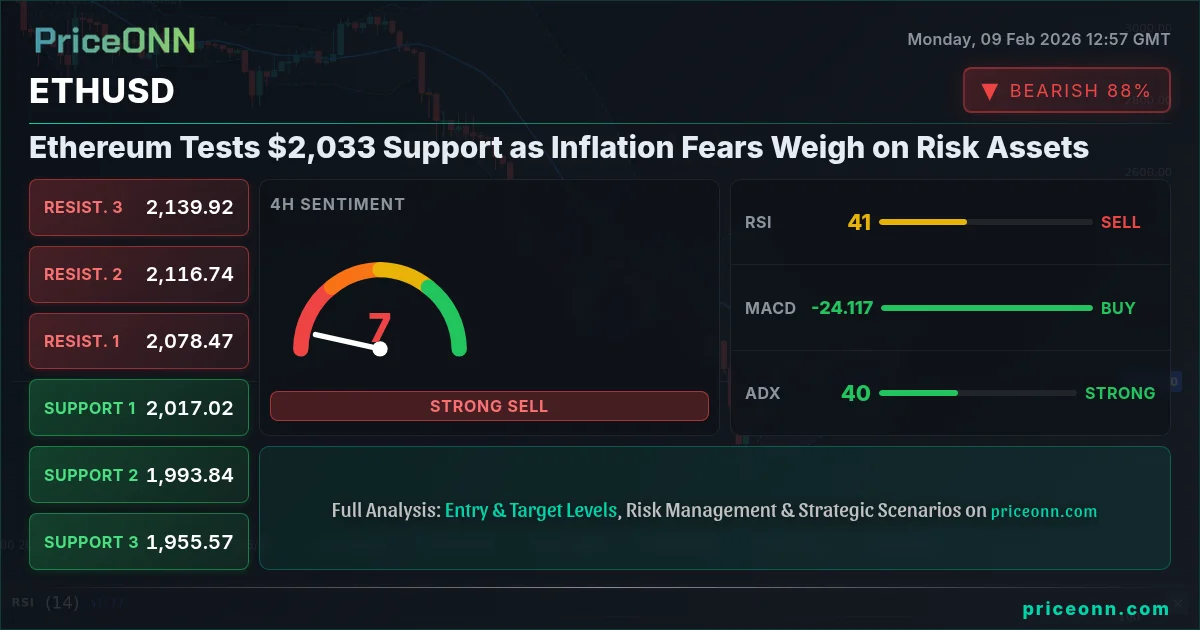
Ethereum is under pressure, trading at $2,033.94 after a sharp 2.76% decline that saw the cryptocurrency test critical support levels. The selloff mirrors a broader risk-off shift in markets as inflation worries resurface and the U.S. dollar flexes its muscles. With RSI approaching oversold territory and DXY climbing, ETH bulls face an uphill battle-but the setup isn't without opportunity.
Time Horizon: This analysis is for swing traders, focusing on 4-hour and daily charts with a 2-week outlook.
Ethereum's 2.76% drop coincides with DXY surging toward 97.00 and risk assets broadly retreating. The correlation is clear: when the dollar strengthens, crypto bleeds. Today's inflation narrative is fueling that dollar bid, creating a headwind for ETH that won't ease until we see softer CPI prints or a dovish Fed pivot.
The Inflation Backdrop - Why ETH Is Bleeding
Let's be blunt: inflation expectations are back in the driver's seat. While headline CPI has cooled from its 2022 peaks, core inflation remains sticky. The Fed's preferred PCE measure is still above the 2% target, and recent rhetoric from Fed officials suggests rate cuts are off the table for now. That's a problem for non-yielding assets like Ethereum.
Here's the mechanism: when inflation fears rise, the Fed keeps rates higher for longer. That makes the dollar more attractive (yield!) and punishes risk assets. Ethereum, which offers no dividend or interest, becomes less appealing. Meanwhile, the strong dollar crushes crypto prices denominated in USD. It's a double whammy.
- Fed Hawkishness: Recent FOMC minutes revealed officials are concerned about inflation's persistence. Swap markets now price just one 25bp cut in 2026-down from three cuts a month ago.
- Real Yields Rising: 10-year TIPS yields have climbed to 2.1%, making bonds competitive with crypto's risk-adjusted returns.
- Dollar Strength: DXY at 96.90 is up 0.44% today, with RSI at 21.61 signaling short-term oversold-but the trend remains bearish for risk assets.
Don't assume oversold RSI means ETH will bounce immediately. In strong downtrends (ADX 50.39 on the daily), RSI can stay oversold for weeks. Wait for confirmation: daily close above $2,070 + volume spike before turning bullish.
Technical Breakdown - The Bears Are in Control
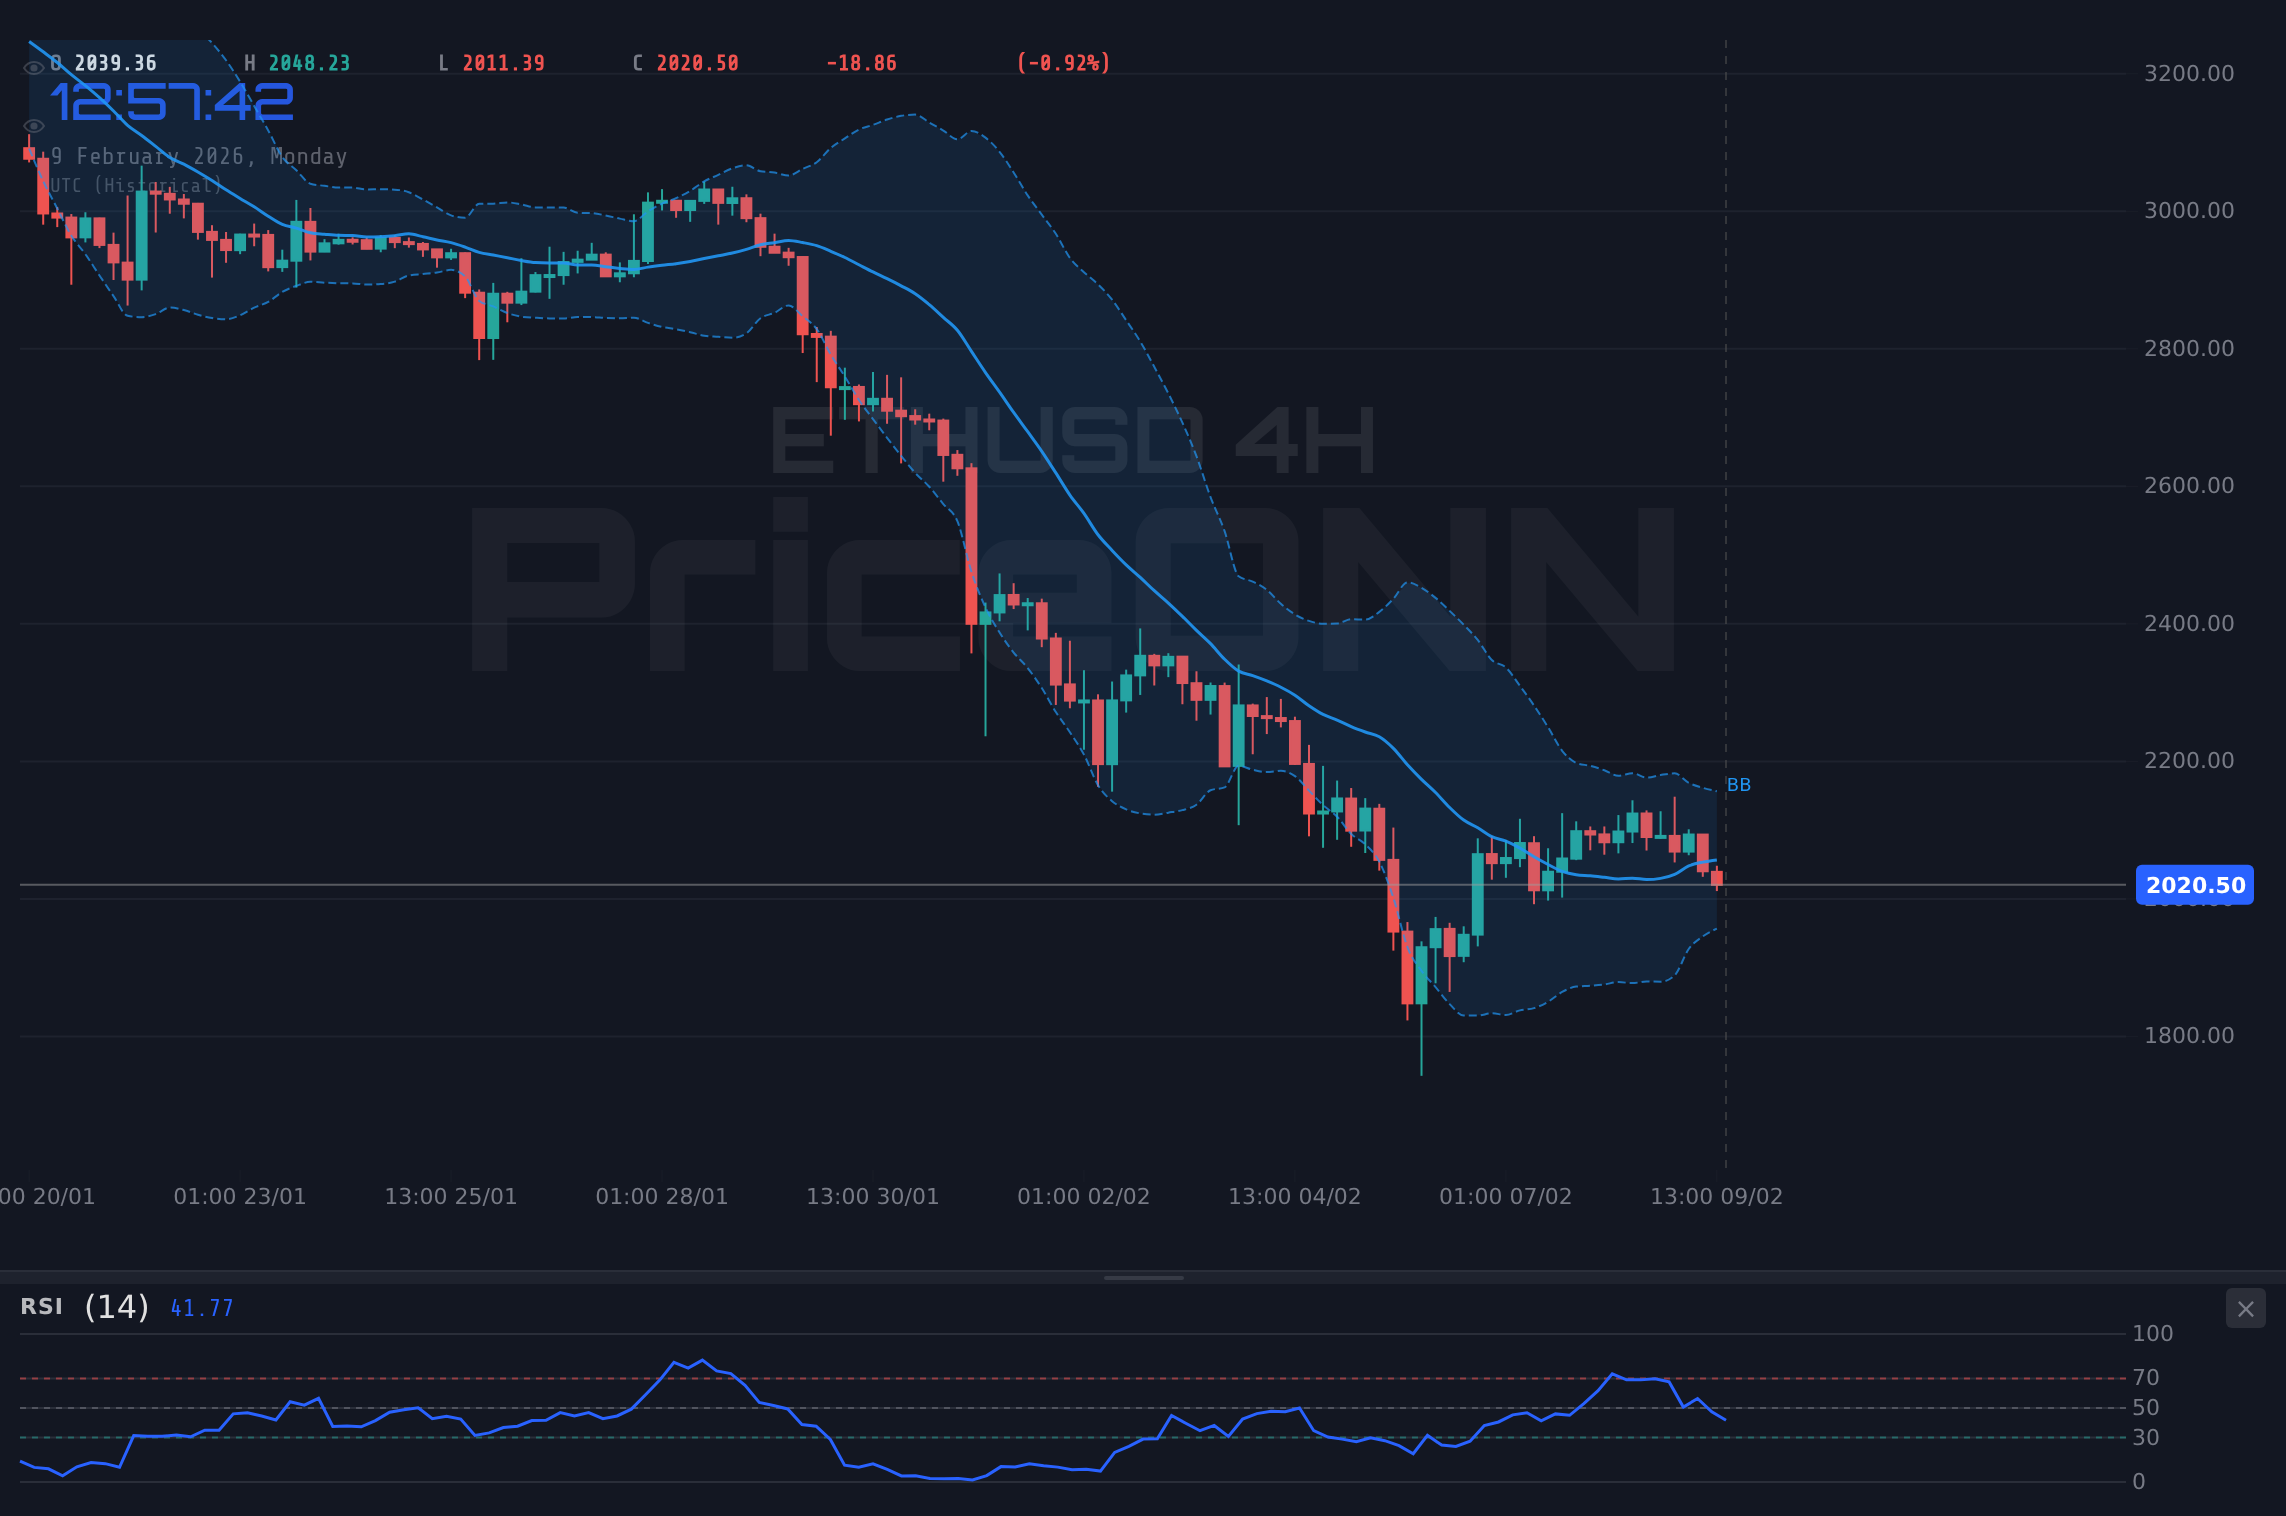
The charts don't lie. Ethereum's technical picture is bearish across all timeframes, with indicators flashing red flags. RSI on the daily is at 29.66-deep in oversold territory-but with ADX at 50.39, the downtrend has serious momentum. That's a toxic combo: oversold doesn't mean a reversal is imminent; it means sellers are relentless.
On the 1-hour chart, ETH tested $2,011.39 (the session low) before bouncing to current levels. That's your first support. Below that? The $1,991.96 level from the 4H chart looms large. A break there opens the door to $1,976.96, where long-term buyers might finally step in.
If you're looking to catch a falling knife, use a laddered buy approach: allocate 33% at $2,000, another 33% at $1,976, and the final 33% at $1,940. This averages your entry and protects against premature buying. Set a hard stop below $1,920 to cap losses.
MACD tells a similar story. On the daily, the histogram is negative and deepening, with MACD below the signal line. No crossover in sight. The 4H MACD is barely positive (+0.45), but that's flickering-one more red candle and it flips bearish. Momentum is clearly with the bears.
Bollinger Bands? ETH is trading below the midline on all timeframes-a classic bearish signal. The bands on the 1H chart are widening after compression, suggesting volatility is expanding. That usually precedes a big move, and right now, the path of least resistance is down.
- Stochastic (1H): K at 15.70, D at 21.46-oversold, but in a downtrend, this just means sellers are pausing, not capitulating.
- ADX (Daily): 50.39 screams "strong trend." When ADX is above 40, don't fight the direction. Right now, that direction is south.
- Volume: Selling volume spiked during the drop to $2,011. That's distribution, not profit-taking. Big players are exiting.
RSI at 29.66 is screaming oversold, but ADX at 50.39 is screaming strong downtrend. What gives? Simple: RSI can stay oversold for extended periods in powerful trends. The textbook "buy oversold" play doesn't work here. You need a trend reversal signal first-like ADX dropping below 30 or a daily close above $2,070 with volume confirmation. Until then, oversold = still falling.
Catalysts Ahead - What Could Shift the Narrative
Markets don't move in a vacuum. Several upcoming events could either accelerate ETH's decline or spark a reversal. The key is U.S. economic data-specifically CPI and retail sales-which will dictate Fed policy expectations and, by extension, the dollar's trajectory.
Beyond macro data, watch Bitcoin. ETH's correlation with BTC remains high (0.85+), and Bitcoin is testing $68,423 support. If BTC breaks lower, ETH will follow. Conversely, a BTC bounce above $70,000 could lift ETH back toward $2,100.
A downside CPI surprise (0.1-0.2%) would trigger a sharp dollar selloff and risk-on rally. ETH could gap up to $2,150+ within hours. If you're positioned in spot ETH with a $1,976 average, that's a quick 6% gain. The risk/reward favors staying patient for this scenario.
Portfolio Implications - How to Navigate This
If you're a long-term ETH holder, this drawdown is painful but not catastrophic. Ethereum's fundamentals-staking yields, DeFi dominance, upcoming upgrades-remain intact. The selloff is macro-driven, not ETH-specific. That means it's temporary, assuming the Fed eventually pivots.
For traders, the setup is trickier. The trend is your enemy right now. Shorting into oversold conditions is dangerous, but so is buying prematurely. The smart play? Wait for confirmation. That means:
- Bulls: Wait for a daily close above $2,070 with RSI crossing back above 40. That signals momentum is shifting. Until then, stay in cash or nibble at $1,976 with tight stops.
- Bears: If ETH breaks $2,000, the next leg down targets $1,940. A daily close below $1,976 invalidates any near-term bullish case and opens $1,850. Use rallies to $2,060-$2,080 to add shorts.
- Range Players: If ETH stabilizes between $2,000-$2,100, scalp the range. Buy near support, sell near resistance, keep size small.
Volatility is spiking-the 24H range was $137, nearly 7% of price. Use position sizing to survive whipsaws. A 2% account risk per trade is prudent here. If you're long from $2,100, your stop should be below $1,976 (invalidation level). That's a $124 risk per ETH. Size accordingly.
Trade Scenarios - Two Paths Forward
Scenario A - Capitulation & Reversal
35% ProbabilityScenario B - Continued Breakdown (Base Case)
55% ProbabilityScenario C - Range Consolidation
10% ProbabilityThe base case (Scenario B) assumes the downtrend continues until we see a macro catalyst (soft CPI) or technical capitulation (volume spike + RSI divergence). Scenario A is the contrarian play-risky, but high reward if inflation fears ease. Scenario C is low probability because volatility is too high for a boring range.
Correlation Context - DXY, BTC, and Risk Sentiment
Ethereum doesn't trade in isolation. Its price is heavily influenced by three factors: the U.S. dollar, Bitcoin, and broader risk sentiment. Right now, all three are working against ETH.
DXY (Dollar Index): At 96.90, DXY is down 0.44% today but remains in a structural uptrend. The 1H RSI at 21.61 suggests a short-term bounce is coming, which would pressure ETH further. On the 4H chart, DXY is testing support at 97.09-if that holds, expect dollar strength to resume, crushing crypto.
Bitcoin: BTC is at $69,068, down 2.31% and testing critical support at $68,423. If Bitcoin breaks lower, ETH will follow. The BTC/ETH ratio is stable, meaning ETH isn't underperforming BTC-it's just moving in lockstep. A BTC rally above $70,800 would be the green light for ETH longs.
Risk Sentiment: Equity futures are flat, but volatility (VIX) is creeping higher. That's a risk-off signal. When stocks wobble, crypto amplifies the move. Watch S&P 500 futures-if they break below 6,000, expect another leg down in ETH.
If DXY RSI bounces from 21.61 but fails to break above 97.50, it suggests dollar strength is exhausted. That's your cue to go long ETH with reduced risk. Conversely, if DXY breaks above 97.50 with volume, add to shorts-the dollar rally has legs.
What Long-Term Investors Should Do
If you're not a trader-if you're holding ETH for the next bull cycle-this selloff is noise. Ethereum's staking yield (3-4%) beats Treasury bills, and the network's fundamentals are strengthening. Layer-2 adoption is exploding, DeFi TVL is recovering, and institutional interest (spot ETH ETFs) is building.
That said, timing matters. Buying at $2,033 is better than buying at $2,400, but $1,850 would be even better. Dollar-cost averaging (DCA) is your friend here. Allocate 25% of your intended position now, another 25% at $1,940, and the rest if we hit $1,800. This smooths your entry and reduces regret.
- Staking Opportunity: If you're buying spot ETH, stake it immediately. At current yields, that's $60-80/year per ETH. Passive income softens the blow of price volatility.
- Tax Loss Harvesting: If you bought higher, consider selling at a loss to offset 2026 gains, then rebuying after 30 days (wash sale rule). Check local tax laws first.
- Avoid Leverage: In a bearish macro environment, leverage is a death trap. Spot holdings only. Sleep better at night.
| Indicator | Timeframe | Value | Signal | Interpretation |
|---|---|---|---|---|
| RSI (14) | 1D | 29.66 | Oversold | Deep oversold, but trend is strong-no reversal yet |
| RSI (14) | 4H | 42.68 | Bearish | Below 50, downward momentum intact |
| MACD | 1D | Negative | Sell | Histogram deepening, no crossover in sight |
| MACD | 4H | +0.45 | Weak Positive | Barely above signal line, flickering bearish |
| ADX | 1D | 50.39 | Strong Downtrend | Extremely strong trend-don't fight it |
| Stochastic | 1H | 15.70 / 21.46 | Oversold | K < D, bearish crossover, but extreme oversold |
| Bollinger Bands | 1H | Below Mid | Bearish | Price below centerline, bands widening (volatility expanding) |
| Trend (4H) | 4H | 50% | Neutral | Oscillating, no clear direction on 4H yet |
| Trend (1D) | 1D | Downtrend | Bearish | 100% bearish trend strength-sell signal dominant |
Ethereum's selloff is a function of macro headwinds-inflation fears, dollar strength, and risk-off sentiment. The technicals are unambiguously bearish, with RSI oversold but ADX confirming trend strength. For traders, the prudent move is waiting for confirmation: a daily close above $2,070 signals reversal potential; a break below $2,000 opens the door to $1,940 and lower.
Long-term holders should view this as an accumulation opportunity, but with patience. DCA into weakness, stake your holdings, and avoid leverage. The next bull cycle will come-it always does-but only those who survive the drawdown will be there to enjoy it. Position sizing is your armor; discipline is your edge. Trade smart, stay patient, and let the market come to you.
Track markets in real-time
AI-powered analysis, technical indicators and real-time price data.
Join Our Telegram Channel
Breaking market news, AI analysis and trading signals instantly.
Join Channel