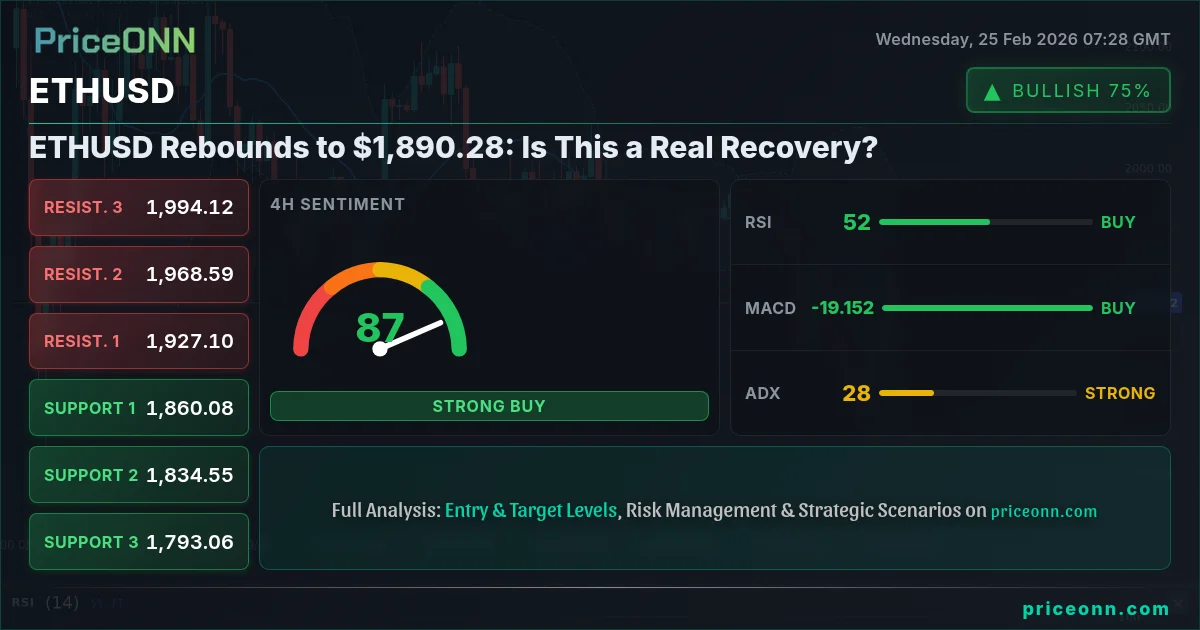
ETHUSD is showing signs of life, rebounding to $1,890.28 after a period of sustained selling pressure. The critical question for traders now is whether this bounce represents a genuine shift in market sentiment, or simply a temporary reprieve before further downside. Several technical indicators are flashing mixed signals, making a clear directional call challenging, but a deeper dive reveals potential trading opportunities.
- RSI at 58.42 on the 1H chart suggests increasing buying pressure, but not yet overbought.
- Key resistance lies at $1,902.71, a breakout above which could signal further gains.
- Stochastic oscillator (K=50.16, D=65.13) indicates a potential short-term pullback before continuation.
- Broader market context: DXY strength continues, creating headwinds for ETHUSD.
Having tracked ETHUSD through multiple market cycles, I've learned that these inflection points require careful evaluation. The initial move is often driven by short covering or automated algorithms, but the follow-through determines the true market direction. The current bounce is occurring amid a broader risk-off environment, as evidenced by the DXY's strength. This suggests that the upside potential for ETHUSD may be limited unless risk appetite improves significantly.
Decoding ETHUSD's Technical Signals: A Multi-Timeframe Analysis
The hourly chart offers the first clues about the potential strength of this rally. The RSI currently sits at 58.42, indicating increasing buying pressure but not yet in overbought territory. This suggests that there is room for further upside, but also that bulls are not yet in complete control. The MACD histogram shows positive momentum, further supporting the bullish case. However, the Stochastic oscillator (K=50.16, D=65.13) suggests a potential short-term pullback before continuation, as the faster %K line is below the %D line. This could provide a more attractive entry point for traders looking to capitalize on the upward momentum.
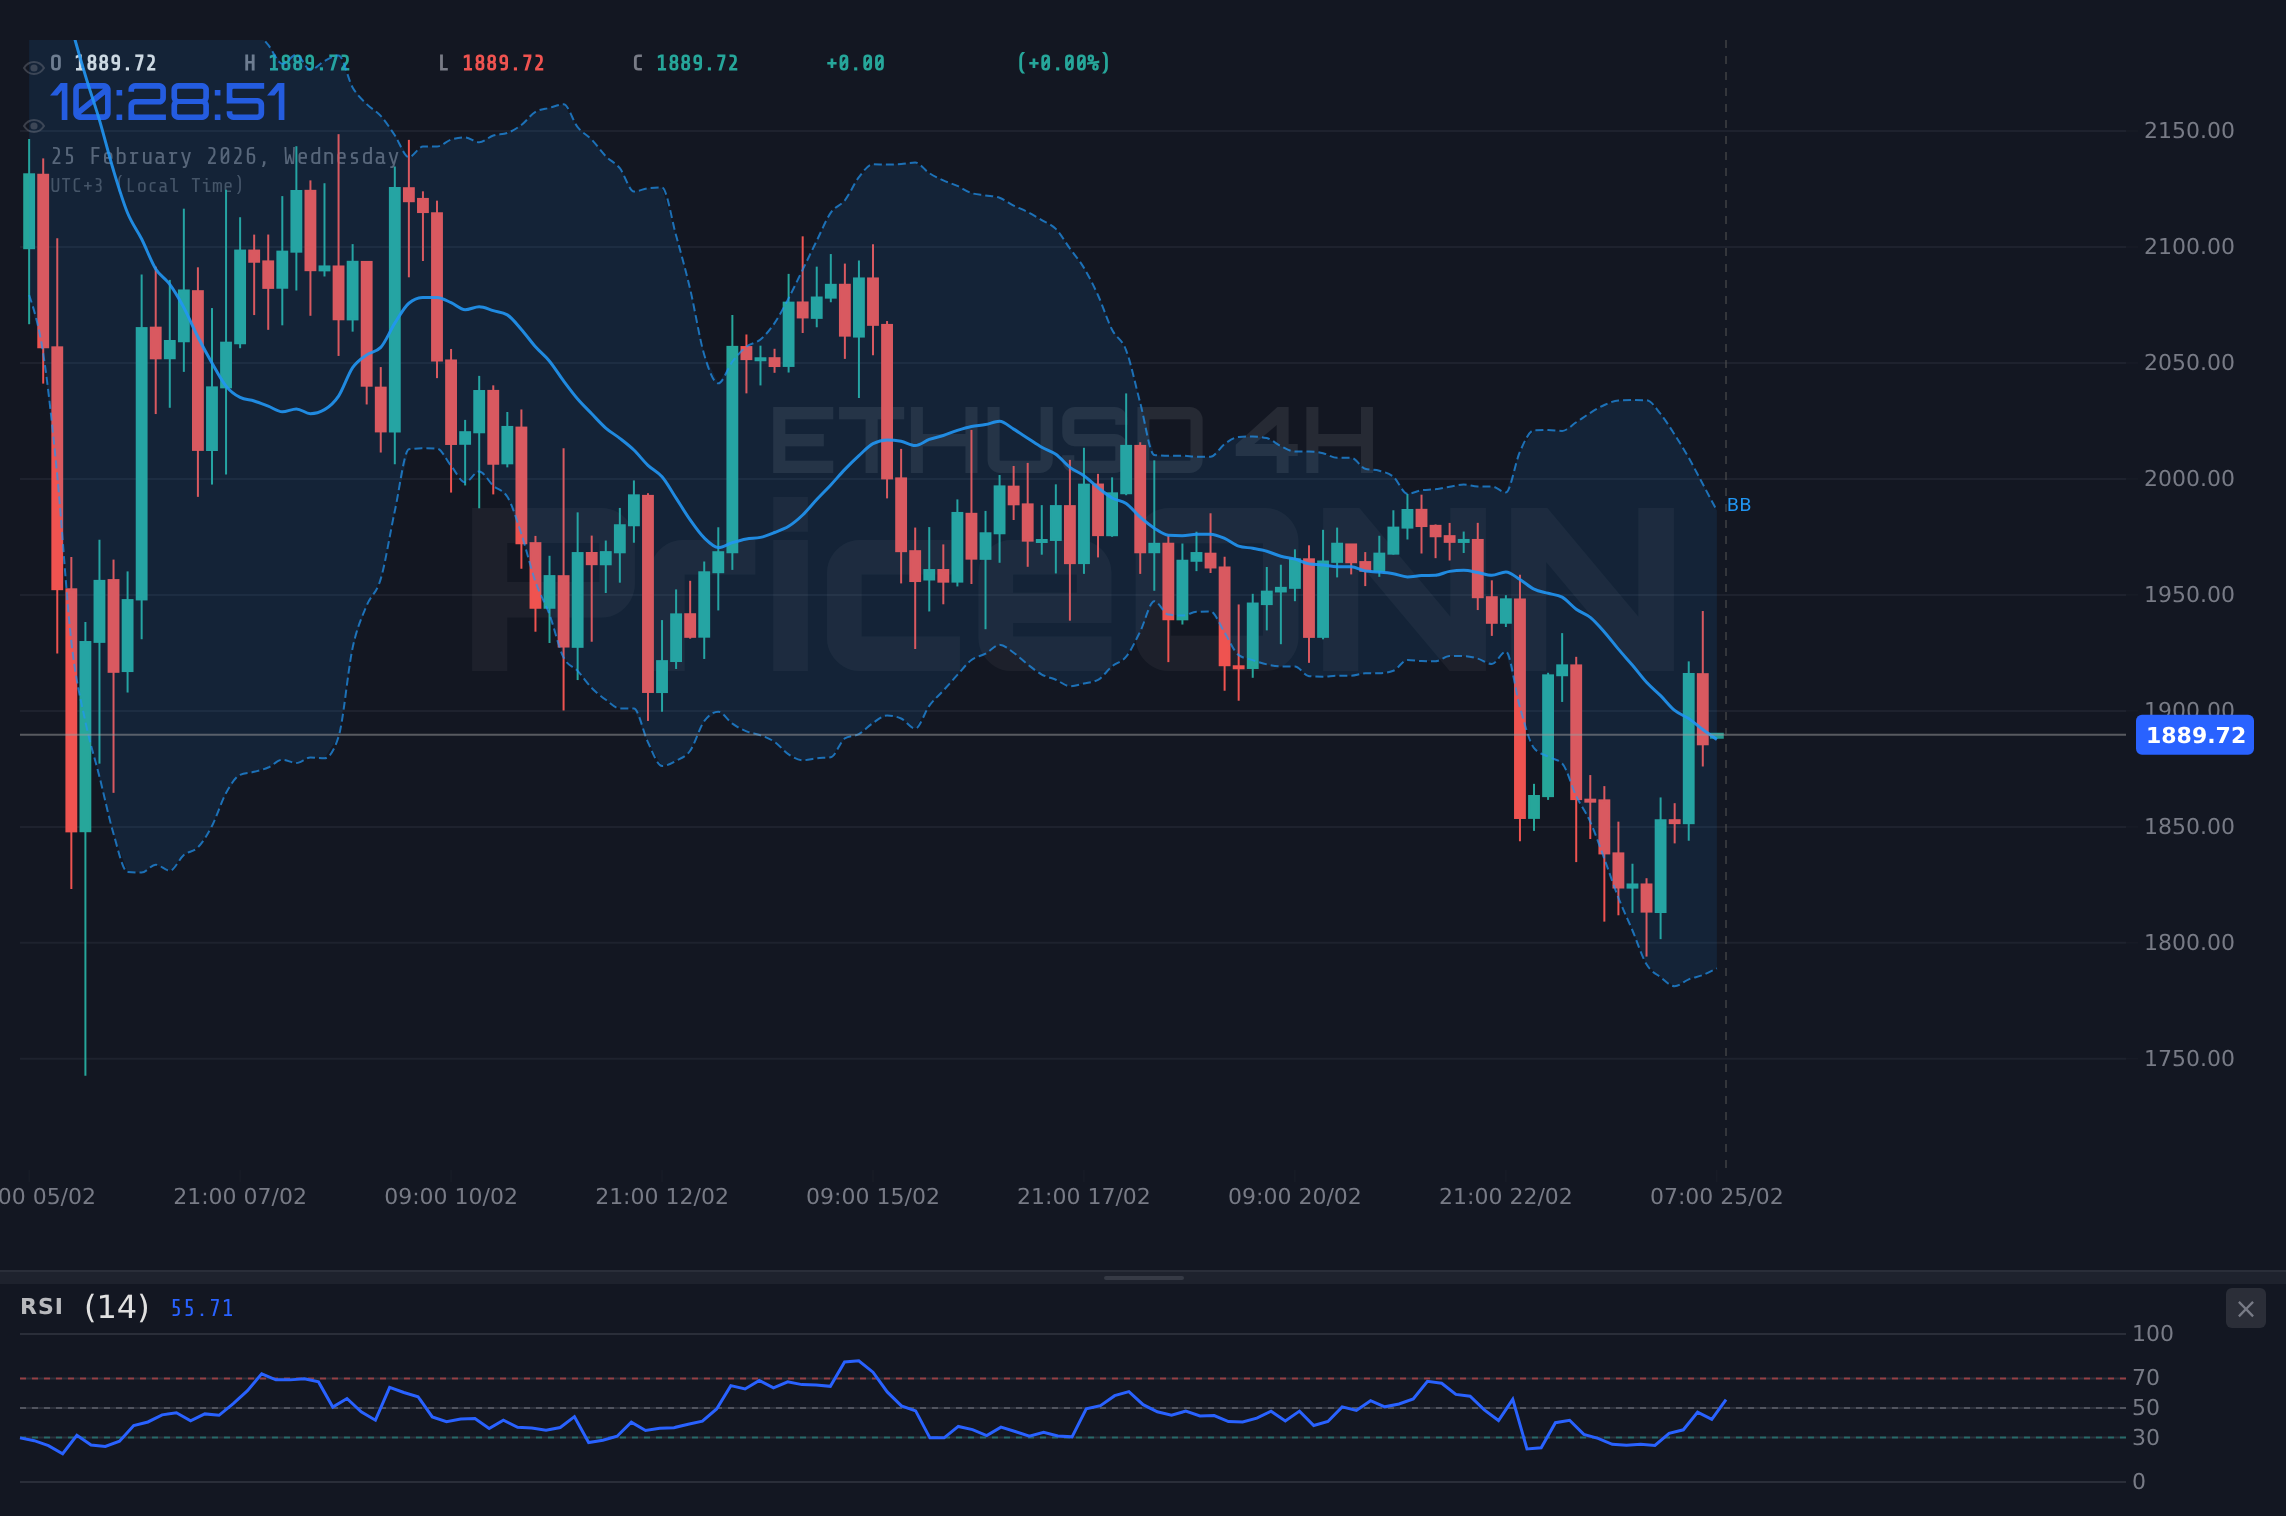
Zooming out to the 4-hour timeframe paints a more nuanced picture. The RSI reading of 48.41 is neutral, indicating a lack of strong directional bias. The MACD continues to show positive momentum, but the Bollinger Bands are contracting, suggesting a period of consolidation. The ADX, however, reads 30.07. This tells us the price is trending strongly, but the trend is down. This creates a conflicting signal. The overall signal is "SELL".
On the daily chart, the technical picture is bearish. The RSI is at 34.37, indicating a downtrend. The MACD histogram shows positive momentum, but the price is below the moving average. The ADX on the daily chart is 56.46, indicating a very strong downtrend. The overall signal is "SELL".
Key ETHUSD Price Levels: Support, Resistance, and Breakout Zones
Understanding key price levels is crucial for developing a sound trading strategy. Immediate resistance lies at $1,902.71, the first major hurdle for bulls to overcome. A sustained break above this level could open the door to further gains, potentially targeting $1,919.82. On the downside, immediate support can be found at $1,872.27. A breakdown below this level would likely trigger further selling pressure, with the next support zone around $1,858.94.
Having tracked ETHUSD for a long time, I've seen many false breakouts. Therefore, confirmation is key. A breakout needs to be accompanied by volume and sustained buying pressure. Otherwise, it's just a liquidity grab before the next leg down.
Historically, when ETHUSD has failed to hold above a key support level like $1,872.27, it has tended to experience significant downside follow-through. Therefore, traders should be prepared to adjust their positions quickly if this scenario unfolds. The $1,858.94 level is a critical area to watch, as a break below it could trigger a cascade of stop losses and accelerate the decline.
Navigating the ETHUSD Landscape: A Potential Trade Plan
Given the conflicting signals, a cautious approach is warranted. However, the potential for upside momentum suggests that a long position could be considered, but with strict risk management. A potential entry trigger would be a confirmed break above the $1,902.71 resistance level, accompanied by increasing volume. The first target would be $1,919.82, with a second target at $1,933.15. A stop-loss should be placed below the $1,872.27 support level to protect against downside risk.
A break above $1,902.71 resistance, confirmed by strong volume, could trigger a rally towards $1,919.82 and potentially $1,933.15. The overall trend needs to reverse on the daily chart to confirm this. Risk appetite improving, as evidenced by a weaker DXY, would also support this scenario.
Failure to hold above $1,872.27 support could lead to a sharp decline towards $1,858.94, with further downside potential towards $1,841.83. Continued DXY strength and a risk-off environment would exacerbate this scenario.
Economic Calendar and Market Sentiment: What to Watch Next
The overall trend on ETHUSD is down. However, the 1H and 4H charts show some signs of a potential reversal. The market sentiment remains cautious, with traders closely watching the economic data releases and central bank commentary for further clues about the future direction of interest rates and economic growth. Watch for the USD data release, which has a forecast of 1.8. Any number higher will likely push the dollar up and ETHUSD down.
Frequently Asked Questions: ETHUSD Analysis
Is ETHUSD a good buy right now?
ETHUSD presents a mixed picture currently trading at $1,890.28. While some short-term indicators suggest potential upside, the overall trend remains bearish, suggesting caution. A confirmed break above $1,902.71 could present a buying opportunity, but strict risk management is essential.
What is the ETHUSD price forecast for this week?
The ETHUSD price forecast for this week hinges on breaking above the $1,902.71 resistance level. If successful, targets of $1,919.82 and $1,933.15 are possible. However, failure to break this resistance could lead to a retest of $1,872.27 support, with a potential breakdown towards $1,858.94.
What are the key support and resistance levels for ETHUSD?
Key support levels for ETHUSD are $1,872.27, $1,858.94, and $1,841.83. Key resistance levels are $1,902.71, $1,919.82, and $1,933.15. These levels represent potential areas of buying and selling pressure, and traders should watch for reactions at these points.
Why is ETHUSD moving today?
ETHUSD's movement today is influenced by a combination of technical factors and broader market sentiment. The current rebound is likely driven by short covering and a temporary reprieve from sustained selling pressure. However, DXY strength and economic data releases are also playing a role.
Technical Outlook Summary
| Indicator | Value | Signal |
|---|---|---|
| RSI (14) | 58.42 | Neutral |
| MACD Histogram | Positive | Bullish |
| Stochastic | 50.16/65.13 | Bearish |
| ADX | 27.93 | Strong |
| Bollinger | Middle Band | Watch |
Track markets in real-time
AI-powered analysis, technical indicators and real-time price data.
Join Our Telegram Channel
Breaking market news, AI analysis and trading signals instantly.
Join Channel