
GBPUSD Tests $1.32 Resistance Amid Strong US Data: Bull vs. Bear Showdown
GBPUSD hovers near $1.32 as strong US data fuels dollar demand, creating a critical juncture for the pair. Analysis of indicators and market sentiment.
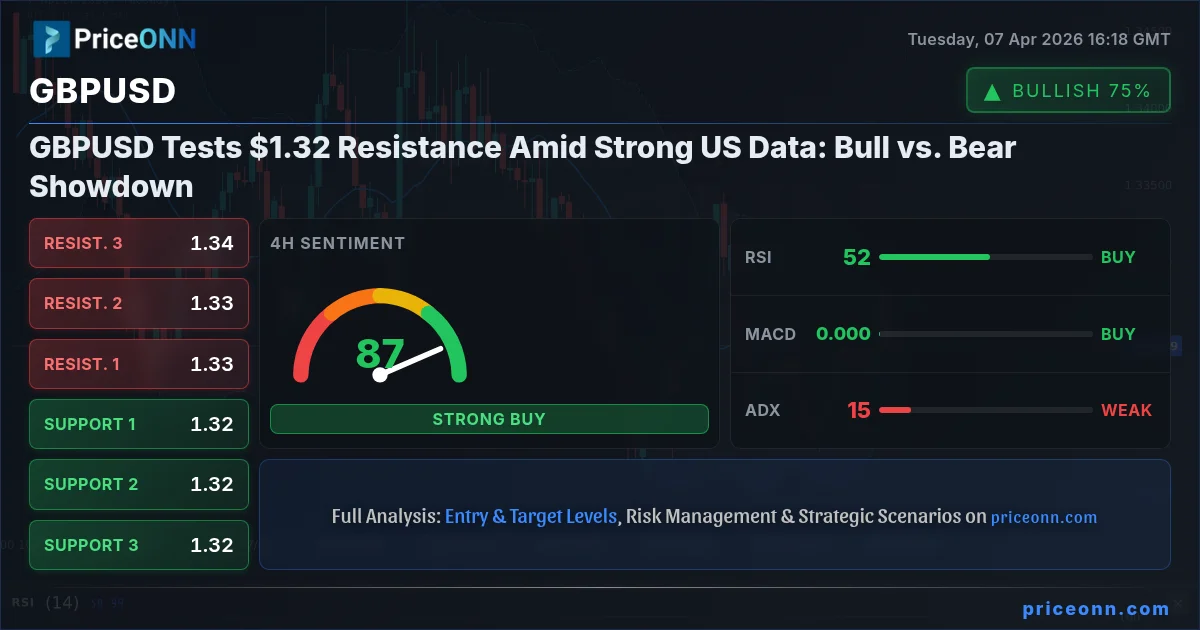
The GBPUSD pair is currently locked in a tense battle around the $1.32 mark, a level that's proving to be a significant battleground between bulls and bears. With the US Dollar Index (DXY) showing renewed strength, driven by robust economic data, the pressure is mounting on this key currency pair. This critical juncture demands a deep dive into the competing forces shaping GBPUSD's trajectory, examining both the bullish case for a potential upside break and the bearish arguments for a pullback.
- The RSI at 50.16 on the 1-hour chart signals neutral pressure, but the 4-hour RSI at 51.75 suggests a slight upward lean.
- Critical resistance sits at $1.32792, tested multiple times this week, while support is found at $1.32317 on the 1-hour chart.
- The ADX on the 1-hour chart at 23.56 indicates a medium-strength trend, suggesting potential for a decisive move if key levels are breached.
- Fed rate expectations, influenced by US economic data, are driving GBPUSD's correlation with the DXY, currently trading at 99.65.
The Bulls' Stand: Why $1.32 Could Be a Launchpad
On the bullish side, there are several technical and fundamental undercurrents suggesting that the $1.32 level could serve as a launchpad for further gains. The 4-hour chart shows a general upward trend with a strength of 86%, indicating that despite short-term consolidation, the longer-term sentiment might favor buyers. The RSI(14) on this timeframe is at 51.63, firmly in neutral territory but trending upwards, hinting at building momentum. Furthermore, the Stochastic indicator on the 4-hour chart, with %K at 60.13 and %D at 60.28, is in the upper half of its range, suggesting potential for upward movement, though it hovers near a potential bearish crossover.
The overall signal for the 4-hour timeframe is 'BUY' (7 buys, 1 sell), which, while not an overwhelming consensus, leans positive. The MACD on the 4-hour chart also shows positive momentum, with the MACD line above the signal line, reinforcing the bullish sentiment. This suggests that underlying buying pressure is present, and a catalyst could easily push GBPUSD higher. The daily chart, although showing a slight bearish trend with a strength of 96%, still exhibits a positive MACD momentum and Stochastic %K (53.83) above %D (48.78), indicating a potential for a reversal or a bounce from current levels. The fact that the pair is consolidating near resistance rather than breaking down immediately can be interpreted as strength.
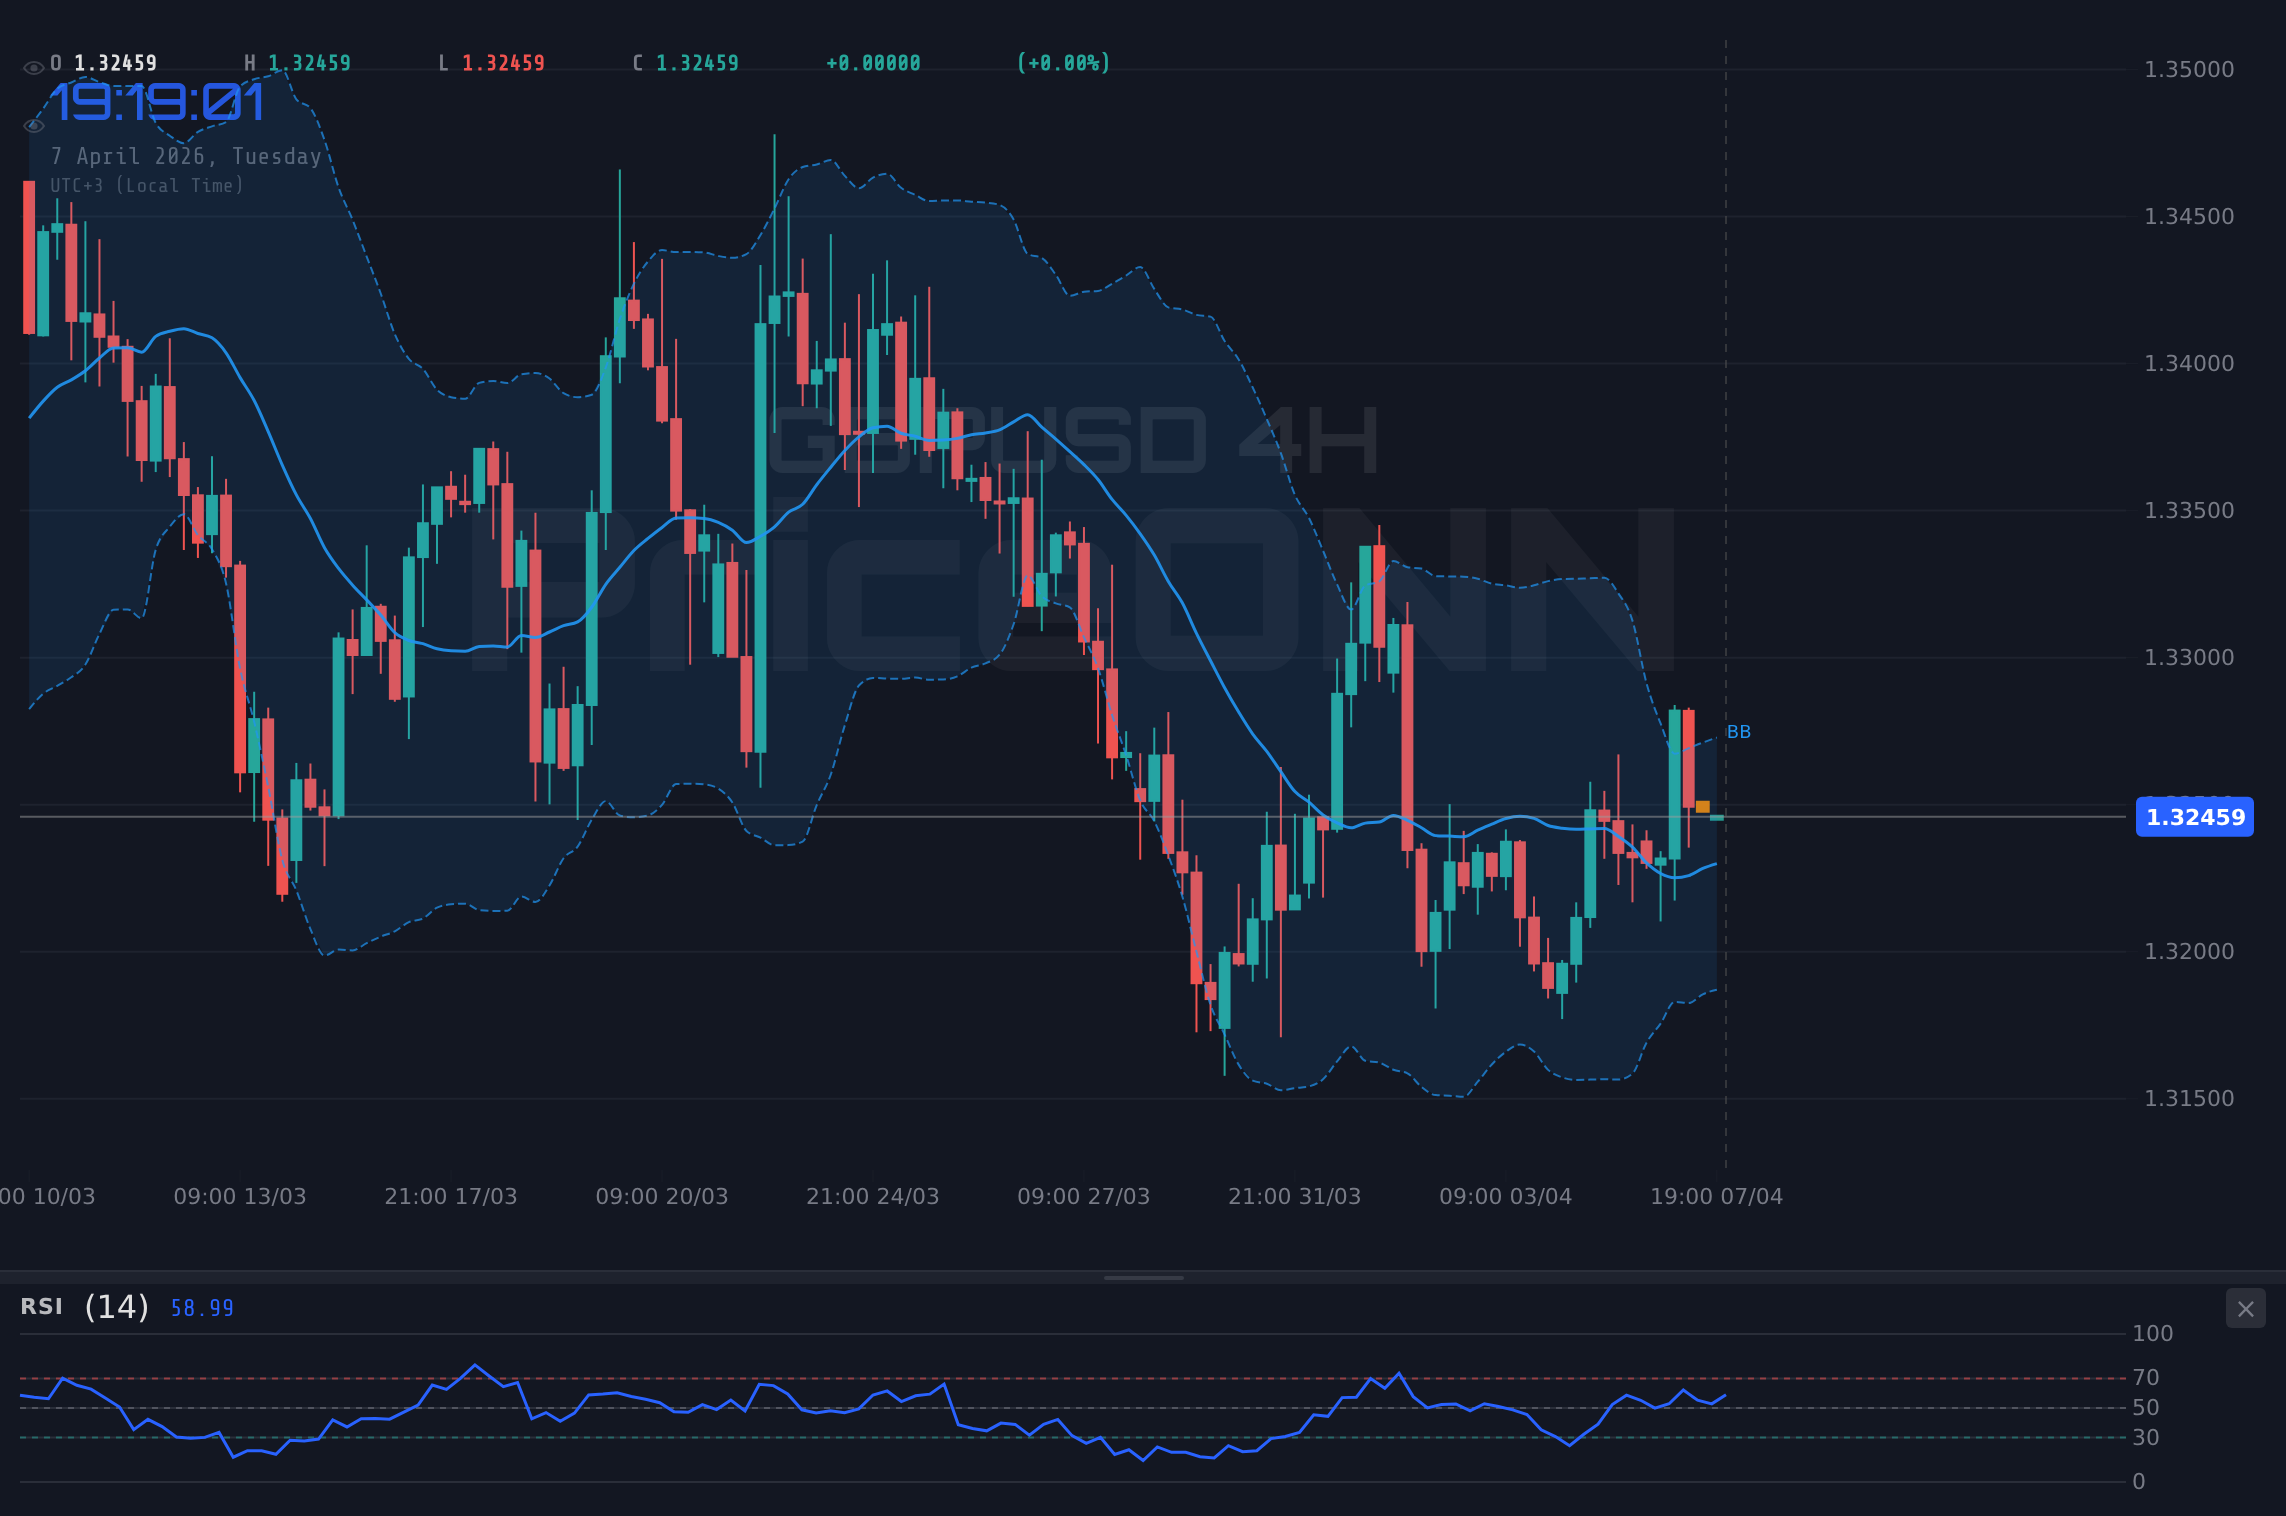
From a broader market perspective, if risk appetite were to increase, the British Pound, often seen as a slightly riskier currency compared to the US Dollar, could benefit. While the current geopolitical tensions, particularly around Iran, are generally risk-off drivers, any de-escalation or perceived stabilization could shift sentiment. Moreover, if upcoming UK economic data surprises on the upside, it could provide the necessary impetus for GBPUSD to break through the $1.32792 resistance level. The current ADX of 23.56 on the 1-hour chart signifies a moderately trending market, which, if it strengthens, could support a sustained move higher.
The Bears' Defense: US Data and Dollar Strength
Conversely, the bearish argument is primarily anchored in the strength of the US Dollar, bolstered by recent economic data. The DXY is currently trading at 99.65, and while it's showing a neutral trend on the 1-hour and 4-hour charts, its daily trend is strongly bullish (95% strength). This underlying dollar strength acts as a constant headwind for GBPUSD. The market is pricing in expectations for the Federal Reserve to maintain a hawkish stance, especially if inflation remains persistent. Recent US economic data, though not explicitly detailed here, has been strong enough to support this narrative, making it difficult for GBPUSD to gain significant traction.
Technically, the 1-hour chart presents a more cautious picture for the bulls. The trend is classified as neutral with a strength of 50%, and the ADX at 23.56 indicates a trend that is not yet firmly established. The Stochastic indicator (%K at 30.27, %D at 46.69) is showing a bearish signal, with %K below %D, suggesting downward momentum. The MACD histogram is negative, further supporting the bearish bias on this shorter timeframe. While the overall signal is 'BUY' (5 buys, 3 sells), this split suggests significant indecision and potential for a reversal.
On the daily timeframe, the trend is decidedly bearish with 96% strength. The RSI(14) is at 44.17, indicating a downward bias and room to fall before reaching oversold territory. The MACD is in negative momentum, and the Bollinger Bands are below the middle band, reinforcing the bearish outlook. The ADX at 31.34 confirms a strong downtrend on this longer timeframe. This daily picture suggests that any rallies might be short-lived opportunities for sellers to enter the market. The key support levels to watch on the downside are $1.32317, $1.32180, and $1.32011, according to the 1-hour data. A break below these could accelerate the move lower.
Geopolitical risks, while often supporting safe havens like the USD, can also create volatility that impacts all markets. Escalating tensions in the Middle East, as reported by various news outlets, can lead to unpredictable market reactions. If these tensions significantly increase demand for the dollar as a safe haven, it would further pressure GBPUSD. Additionally, any signs of inflation re-accelerating in the US could push Fed rate cut expectations further out, strengthening the dollar and weighing on the pair.
The Technical Tightrope: Indicators in Conflict
The technical indicators present a mixed and somewhat conflicting picture, highlighting the current indecision in the market. On the 1-hour chart, the trend is neutral, with the ADX at 23.56 suggesting moderate trend strength. However, the Stochastic indicator is flashing a bearish signal (%K
The 4-hour chart offers a slightly more bullish perspective, with a positive trend signal and MACD showing positive momentum. The RSI at 51.75 is neutral but leaning up, and the Stochastic is in the upper range, indicating potential for upside. However, the ADX here is weaker at 17.86, suggesting that any upward move might lack conviction. The confluence of signals is not strong enough for a clear directional trade without further confirmation.
The daily timeframe paints a predominantly bearish picture. The strong bearish trend (ADX 31.34) and the RSI at 44.17 indicate that sellers are in control over the longer term. The MACD is negative, and the Bollinger Bands are signaling a downward bias. This daily outlook casts a shadow over any short-term bullish signals seen on the lower timeframes. The market seems to be caught between the immediate bullish signals on the 4-hour chart and the dominant bearish trend on the daily chart, with the US Dollar's strength providing a persistent bearish undertone.
One crucial aspect to monitor is the interplay between GBPUSD and the DXY. With DXY currently at 99.65 and showing a strong daily uptrend, any further strengthening of the dollar will likely translate into weakness for GBPUSD. This inverse correlation is a key factor that traders must consider. If DXY breaks above its daily resistance of 99.92, it would add significant weight to the bearish case for GBPUSD.
The Verdict: A Watchful Pause Before the Next Move
Given the conflicting signals across different timeframes and the strong bearish undertone on the daily chart, the current situation for GBPUSD suggests a 'WATCH_ZONE' rather than a clear-cut trading opportunity. The ADX at 15.33 on the 1-hour chart indicates choppy, ranging conditions, meaning that a trade right now would carry significant risk. While there are some short-term bullish indicators, they are overshadowed by the daily bearish trend and the robust US Dollar.
For a valid bullish setup to emerge, we would need to see a decisive daily close above the resistance level of $1.32792. This would not only break through the immediate selling pressure but also potentially invalidate the short-term bearish signals and confirm a shift in momentum. Such a move would likely be accompanied by a weakening DXY and perhaps improved risk sentiment. Conversely, a failure to break higher and a subsequent close below the 1-hour support at $1.32317 could signal a continuation of the daily downtrend, targeting lower support levels.
The market is currently at a crossroads, with the $1.32 level acting as a crucial pivot. Until a clear breakout or breakdown occurs, accompanied by confirmation from other indicators and broader market sentiment, extreme caution is advised. Patience will be key for traders looking to capitalize on the next significant move in GBPUSD. Managing risk and waiting for a high-probability setup will be paramount.
Bearish Scenario: Dollar Dominance Prevails
65% ProbabilityBullish Scenario: Pound Strength Emerges
25% ProbabilityNeutral Scenario: Consolidation Continues
10% ProbabilityFrequently Asked Questions: GBPUSD Analysis
What happens if GBPUSD breaks decisively above the $1.32792 resistance level?
A strong daily close above $1.32792 would signal a bullish shift, potentially invalidating the current bearish trend on the daily chart. This could open the door for price to target the next resistance levels around $1.33048 and potentially higher.
Should I buy GBPUSD at current levels near $1.32 given the mixed signals?
Buying at current levels near $1.32 carries significant risk due to conflicting signals and the dominant daily bearish trend. A higher probability setup would require confirmation, such as a daily close above $1.32792 or a clear breakdown below $1.32317.
Is the RSI at 51.75 on the 4-hour chart a buy signal for GBPUSD?
An RSI of 51.75 is in neutral territory and trending upwards, suggesting some bullish momentum on the 4-hour chart. However, it's not a strong buy signal on its own, especially considering the bearish daily trend and the potential for stochastic crossover.
How will the strong US Dollar (DXY at 99.65) affect GBPUSD this week?
The strong daily uptrend in the DXY at 99.65 generally exerts downward pressure on GBPUSD due to their inverse correlation. If the DXY continues to strengthen, it will make it harder for GBPUSD to break higher and could accelerate a move towards support levels.
Track markets in real-time
AI-powered analysis, technical indicators and real-time price data.
Join Our Telegram Channel
Breaking market news, AI analysis and trading signals instantly.
Join Channel