
SP500 Tests $6,572.87 Resistance Amid Jobs Data and Fed Watch
SP500 hovers near $6,572.87 as traders weigh upcoming jobs data and Fed policy. Technicals show mixed signals with cautious optimism.
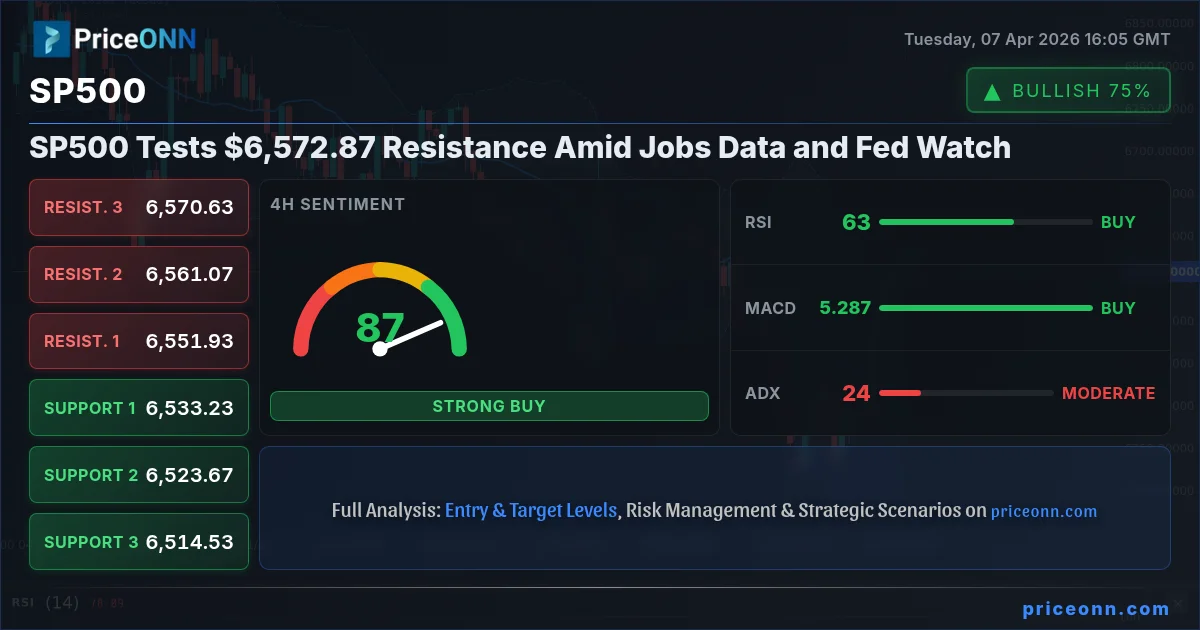
The S&P 500 is currently testing a critical resistance level around $6,572.87, a figure that demands immediate attention from traders and investors alike. This pivotal moment arrives as the market braces for crucial upcoming economic data, including jobs reports, and continues to decipher the Federal Reserve's evolving policy stance. The interplay between these factors is creating a complex tapestry of signals, making a disciplined approach more vital than ever. Having tracked the S&P 500 through numerous market cycles, I see a landscape where volatility is a given, but opportunity lies in understanding the nuances of price action and the underlying economic currents. The current technical picture, while showing some signs of bullish momentum, is also flashing caution flags, particularly as we approach key resistance thresholds.
- RSI at 70.95 on the 1-hour chart signals overbought pressure, suggesting potential for a short-term pullback.
- Critical resistance sits at $6,577.27, a level tested multiple times this week and acting as a key barrier.
- MACD histogram shows negative momentum on the 1-hour chart, indicating fading bullish conviction.
- The correlation with DXY, currently at 99.6, highlights the dollar's influence on risk assets like the SP500.
Navigating the SP500's Price Action at Resistance
The SP500's advance to $6,572.87 is not occurring in a vacuum. We're observing a confluence of technical indicators and macroeconomic undercurrents that paint a nuanced picture. On the 1-hour chart, the Relative Strength Index (RSI) has climbed to 70.95, a level often associated with overbought conditions. While this doesn't automatically signal a reversal, it does suggest that the buying pressure may be waning and that a period of consolidation or even a minor retracement could be on the horizon. The MACD histogram on the same timeframe is also showing negative momentum, reinforcing the idea that the immediate upward thrust might be losing steam. This divergence between the price pushing higher and momentum indicators suggesting otherwise is a classic sign that traders need to be extra vigilant.
Furthermore, the SP500's ascent is happening against a backdrop where the Dollar Index (DXY) is holding firm around 99.6. Historically, a strong dollar often correlates with pressure on U.S. equity markets, as it can signal tighter global liquidity or increased foreign investor caution. While the relationship isn't always perfect, the current DXY level adds another layer of complexity to the bullish case for stocks. Traders are keenly watching if this resistance at $6,577.27 can be decisively breached, which would require significant buying conviction to overcome the existing overhead supply and the cautionary signals from the oscillators.
The Influence of Economic Data and Fed Expectations
Looking beyond the immediate charts, the upcoming economic calendar looms large. Key employment figures are on deck, and their outcomes could significantly sway market sentiment and, consequently, the SP500's trajectory. Stronger-than-expected job growth, for instance, might be interpreted by the Federal Reserve as a sign of economic resilience, potentially delaying any anticipated interest rate cuts. Conversely, a weaker jobs report could reignite hopes for a more dovish Fed policy, which would typically be a tailwind for equities. The market's reaction function to these data points will be crucial. We've seen how sensitive SP500 price action has been to shifts in Fed expectations, and any data that challenges the current pricing of future rate moves will likely induce volatility.
The current pricing in Fed funds futures suggests a certain path for monetary policy, but any deviation from that path, driven by incoming data, can cause significant market adjustments. For instance, if inflation figures remain stubbornly high, or if employment continues to show robust gains, the narrative around Fed easing could shift dramatically. This uncertainty is a breeding ground for short-term trading opportunities but also introduces systemic risk for longer-term positions. Understanding the market's sensitivity to these macro drivers is paramount for navigating the current environment. The SP500's ability to hold its gains will heavily depend on whether the economic data supports a narrative of soft landing or prompts concerns about renewed inflationary pressures.
Intermarket Correlations: Bonds, Oil, and Global Sentiment
The SP500 doesn't trade in isolation. Its movements are intrinsically linked to other major markets, and understanding these correlations is key to a comprehensive market outlook. Treasury yields, for example, often move inversely to equities. If yields continue to climb, it can signal tighter financial conditions and potentially dampen enthusiasm for stocks. Conversely, falling yields might support a risk-on sentiment, benefiting the SP500. Currently, the yield curve dynamics are being closely watched for any signs of inversion or steepening that could signal future economic trends.
Oil prices, currently trading around $113.94 for WTI, also play a significant role. Elevated oil prices can contribute to inflation concerns, which in turn influences Fed policy and, by extension, equity market performance. While the current upward trend in oil prices might be driven by geopolitical tensions, as indicated by the surge in gold prices to $4,668.50 amid Middle East concerns, it presents a challenge for central banks trying to tame inflation without derailing economic growth. The SP500's ability to sustain its rally will be tested if rising energy costs translate into broader inflationary pressures that force a more hawkish central bank response.
Global risk sentiment, often reflected in indices like the Nasdaq 100 (currently at 24,066.29) and Dow Jones 30 (at 46,545.50), provides another crucial layer of analysis. A broad-based risk-off move across equities, perhaps driven by geopolitical flare-ups like the escalating tensions surrounding Iran, could spill over into the SP500, regardless of its own internal technical strength. The fact that Nasdaq 100 and Dow Jones 30 are also facing their own technical challenges at key resistance levels suggests that the broader equity market sentiment is far from universally bullish. This interconnectedness means that a breakdown in one major index or asset class could easily trigger a domino effect across others.
Technical Levels and Chart Patterns: What the Charts Are Saying
Diving deeper into the SP500's technical landscape, the 1-hour chart presents a mixed picture. While the price is pushing towards resistance at $6,577.27, indicators like the RSI at 70.95 and the MACD histogram suggest waning momentum. The ADX reading of 49.72 on this timeframe indicates a strong trend, but the conflicting signals from momentum oscillators warrant caution. This suggests that any breakout above resistance might not be immediately sustained without further confirmation.
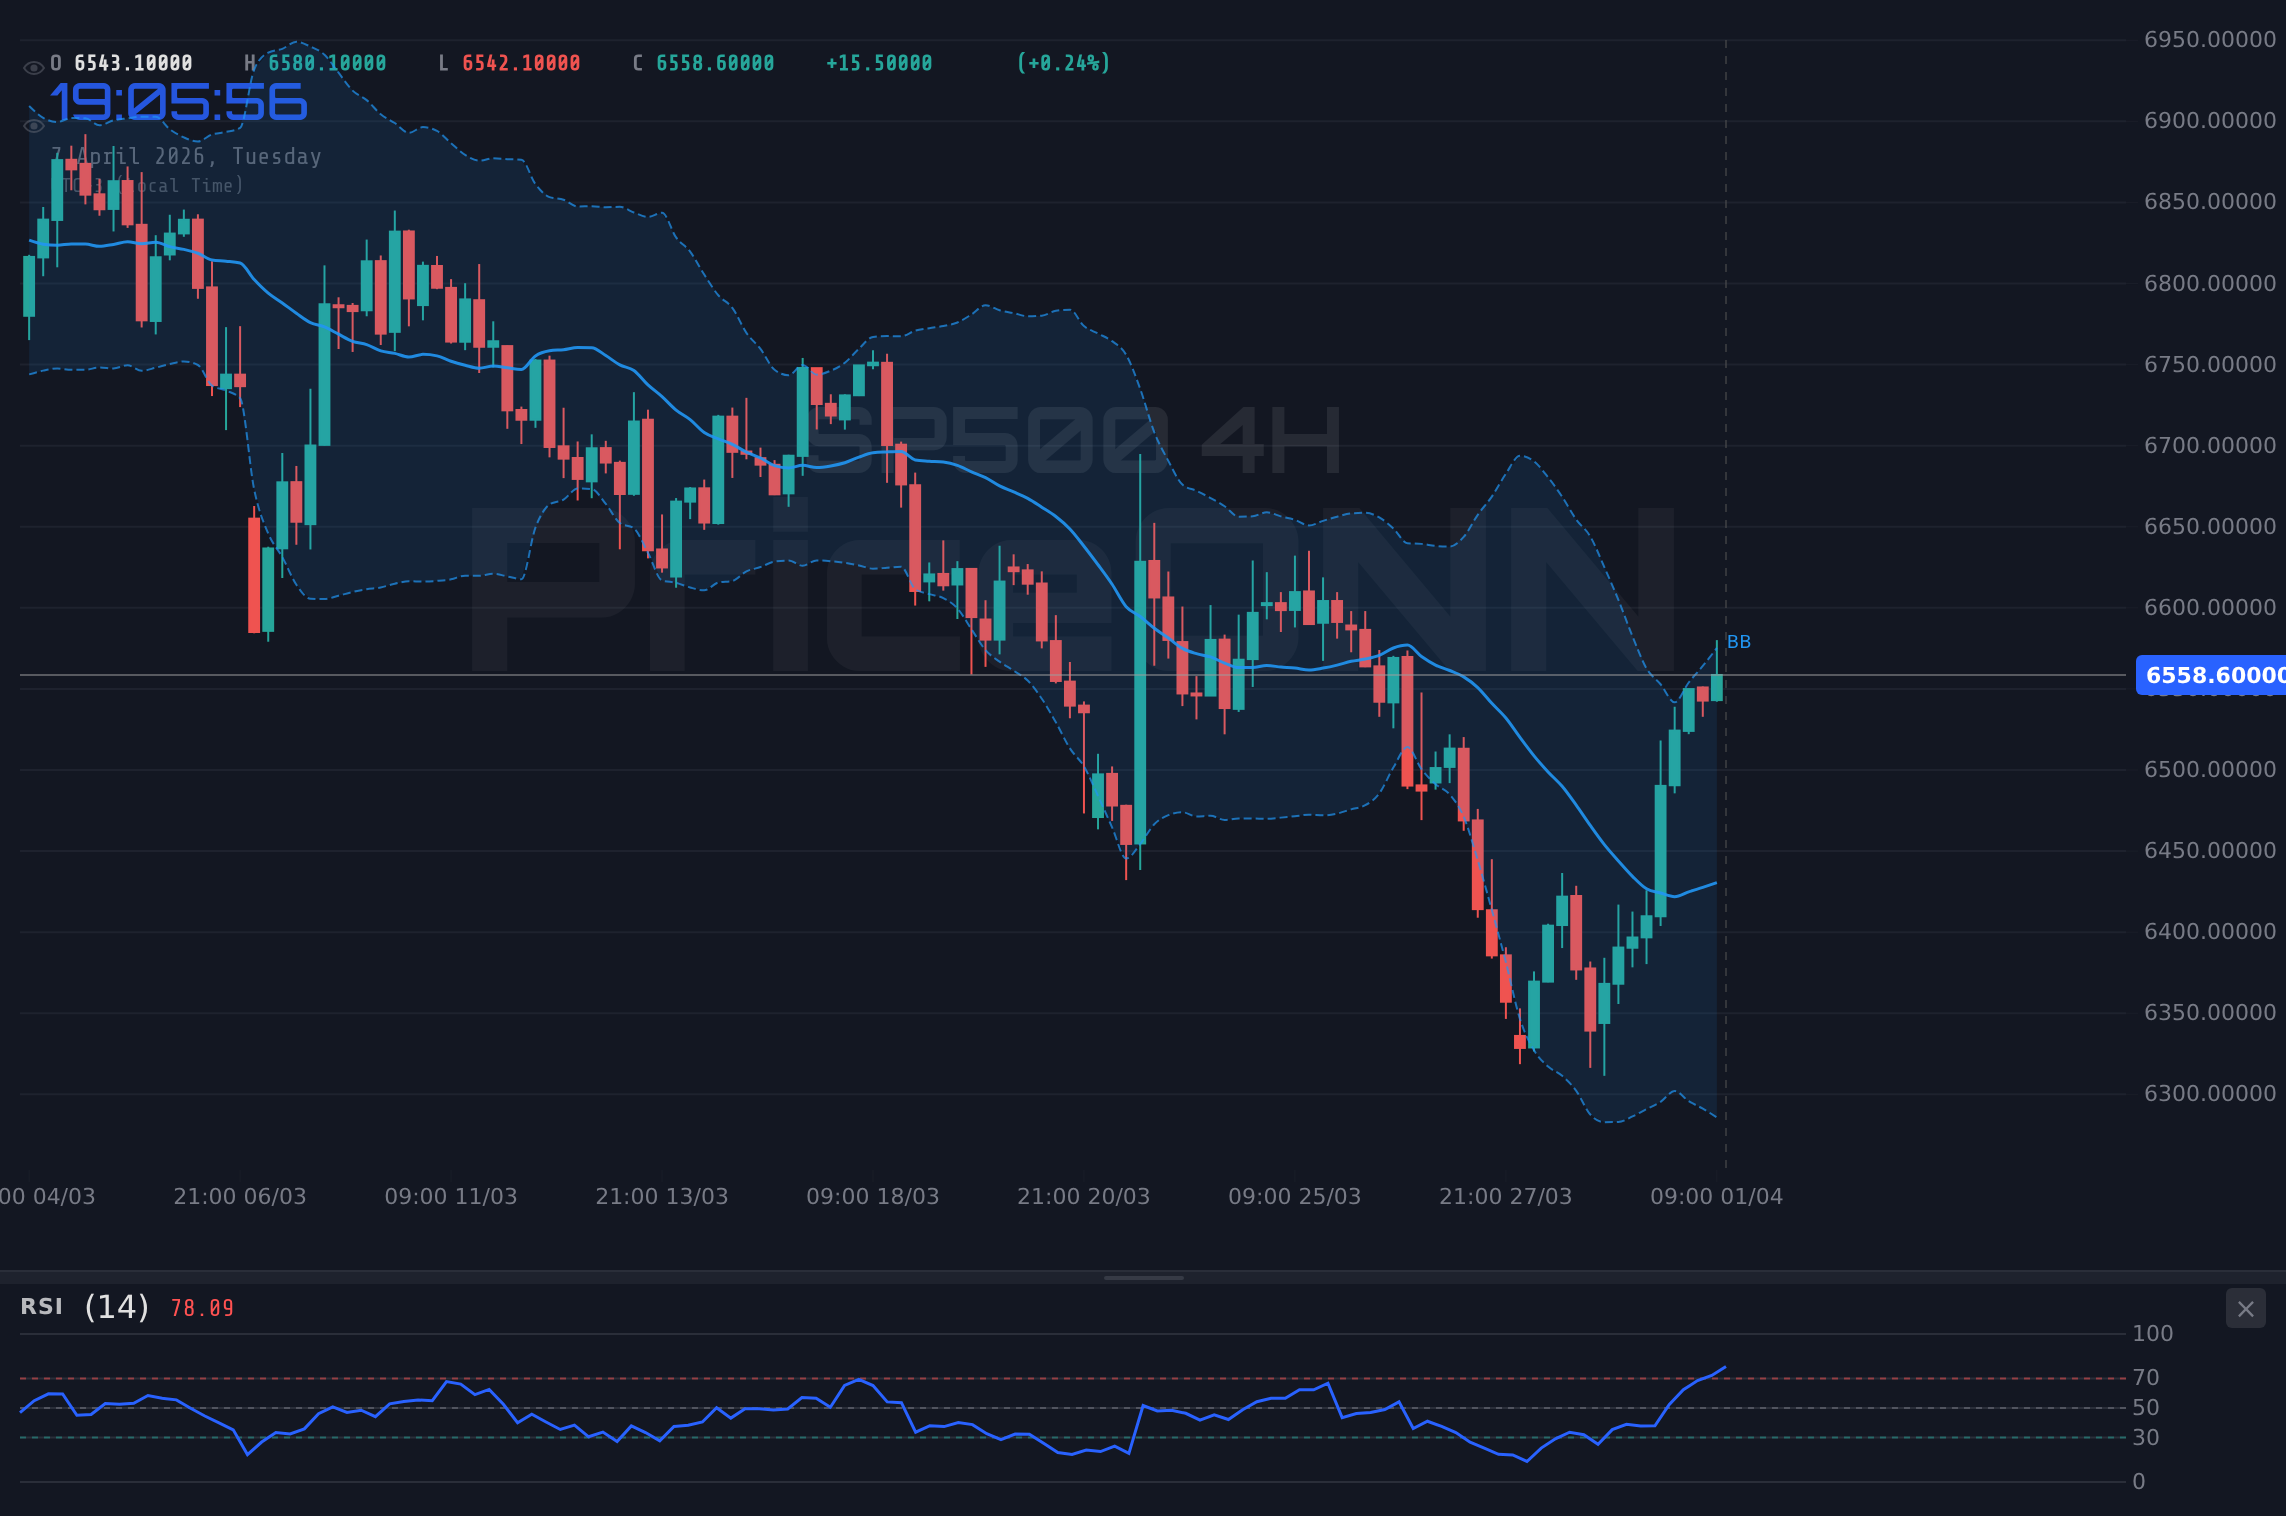
On the 4-hour chart, the trend is still neutral with a 50% strength, and the RSI at 62.83 remains in bullish territory but is not yet overbought. However, the Stochastic indicator is showing K=97.85 and D=86.96, firmly in overbought territory and indicating a potential reversal signal. The ADX at 24.23 suggests a moderate trend strength. This divergence between the daily trend and the shorter-term overbought signals on the 4-hour chart is a key point of analysis. It implies that while the longer-term trend might still be developing, the immediate path higher could face headwinds from profit-taking or a lack of fresh buying interest.
The daily chart paints an even more cautious picture, with the trend classified as 'Düşüş' (Bearish) with 100% strength. The RSI is at 45.35, indicating room for further downside before reaching oversold territory. The MACD is showing negative momentum below its signal line, and the ADX at 47.51 points to a strong downward trend. Despite this bearish daily outlook, the current price action is pushing against resistance. This creates a classic trading dilemma: do you fade the resistance based on the longer-term bearish trend, or do you bet on a potential breakout, acknowledging the short-term bullish signals? The answer often lies in risk management and waiting for clearer confirmation.
Trading Scenarios and Risk Management
Bearish Scenario: Resistance Holds Firm
65% ProbabilityConsolidation Scenario: Range-Bound Play
25% ProbabilityBullish Scenario: Breakout Confirmation
10% ProbabilityGiven the current technical setup and the anticipation surrounding economic data, the most probable scenario involves a period of consolidation or a bearish reaction if resistance at $6,577.27 holds. The 65% probability assigned to the bearish scenario reflects the overbought conditions on shorter timeframes and the strong daily downtrend signal from the ADX. However, a decisive breakout above resistance, though less probable at 10%, cannot be entirely dismissed, especially if economic data surprises to the upside or if geopolitical risks subside, fostering a broader risk-on sentiment. The neutral scenario, representing a 25% probability, acknowledges the market's current indecision as it awaits further catalysts.
Effective risk management is paramount in this environment. For those considering a bearish position, a stop-loss above the key resistance level of $6,577.27 would be prudent. Conversely, if a bullish breakout occurs, waiting for confirmation - such as a sustained close above resistance and a move out of overbought territory on the RSI - before entering long positions would be advisable. Strict adherence to predefined risk parameters, such as setting stop-loss orders at logical technical levels like S1 ($6,547.63) for potential downside targets or R1 ($6,568.73) for potential upside continuation, is crucial. The market always offers a second chance, and patience in waiting for a high-probability setup is often the most rewarding strategy.
Frequently Asked Questions: SP500 Analysis
What happens if SP500 fails to break above $6,577.27 resistance?
If the SP500 cannot decisively break above the $6,577.27 resistance level, a pullback is likely. The 1-hour RSI at 70.95 signals overbought conditions, suggesting potential profit-taking. In this bearish scenario, traders would look for support levels around $6,535.07 and $6,526.53.
Should I consider buying SP500 at current levels of $6,572.87 given the mixed signals?
Buying at current levels requires caution due to the proximity to resistance and conflicting short-term indicators. A more prudent approach would be to wait for a confirmed breakout above $6,577.27 with strong volume, or a bounce from a key support level like $6,535.07. The probability of further upside from current levels is estimated at 10% without further confirmation.
Is the RSI at 70.95 a sell signal for SP500 right now?
An RSI of 70.95 on the 1-hour chart indicates overbought conditions, which can precede a short-term pullback or consolidation. It's not a direct sell signal on its own but suggests that the upward momentum is slowing and traders should be wary of chasing the price higher without further confirmation.
How will upcoming jobs data impact SP500 this week?
Stronger-than-expected jobs data could lead the Fed to maintain a hawkish stance, potentially pressuring the SP500. Conversely, weaker data might boost hopes for Fed rate cuts, providing a tailwind for equities. The market's reaction will depend on how the data aligns with current Fed policy expectations, with significant volatility possible.
The path forward for the SP500 hinges on its ability to overcome the current resistance zone and the market's interpretation of upcoming economic data. While short-term indicators flash caution, the broader trend and the potential for shifts in Fed policy create a dynamic environment. As always, disciplined risk management and patience in waiting for clear trade setups are key. Volatility creates opportunity - those prepared will be rewarded.
| Indicator | Value | Signal | Interpretation |
|---|---|---|---|
| RSI (14) | 70.95 | Neutral | Overbought pressure on 1H, but within range on 4H/1D. |
| MACD Histogram | - | Bearish | Negative momentum on 1H, suggesting fading conviction. |
| Stochastic | K:97.85, D:86.96 | Bearish | Overbought on 4H, potential reversal signal. |
| ADX | 47.51 | Bullish | Strong trend indicated on Daily, but conflicting signals on shorter timeframes. |
| Bollinger | Upper Band | Watch | Price is testing upper band on 1H/4H, indicating potential resistance. |
Track markets in real-time
AI-powered analysis, technical indicators and real-time price data.
Join Our Telegram Channel
Breaking market news, AI analysis and trading signals instantly.
Join Channel