
DXY Hovers Near $99.65; ISM Data Looms as Traders Eye Inflation
The Dollar Index (DXY) is trading around $99.65 ahead of crucial ISM data. Traders are closely watching inflation signals and geopolitical tensions for direction.
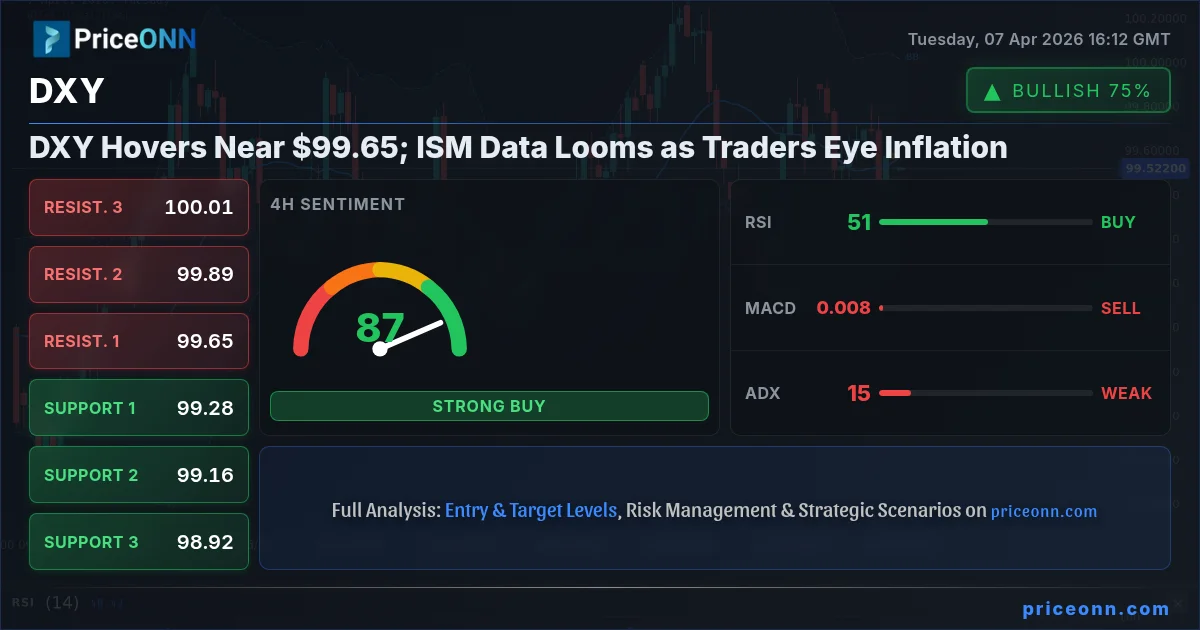
The US Dollar Index (DXY) is currently navigating a critical juncture, trading near the $99.65 mark as market participants brace for significant economic data releases and ongoing geopolitical developments. This delicate balance highlights the dollar's sensitivity to both domestic economic indicators and global risk sentiment, setting the stage for potential volatility in the short term. With the Federal Reserve's policy path hanging in the balance, every piece of incoming data and every geopolitical tremor is being scrutinized for clues about the dollar's next move.
- The DXY is trading at $99.65, with support at $99.43 and resistance at $99.65.
- RSI at 51.44 indicates a neutral momentum, while ADX at 16.78 suggests a weak trend.
- Upcoming ISM Manufacturing PMI data is a key catalyst for potential DXY price action.
- Geopolitical tensions in the Middle East are contributing to safe-haven demand, indirectly supporting the dollar.
The dollar's current positioning reflects a market caught between competing forces. On one hand, robust US economic data and the prospect of continued interest rate differentials have provided a floor for the greenback. On the other hand, resurfacing inflation fears and escalating geopolitical risks are creating a complex backdrop that could either bolster safe-haven demand or trigger a risk-off sentiment that impacts currency markets broadly. The interplay between these factors will be crucial in determining the DXY's trajectory in the coming days and weeks.
Navigating the Dollar's Tightrope Walk
The Dollar Index Today: A Snapshot at $99.65
Currently trading at $99.65, the DXY is treading water, reflecting a market that is neither fully risk-on nor risk-off. The 1-hour chart shows a neutral trend with a Power Strength of 50%, indicating a lack of strong directional conviction. Support is found at $99.43, followed by $99.32, while resistance looms at $99.65 and $99.75. The RSI(14) reading of 51.44 sits squarely in neutral territory, suggesting neither overbought nor oversold conditions, but a slight upward bias in momentum. However, the MACD is showing negative momentum, with the MACD line below the signal line, hinting at potential selling pressure on shorter timeframes. The ADX at 16.78 confirms the weak trend environment, suggesting that any moves might lack sustained follow-through until a clearer catalyst emerges.
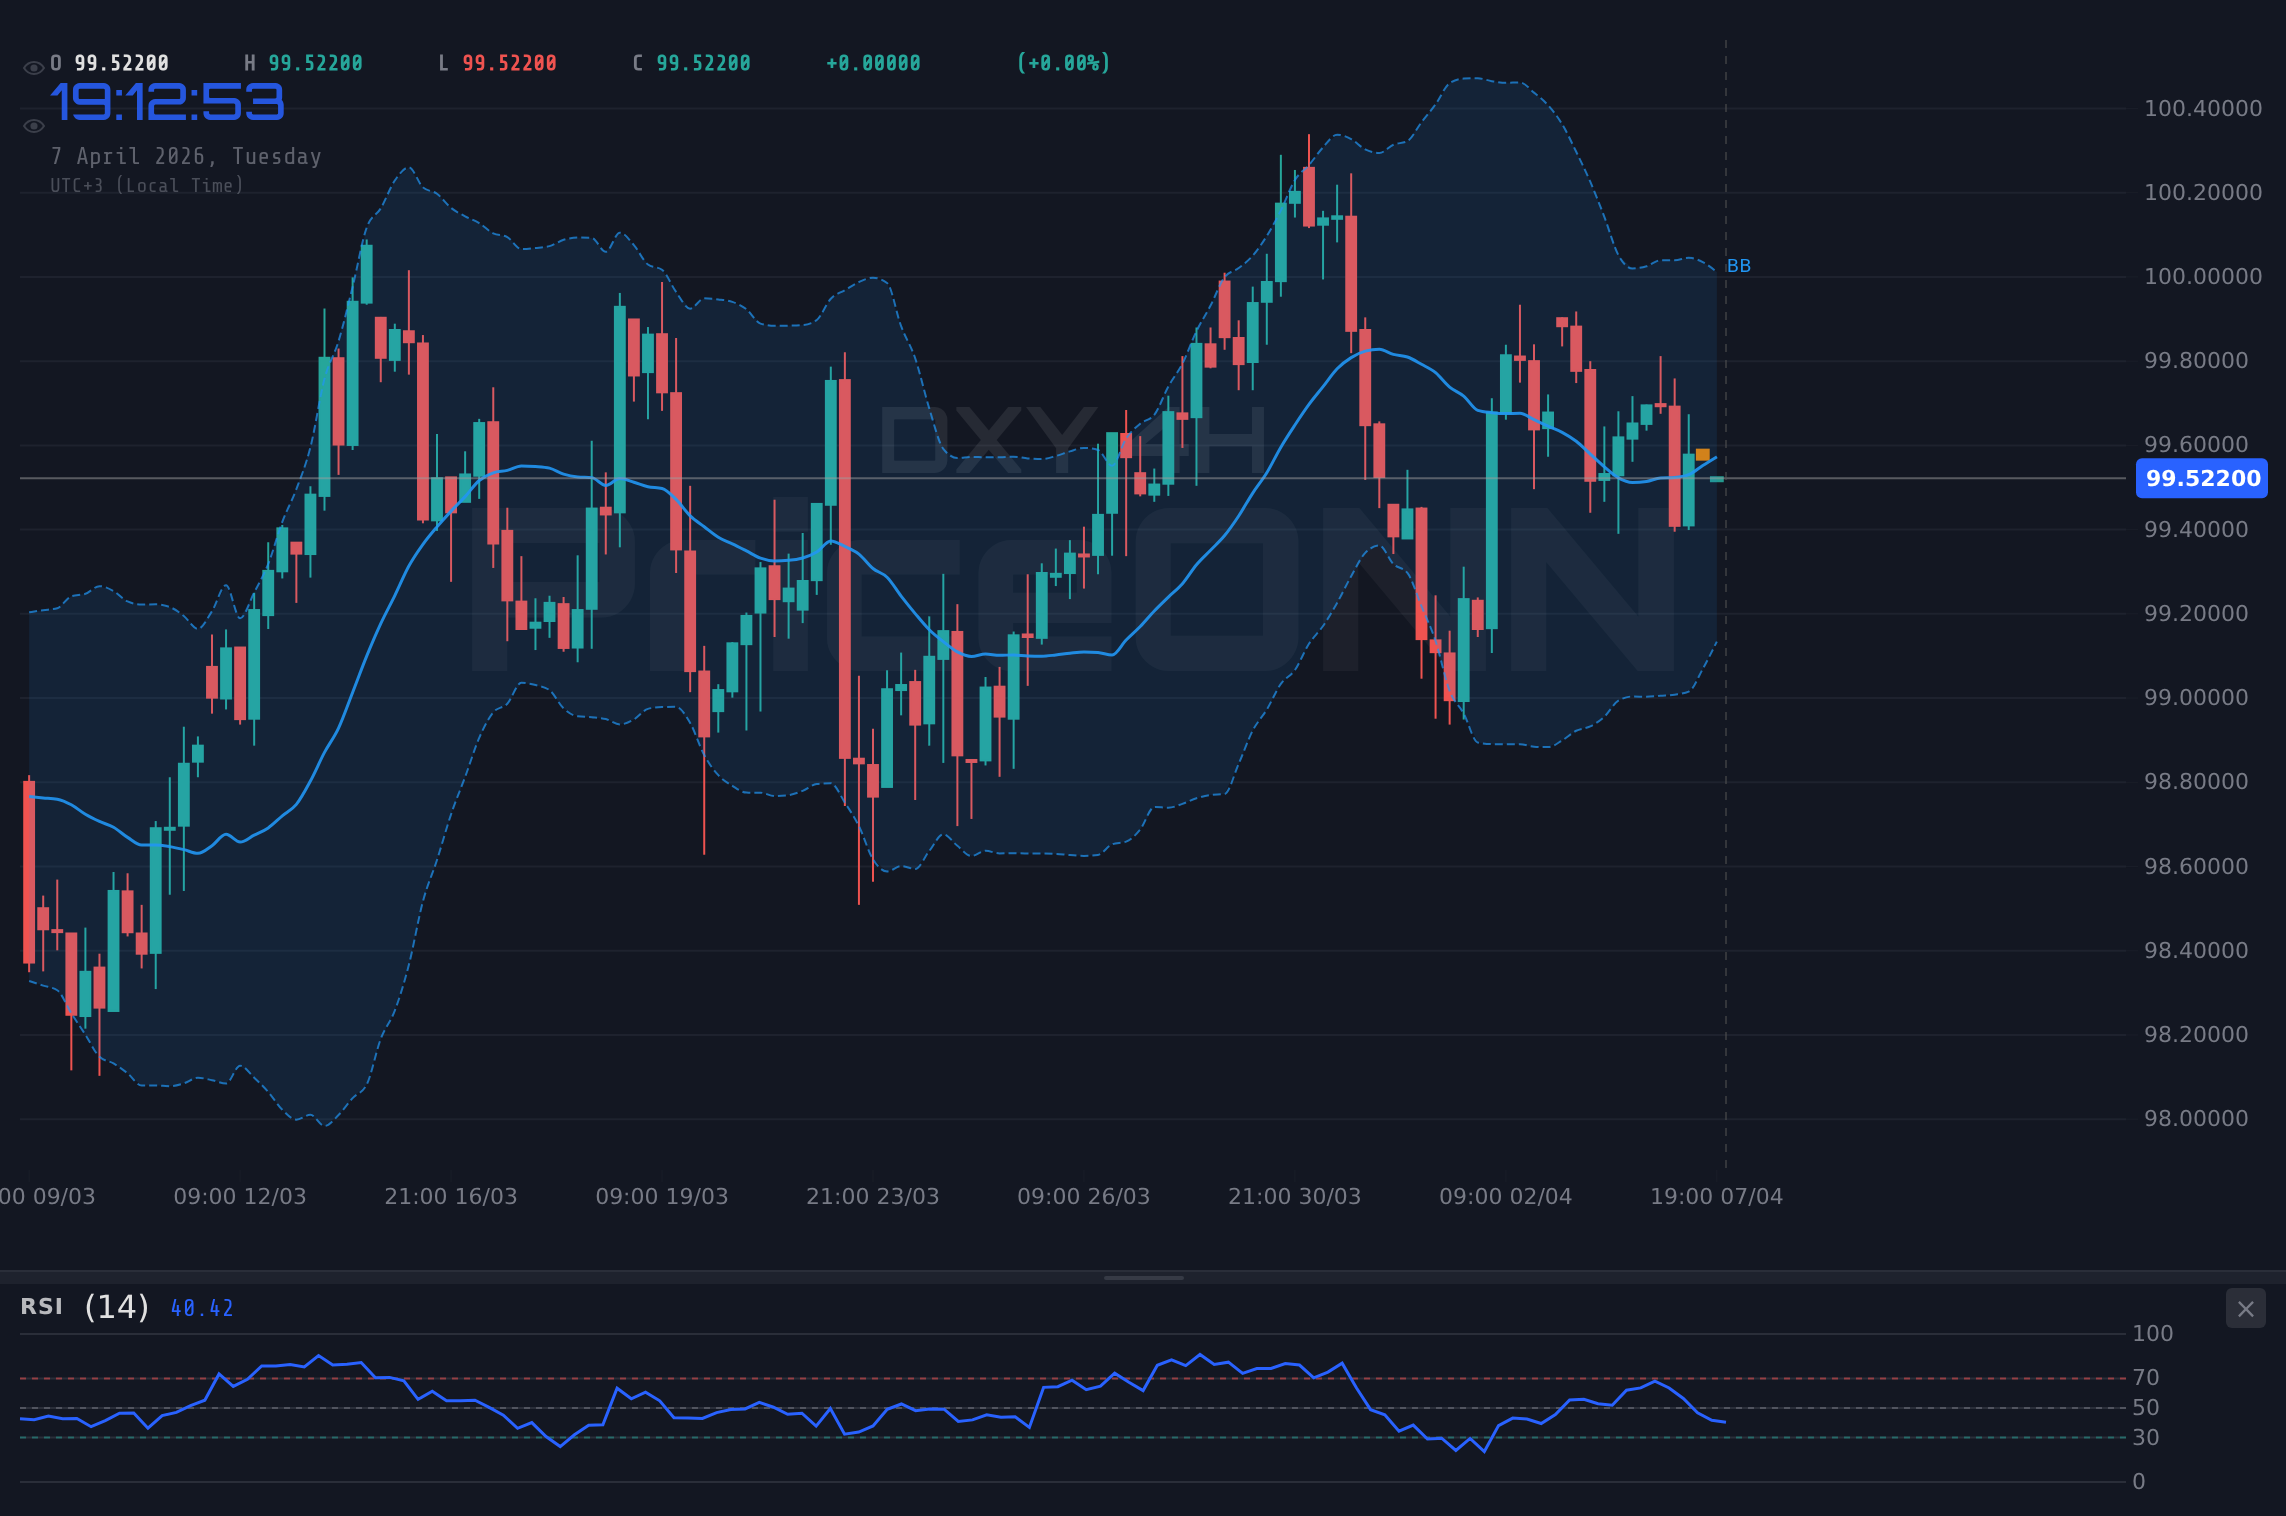
The 4-hour timeframe presents a similar picture, with a neutral trend and 50% power strength. Support levels are identified at $99.28 and $99.16, with resistance at $99.65 and $99.89. The RSI(14) at 51.25 continues to hover around the midpoint, offering little directional clarity. Stochastic indicators are showing a potential dip with %K at 36.43 and %D at 45.78, suggesting a possible short-term pullback. The ADX remains low at 15.29, reinforcing the idea of a range-bound market. This technical setup underscores the importance of upcoming economic data, particularly the ISM Manufacturing PMI, which could provide the necessary impetus to break this stalemate.
On the daily chart, the DXY exhibits a stronger upward trend with a Power Strength of 95%, yet the current price action suggests consolidation. Support at $99.39 and $99.13 are key levels to watch, while resistance is eyed at $99.92 and $100.18. The RSI(14) at 56.49 is in the upper half of the neutral zone, indicating a slightly bullish lean but far from overbought conditions. MACD is signaling negative momentum on this timeframe, which seems counterintuitive to the overall trend strength. Stochastic shows %K (59.79) above %D (65.52), a bearish crossover, which adds to the conflicting signals. The ADX at 29.17 suggests a strong trend is in place, but the mixed signals across different timeframes paint a picture of indecision.
The Looming Shadow of ISM Data
The most significant event on the immediate horizon for the DXY is the release of the ISM Manufacturing PMI data. This report is a critical gauge of the health of the US manufacturing sector and often has a substantial impact on currency markets. A reading significantly above the forecast of 56.1 could signal robust economic activity, bolstering the case for the Federal Reserve to maintain its hawkish stance or even consider further tightening, which would likely send the DXY higher. Conversely, a disappointing figure, especially if it falls below the previous reading of 63, could raise concerns about economic slowdown and prompt a reassessment of Fed policy, potentially leading to a dollar sell-off.
Traders will be parsing the details within the ISM report, looking beyond the headline number. Components such as the New Orders Index, Employment Index, and Prices Paid Index can offer deeper insights into underlying economic pressures. For instance, if the Prices Paid Index shows a significant uptick, it could reignite inflation concerns, which might paradoxically support the dollar if it leads to expectations of continued tight monetary policy. However, if new orders and employment figures falter, it could signal broader economic weakness, overshadowing any inflation-related concerns and pressuring the dollar downwards. The current neutral technical setup on the DXY means it is highly susceptible to the outcome of this data release.
The market's reaction to the ISM data will likely be amplified by the current geopolitical backdrop. Escalating tensions in the Middle East, as reported by Forex news outlets, have already injected a degree of uncertainty into global markets. While these events can sometimes boost the dollar as a safe-haven asset, they also carry the risk of disrupting global supply chains and impacting energy prices, which could indirectly fuel inflation and complicate the Federal Reserve's policy decisions. The conflicting signals from the DXY's technical indicators - a strong daily trend versus weaker short-term momentum - suggest that any data-driven move could be met with significant profit-taking or reversal if geopolitical risks escalate further.
Correlation and Intermarket Dynamics
The Dollar's Dance with Global Risk
The DXY's performance is intrinsically linked to global risk sentiment. In times of heightened geopolitical tension, such as the current situation involving Iran, investors often flock to the perceived safety of the US dollar, driving the DXY higher. Forex news suggests that USD/JPY has already broken past 160.00 this week, partly fueled by these fears and robust US economic data. This inverse correlation is a key dynamic for traders to monitor. However, the relationship is not always straightforward. If a geopolitical event leads to a sharp spike in oil prices, as seen with Brent crude trading around $112.19, it can also spark inflation fears. This could complicate the Federal Reserve's stance, creating uncertainty that might lead to choppier dollar movements rather than a clear directional trend.
The performance of major equity indices like the S&P 500 and Nasdaq also provides crucial context. The S&P 500 is currently trading near 6572.87, showing some resilience, while the Nasdaq has seen a dip to 23987.56. A sustained decline in these riskier assets would typically increase demand for the dollar as a safe haven. Conversely, if equities continue to rally, it might suggest a 'risk-on' environment where investors are less inclined to hold the dollar, potentially leading to its weakening. The current mixed signals from the stock markets, with the S&P 500 showing a daily uptrend and Nasdaq showing a daily downtrend, add another layer of complexity to the DXY's outlook. The ADX on the DXY's daily chart at 29.17 indicates a strong trend, but the conflicting signals across timeframes suggest this trend might be tested.
Commodities and Inflationary Pressures
Commodities, particularly gold (XAUUSD currently at $4656.91) and oil (Brent at $112.19), serve as important barometers for inflation expectations and geopolitical risk. A surge in gold prices, often seen as an inflation hedge and a safe-haven asset, can sometimes occur concurrently with a rising DXY if the underlying driver is global uncertainty. However, typically, a stronger dollar tends to put downward pressure on dollar-denominated commodities like gold. The current technical picture for gold shows a mixed signal: a falling trend on the 1H and 4H charts, but a neutral trend on the daily chart with RSI at 45.1. This suggests that while short-term momentum might be bearish, the longer-term picture is less clear, and gold's reaction to DXY movements will depend heavily on the prevailing risk sentiment.
Oil prices, influenced by supply-side concerns and geopolitical events, have a direct impact on inflation. If oil prices remain elevated or surge further, it could contribute to sticky inflation, forcing the Federal Reserve to maintain a tighter monetary policy. This would generally be supportive of the DXY. However, extremely high energy prices can also dampen global economic growth, potentially creating a scenario where even a strong dollar struggles to find buyers. The current strong bullish trend in WTI oil (trading at $115.06) and Brent oil suggests that energy markets are pricing in supply constraints or geopolitical risk premiums, which could translate into inflationary pressures that the Fed will need to address.
Looking Ahead: The DXY's Path Forward
The immediate future for the DXY appears to be heavily influenced by the upcoming ISM Manufacturing PMI data. A strong reading could solidify the dollar's uptrend, potentially pushing it towards the $99.92 resistance level, and even challenging the $100 mark. This scenario would be further reinforced if geopolitical tensions continue to simmer, maintaining safe-haven flows. On the other hand, a weak data print, coupled with any de-escalation in global conflicts, could trigger a correction. In such a case, the $99.39 support level would be the first point of test, with a decisive break below it opening the door for a move towards $99.13.
The conflicting technical signals across different timeframes add to the uncertainty. While the daily chart shows a strong upward trend, the shorter-term 1-hour and 4-hour charts exhibit weaker momentum and mixed indicators. This suggests that the market is in a holding pattern, waiting for a decisive catalyst. The ADX readings, particularly the strong 29.17 on the daily chart, imply that when a trend does emerge, it could be substantial. However, the low ADX values on shorter timeframes (16.78 and 15.29) indicate a lack of conviction in the immediate price action. Therefore, traders should exercise caution and wait for confirmation, perhaps a clear break above resistance or a decisive fall below support, before committing to a significant position.
Scenario Analysis: What Could Happen Next?
Bullish Scenario: Dollar Strength Persists
40% ProbabilityNeutral Scenario: Range-Bound Consolidation
50% ProbabilityBearish Scenario: Dollar Weakens on Data Disappointment
10% ProbabilityFrequently Asked Questions: DXY Analysis
What happens if the DXY breaks above the $99.92 resistance level?
A sustained break above $99.92, especially if confirmed by strong ISM data, would likely target the $100.18 psychological level. This would signal increasing dollar strength, potentially driven by hawkish Fed expectations or escalating global risks.
Should I buy DXY at current levels near $99.65 given the mixed signals?
Buying at current levels carries risk due to conflicting technical signals across timeframes. A more prudent approach would be to wait for confirmation, such as a clear break above $99.92 resistance or a decisive drop below $99.39 support, aligning with a high-probability setup.
Is the RSI at 51.44 a buy or sell signal for the DXY right now?
An RSI reading of 51.44 is in neutral territory and does not provide a clear buy or sell signal on its own. It indicates a lack of strong momentum, suggesting that the market is waiting for further catalysts. Confirmation from other indicators and price action is needed.
How might upcoming ISM data affect the DXY this week?
Strong ISM data could boost the DXY towards $100.18 by reinforcing expectations of tighter monetary policy. Conversely, weak data could lead to a pullback towards $99.39 as traders reassess the economic outlook and Fed policy.
Track markets in real-time
AI-powered analysis, technical indicators and real-time price data.
Join Our Telegram Channel
Breaking market news, AI analysis and trading signals instantly.
Join Channel