
ETHUSD Tests $2,071.63 Support: Will Geopolitical Tensions Fuel a Rebound?
ETHUSD hovers near $2,081.52, testing critical support at $2,071.63 amidst rising geopolitical tensions and an uncertain Fed outlook. Can safe-haven flows offer a reprieve?
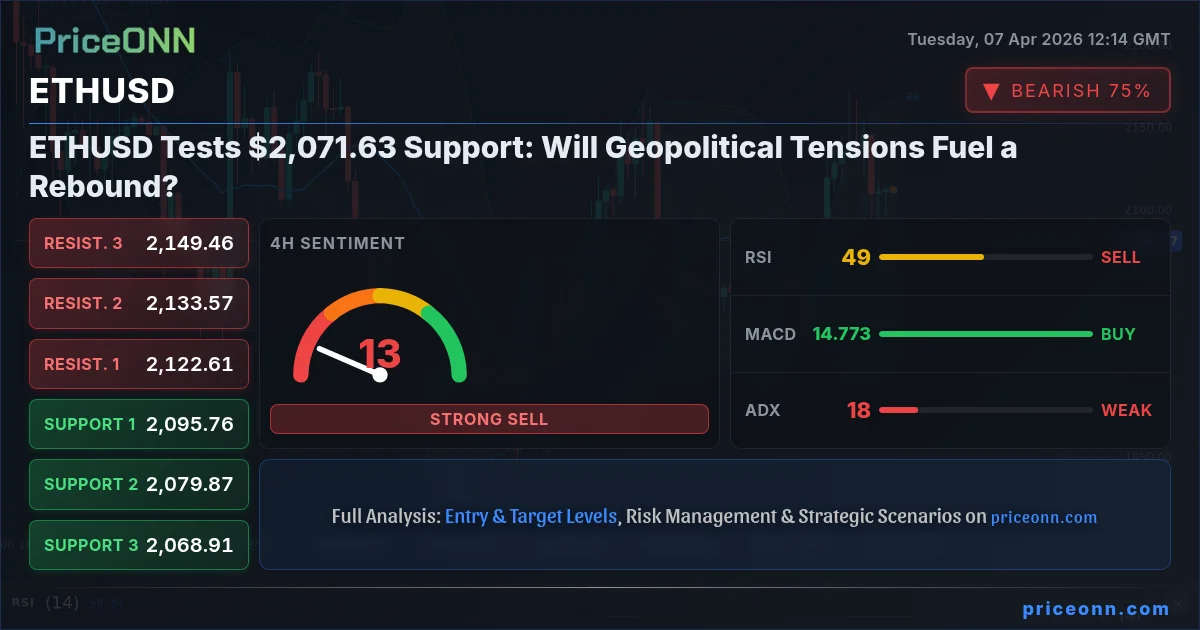
ETHUSD is currently trading at $2,081.52, finding itself at a pivotal juncture as it tests the crucial support level at $2,071.63. This level, representing a significant floor tested multiple times in recent trading sessions, now becomes the focal point for traders and analysts alike. The cryptocurrency market, often sensitive to broader macroeconomic shifts and risk sentiment, is navigating a complex landscape defined by escalating geopolitical tensions, particularly concerning Iran and the Strait of Hormuz, and persistent inflation signals that keep the Federal Reserve's future policy path shrouded in uncertainty. As the DXY Dollar Index shows signs of renewed strength, and major equity indices like the S&P 500 and Nasdaq exhibit volatility, the question on many minds is whether ETHUSD can hold its ground or if further downside is imminent. This analysis delves into the multi-faceted dynamics influencing ETHUSD, exploring potential scenarios and the critical triggers that will shape its trajectory in the coming days and weeks.
- ETHUSD is currently testing key support at $2,071.63, with its current price at $2,081.52.
- The ADX at 18.14 indicates a weak trend, suggesting choppy market conditions rather than a clear directional move.
- RSI at 48.23 on the 1H chart shows a slight downward bias, while the 4H RSI at 51.44 remains neutral, reflecting indecision.
- Geopolitical tensions and DXY strength are creating headwinds, while a strong upward trend in WTI and Brent crude oil prices signals potential inflation persistence.
The Bull's Roadmap: Navigating the $2,071.63 Lifeline
A Bounce from the Brink?
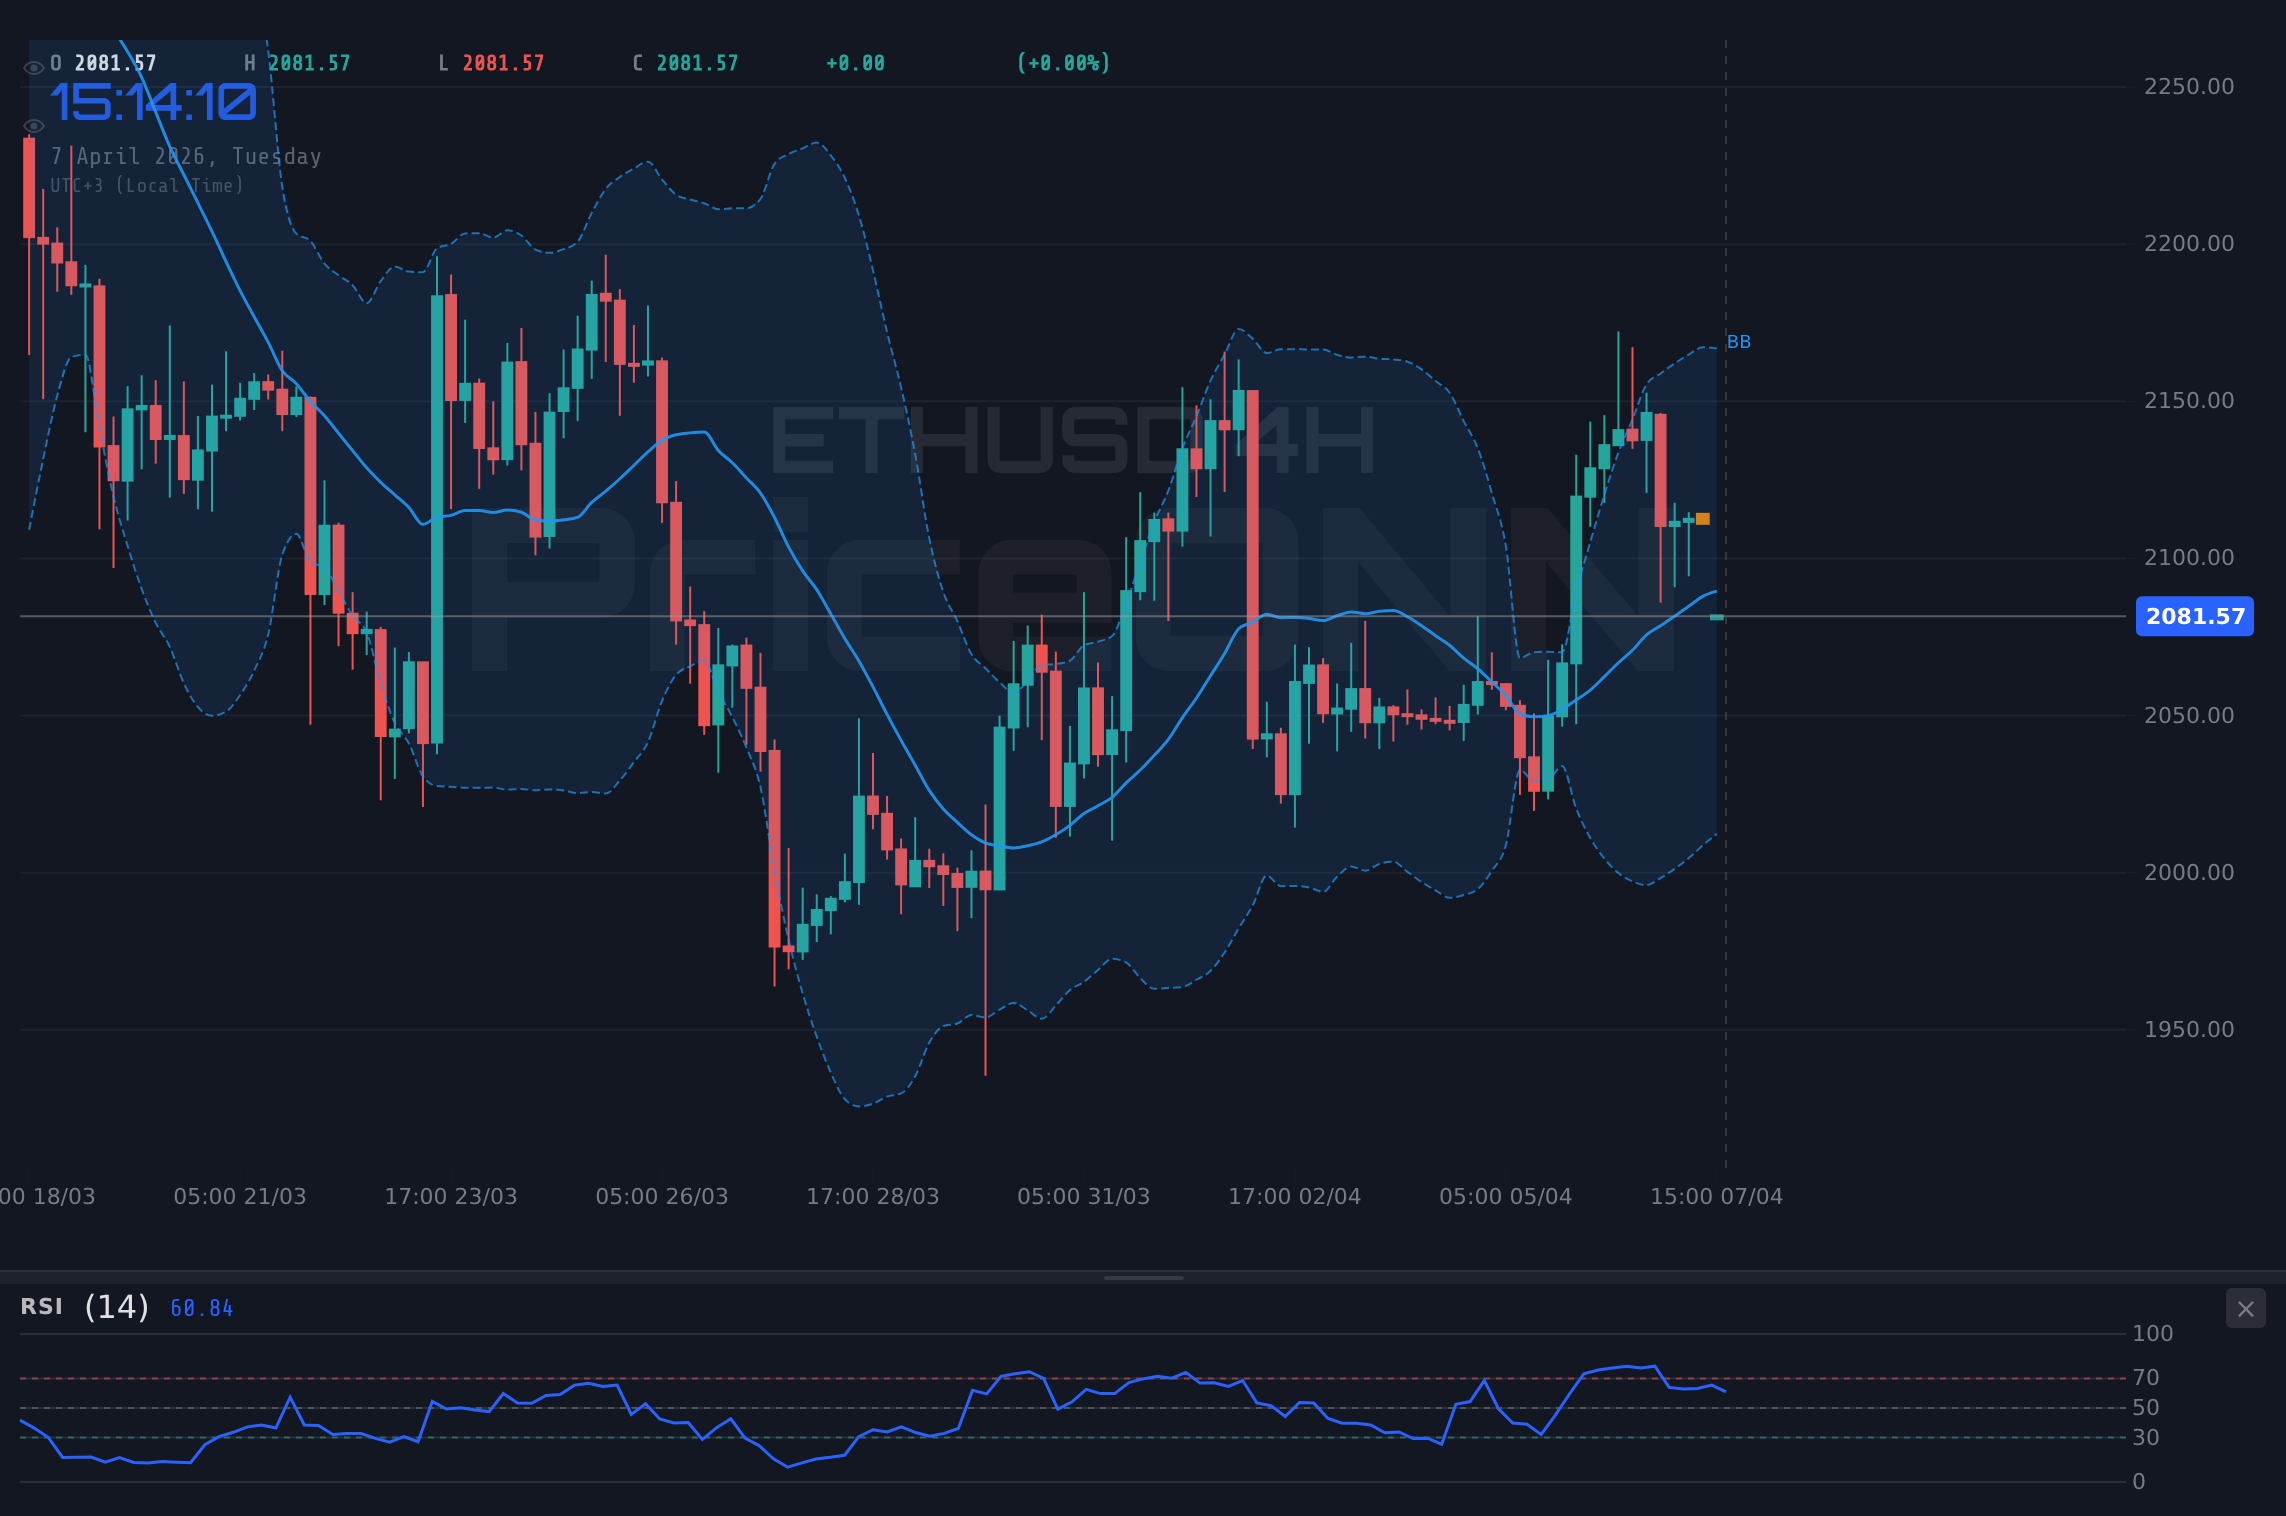
For ETHUSD to stage a meaningful recovery, holding the $2,071.63 support is paramount. This level has acted as a significant psychological and technical barrier, and a decisive break below it would signal a bearish continuation. However, if buyers can step in here, the immediate path upward would target the $2,116.49 resistance. This level, representing the upper band of the Bollinger Bands on the 1-hour chart and a key pivot from recent price action, would be the first hurdle. A sustained push above $2,116.49, ideally with increasing volume and positive momentum indicators, could then set the stage for a retest of the $2,145.77 resistance. This latter level is critical; breaking it would suggest a potential shift in short-term sentiment and could open the door for a move towards the $2,162.35 mark, aligning with the 4-hour chart's upper Bollinger Band. The overall bullish thesis hinges on ETHUSD carving out a higher low above $2,071.63 and subsequently reclaiming key moving averages. The strength of the dollar, as indicated by the DXY currently trading around 99.74, remains a headwind, as a stronger dollar typically correlates with weaker cryptocurrency prices. However, if geopolitical anxieties escalate significantly, the 'risk-off' sentiment could paradoxically benefit Bitcoin and Ethereum as alternative assets, though this is a less probable short-term driver given the current technical signals.
Indicator Confluence for a Bullish Turn
Looking at the technical indicators, a bullish turnaround would ideally be confirmed by a confluence of positive signals. On the 1-hour timeframe, while the RSI is currently at 40.41 and showing a downward tendency, a move back above 50 would be the first sign of returning bullish momentum. Similarly, the MACD, though exhibiting negative momentum, is still above its signal line, offering a sliver of hope for a short-term bounce. The Stochastic oscillator, with K at 36.23 and D at 44.5, is in oversold territory, suggesting potential for a reversal upwards. A cross back above 50 for both lines would strengthen this view. The ADX at 22.11, however, points to a moderate trend strength, indicating that any upward move might face headwinds and could be prone to ranging behavior. On the 4-hour chart, the picture is slightly more mixed, with RSI at 51.44 and MACD showing positive momentum. The Stochastic lines (K=46.66, D=72.64) are in a bearish configuration, but the fact that they are not in extreme overbought territory leaves room for upside. A break above the 4-hour middle Bollinger Band would be a crucial confirmation. The daily chart, while showing a neutral trend (ADX 17.12), has a Stochastic showing an upward signal (%K > %D), which could be a longer-term positive if sustained. The key is to see these shorter-term indicators align with a sustained hold above $2,071.63 and then a decisive break of resistance levels.
Where Bears Take Control: The $2,071.63 Breakdown Scenario
The Downside Risk: A Slippery Slope
The bearish scenario for ETHUSD is predicated on a failure to hold the $2,071.63 support level. If selling pressure intensifies, driven by broader market fear, a liquidation cascade, or negative news flow, the price could rapidly descend. The first significant downside target would be the $2,054.05 level, which represents a support point seen in the 1-hour timeframe. A break below this could then target the $2,024.77 level, a more substantial psychological and technical floor. On the daily chart, further down, support levels are seen at $1,996.96 and $1,946.65. A decisive close below $2,071.63, particularly on increasing volume, would invalidate any near-term bullish outlook and suggest a continuation of the downtrend. The ADX on the 1-hour chart at 22.11 suggests moderate trend strength, which could accelerate if a breakdown occurs. The 1-day ADX at 17.12 is weak, but this often precedes significant moves once a clear trend emerges. The correlation with the DXY Dollar Index is crucial here; if the dollar continues its ascent towards the 100.00 mark, driven by safe-haven demand amidst geopolitical turmoil, it would likely exert downward pressure on ETHUSD.
The Bearish Indicator Alignment
A bearish confirmation would involve several technical indicators aligning to signal further downside. On the 1-hour chart, a decisive break below the $2,071.63 support would likely be accompanied by the RSI falling further below 40, indicating strengthening bearish momentum. The MACD, if it crosses below its signal line after a period of negative momentum, would reinforce the bearish signal. The Stochastic oscillator, with both lines moving lower and staying below 50, would confirm the downward bias. On the 4-hour chart, a break below the middle Bollinger Band would be a strong bearish signal, especially if the RSI dips below 50 and the MACD histogram turns more negative. The daily chart's overall trend is neutral, but the ADX at 17.12 is low, meaning a breakdown could quickly establish a strong trend. If the broader market sentiment turns decidedly risk-off, as suggested by a sharp decline in indices like the S&P 500 (currently around 6572.87, but showing volatility) or Nasdaq (trading around 24012.5, also volatile), capital might flee riskier assets like cryptocurrencies. The rising oil prices (Brent at $114.12, WTI at $116.42) are a double-edged sword; they signal inflation concerns that could keep Fed rates higher for longer, potentially hurting risk assets, but also reflect geopolitical risk which can sometimes drive capital into gold, but not always into crypto.
The Waiting Game: Consolidation and Uncertainty
Caught Between Levels
A neutral scenario for ETHUSD would involve the price consolidating within a defined range, likely between the $2,071.63 support and the $2,116.49 resistance. This indecisive phase often occurs when market participants are awaiting clearer direction from macroeconomic data, central bank signals, or significant geopolitical developments. During such periods, technical indicators tend to provide mixed signals, reflecting the tug-of-war between buyers and sellers. For instance, the 1-hour RSI might hover around the 50 mark, while the 4-hour RSI could fluctuate between 45 and 55. The ADX across timeframes would likely remain subdued, generally below 20-25, confirming the lack of a strong trend. Trading volumes might also decrease during consolidation, indicating a lack of conviction from market participants. This phase can be frustrating for traders seeking clear directional opportunities, but it also presents range-trading possibilities for those adept at identifying support and resistance boundaries. The key here is the absence of a catalyst strong enough to break the stalemate. Upcoming economic data from the US, such as inflation figures or employment reports (though not explicitly listed with dates in the provided calendar, their influence is constant), and the Fed's communication will be critical in shaping sentiment. Any significant geopolitical escalation or de-escalation could also act as a catalyst, pushing ETHUSD decisively out of its range.
The Neutral Indicator Landscape
In a consolidation scenario, expect to see conflicting signals from various indicators. The 1-hour Stochastic might oscillate between oversold and overbought territory without establishing a clear trend, with K and D lines frequently crossing. The MACD could generate small, short-lived signals above and below its signal line, indicating choppy price action rather than sustained momentum. On the daily timeframe, the ADX of 11.74 strongly suggests a lack of trend, reinforcing the possibility of a sideways market. The Bollinger Bands might narrow, signaling lower volatility, which is typical of consolidation phases. While the daily Stochastic shows an upward signal (%K > %D), this could be a false positive in a range-bound market, especially if the price remains capped by resistance around $2,116.49. The key takeaway from a neutral scenario is that neither bulls nor bears have a clear advantage, and the market is essentially waiting for an external shock or a clear technical breakout to dictate the next major move. The correlation with the broader market becomes even more critical in this phase; if SP500 and Nasdaq show similar indecision, it would further support the consolidation thesis for ETHUSD.
The Most Likely Path: A Probabilistic View
Weighing the Evidence
Considering the current market environment and technical setup, the most probable scenario for ETHUSD in the short to medium term appears to be a continuation of consolidation with a slight bearish bias, leaning towards a potential breakdown. The ADX readings across all timeframes (1H: 22.11, 4H: 24.65, 1D: 17.12) indicate weak to moderate trend strength, with the daily being particularly subdued. This suggests that the market is not yet committed to a strong directional move. However, the immediate test of the $2,071.63 support is a significant bearish signal. While the 1-hour RSI (40.41) and 4-hour RSI (51.44) show some divergence, the overall sentiment seems to be favoring caution. The persistent strength of the DXY (currently around 99.74) and the elevated oil prices (Brent $114.12, WTI $116.42) contribute to a macro backdrop that is generally unfavorable for risk assets like cryptocurrencies, unless geopolitical fears trigger a flight to perceived safe havens that include crypto. The fact that the 1-hour and 1-day charts are showing 'SELL' signals across multiple indicators, despite the 4-hour chart offering some 'BUY' signals, suggests that downward pressure might be building more significantly on shorter timeframes. Therefore, a breakdown scenario carries a higher probability than a sustained bullish reversal from current levels. The potential for a 'stop hunt' below $2,071.63 before any potential bounce cannot be ruled out either. The probability leans towards a bearish outcome if $2,071.63 fails, but the lack of strong trend (low ADX) suggests this might be a choppy decline rather than a sharp crash, at least initially.
Probability Estimate: Bearish Consolidation Dominates
Assigning probabilities, the most likely scenario is a period of consolidation that ultimately breaks to the downside. I would assign a 55% probability to a bearish consolidation scenario, where ETHUSD might briefly bounce off $2,071.63 but struggles to reclaim higher ground, eventually succumbing to selling pressure. A further 30% probability is assigned to a neutral consolidation, where ETHUSD trades sideways between $2,071.63 and $2,116.49, awaiting clearer signals. A genuine bullish reversal scenario, where ETHUSD decisively breaks above resistance and establishes a new uptrend, is assigned a lower probability of 15% at this juncture, primarily due to the prevailing macro headwinds and mixed technical signals across different timeframes. The key to a bullish scenario would be a sustained close above $2,116.49, confirmed by strong volume and positive momentum divergence across multiple timeframes, something not currently evident. The current market structure, characterized by weak trends (low ADX) and conflicting indicator signals, favors a cautious approach, with the downside risk appearing more pronounced than the immediate upside potential.
What I'm Watching: Key Triggers for ETHUSD
The Critical Levels to Monitor
In the immediate short term, my focus is on ETHUSD's interaction with the $2,071.63 support level. A clear break and sustained close below this mark, particularly on the 1-hour or 4-hour charts, would be the primary bearish trigger, likely initiating a move towards $2,054.05. Conversely, a strong rebound from $2,071.63, coupled with a decisive break and hold above the $2,116.49 resistance, would serve as a bullish trigger, suggesting a potential shift in sentiment and a move towards higher targets. It's also crucial to monitor the DXY Dollar Index. If it breaks decisively above the 100.00 level, driven by geopolitical fears, this would increase the probability of further downside for ETHUSD. Conversely, any sign of de-escalation in the Middle East or dovish signals from the Fed could weaken the dollar and provide a tailwind for cryptocurrencies.
The Macroeconomic Pulse
Beyond the immediate price action, I'll be watching for any significant shifts in macroeconomic narratives. Persistent inflation fears, signaled by high oil prices and potentially re-accelerating US inflation data, could keep the Fed on hold or even leaning hawkish, which is generally negative for risk assets. Any hints of a Fed pivot or a significant slowdown in US economic data could, however, spark a risk-on rally. The correlation between ETHUSD and major equity indices like the S&P 500 and Nasdaq is also key; a sustained selloff in equities would likely drag ETHUSD lower, while a recovery in stocks could offer some support. The interplay between these various factors - geopolitics, Fed policy expectations, dollar strength, and equity market sentiment - will ultimately dictate ETHUSD's path.
Bearish Scenario: Breakdown Below Support
55% ProbabilityNeutral Scenario: Range-Bound Indecision
30% ProbabilityBullish Scenario: Reclaiming Key Levels
15% ProbabilityFrequently Asked Questions: ETHUSD Analysis
What happens if ETHUSD breaks below the $2,071.63 support level?
A breakdown below $2,071.63 would invalidate the current support and could trigger a move towards $2,054.05, followed by $2,024.77. This scenario is heightened by the current geopolitical tensions and a potentially strengthening DXY.
Is RSI at 48.23 a sell signal for ETHUSD right now?
An RSI of 48.23 on the 1-hour chart indicates a slight bearish bias, suggesting downward momentum is present but not yet overwhelming. It's not a definitive sell signal on its own but contributes to the bearish case if price action confirms it.
How will the current geopolitical tensions affect ETHUSD this week?
Escalating geopolitical tensions could increase risk-off sentiment, potentially pressuring ETHUSD if it's seen as a risk asset. However, in extreme scenarios, crypto might act as a safe haven, though this is less likely than dollar strength dominating. The key is monitoring DXY movements.
Should I consider buying ETHUSD at current levels near $2,081.52 given the weak ADX?
With the ADX around 17-24 across timeframes, the trend is weak, suggesting choppy conditions. Buying at current levels carries risk without a clear bullish trigger; waiting for price to hold above $2,071.63 and break resistance at $2,116.49 would offer a more defined setup.
Technical Outlook Summary
| Indicator | Value | Signal | Interpretation |
|---|---|---|---|
| RSI (14) | 48.23 | Neutral | Slight bearish bias on 1H, neutral on 4H. Needs to hold above 50 for bullish confirmation. |
| MACD Histogram | -0.64 | Bearish | Negative momentum persists on 1H, but positive on 4H. Watching for cross-overs. |
| Stochastic | K=32.49, D=47.68 | Bearish | Oversold on 1H, suggesting potential bounce, but bearish configuration on 4H. |
| ADX | 17.12 | Weak Trend | Lack of strong trend across timeframes indicates consolidation or choppiness. |
| Bollinger | Middle Band | Watch | Price is below the middle band on 1H and 1D, suggesting overhead resistance. |
Key Levels
Track markets in real-time
AI-powered analysis, technical indicators and real-time price data.
Join Our Telegram Channel
Breaking market news, AI analysis and trading signals instantly.
Join Channel