
Gold Hovers Near $4,660; Bulls Eye Resistance Amid Mixed Signals
Gold trades around $4,660.84, caught between conflicting technical indicators and geopolitical uncertainty. Bulls target resistance at $4,704, while bears watch support at $4,598.
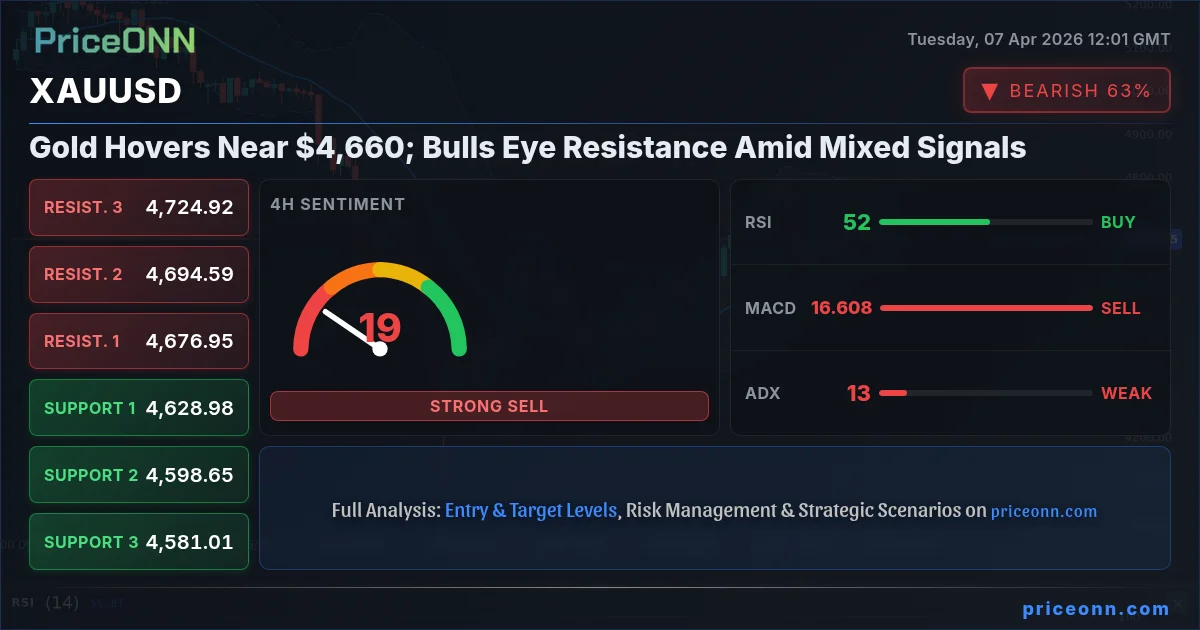
The tug-of-war for gold's direction is intensifying as the precious metal hovers precariously near the $4,660.84 mark. This critical juncture finds both bullish and bearish camps vying for control, with geopolitical tensions providing a volatile backdrop and mixed technical signals leaving traders on edge. While the 1-hour chart hints at upward momentum, the daily view suggests caution, painting a complex picture for the yellow metal.
- XAUUSD trades near $4,660.84, with a neutral daily trend (ADX 31.78) but mixed short-term signals.
- Key support is identified at $4,598.66, while resistance looms at $4,704.15.
- RSI at 45.29 (daily) suggests further downside potential, contrasting with 1-hour buy signals.
- Geopolitical tensions and DXY movements are key drivers influencing gold's immediate path.
- Market sentiment is cautious, with conflicting indicators requiring careful risk management.
The current price action for XAUUSD at $4,660.84 is a fascinating study in market indecision. On the 1-hour timeframe, the trend is decidedly bullish with a strength of 81% and a buy signal dominating the indicators. However, pivot to the daily chart, and the picture shifts dramatically. The trend is neutral, ADX readings point to a weakening trend despite a strong signal on the daily chart, and the RSI at 45.29 suggests a downward bias. This divergence across timeframes underscores the battleground nature of the current gold market.
The Bull Case: Why Gold Might Push Higher
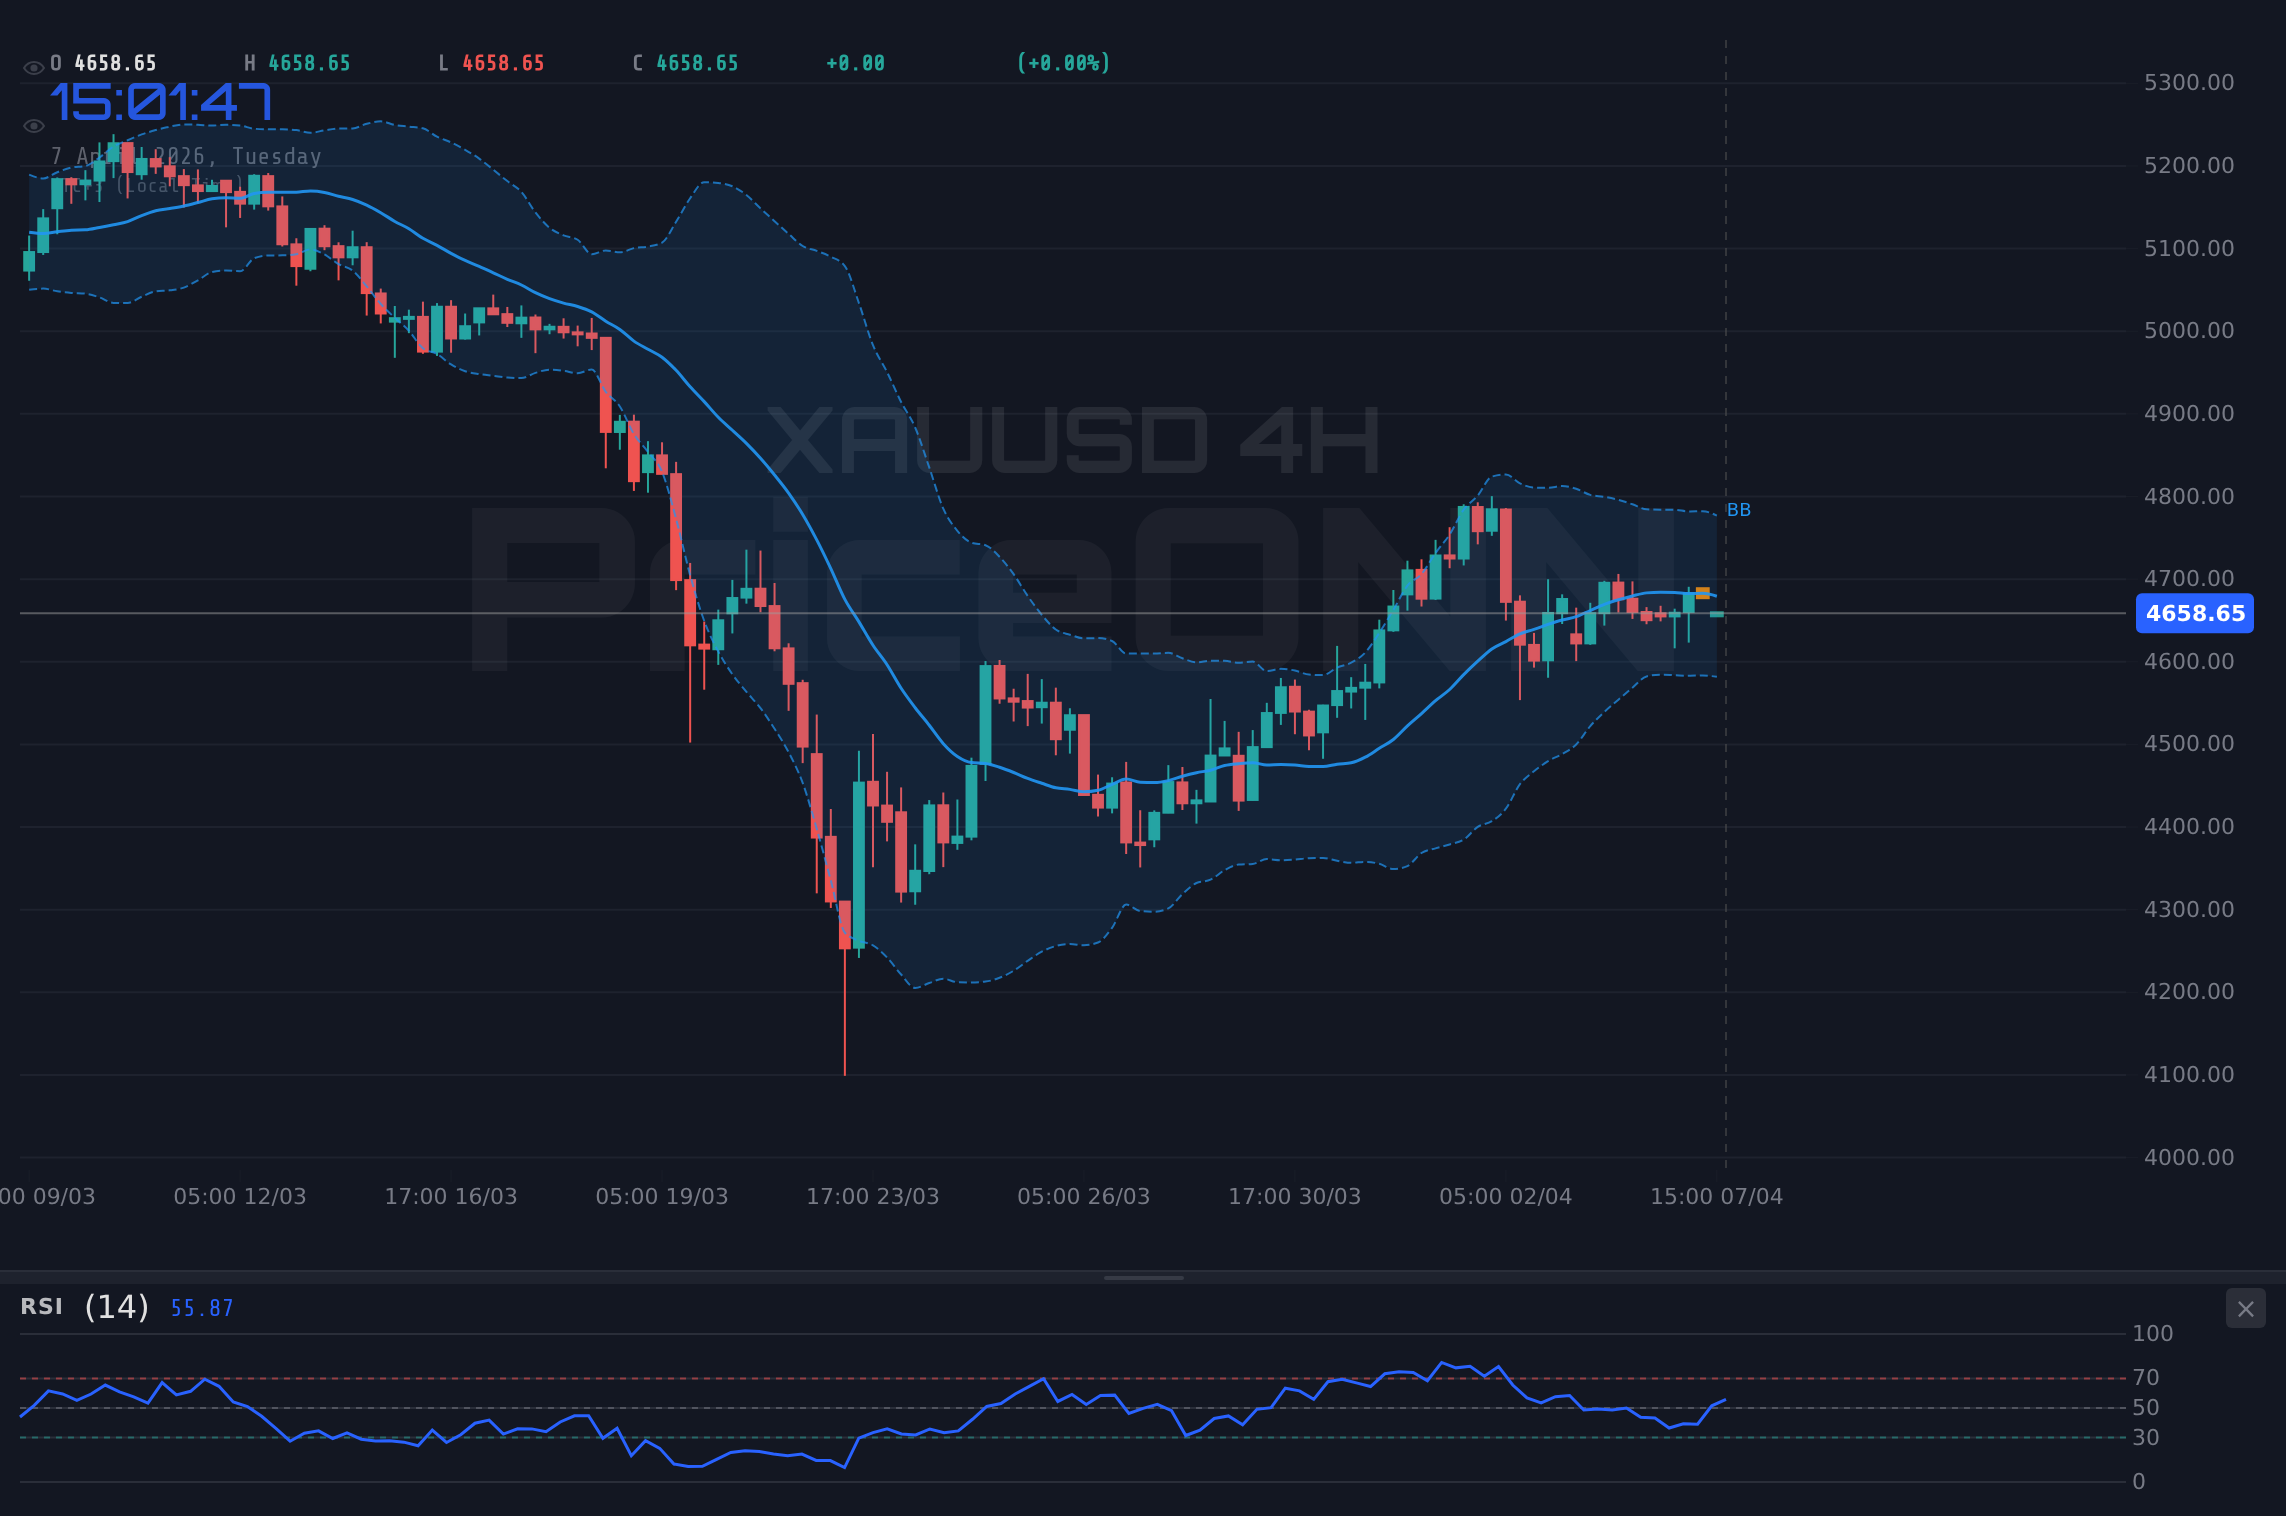
Proponents of a bullish outlook for gold point to several factors. Firstly, the persistent geopolitical instability in the Middle East, particularly concerning Iran's tensions and the Strait of Hormuz, continues to underpin gold's safe-haven appeal. News outlets like Reuters have highlighted these escalating tensions, which historically drive demand for gold as a perceived store of value. The daily RSI, while currently at 45.29, has shown upward momentum in the 1-hour and 4-hour charts, indicating potential for a near-term rally. The 1-hour chart's buy signal, supported by positive MACD momentum and price action above the middle Bollinger Band, suggests that short-term traders might be stepping in.
Furthermore, the US Dollar Index (DXY), currently trading around 99.72, shows a daily uptrend but exhibits weakness on the 1-hour chart. A potential dip in the dollar, often correlated with a rise in gold prices, could provide further impetus. Historically, when the DXY faces headwinds, gold tends to find its footing. The current DXY level, while strong on the daily, is showing conflicting signals across shorter timeframes, hinting at potential volatility that could benefit gold if the dollar weakens. The 1-hour trend for DXY is down, which is a positive sign for gold bulls looking for that inverse correlation to play out.
The strength of the bullish trend on the 1-hour (81%) and 4-hour (82%) charts cannot be ignored. These shorter timeframes often dictate immediate price movements. With the MACD showing positive momentum and the Stochastic %K line crossing above %D on the daily chart (albeit from a lower position), there's an argument to be made for a rebound. The immediate resistance level at $4,671.87 on the 1-hour chart is the first hurdle. A decisive break above this, especially with increasing volume, could open the door for a move towards the $4,704.15 daily resistance level. This is where the bulls would aim to solidify their control.
The Bear Case: Headwinds and Caution Ahead
Conversely, the bears are quick to highlight the daily technical picture, which presents a more sobering outlook. The daily RSI at 45.29, sitting below the neutral 50 level and showing a downward trend, suggests that the path of least resistance might be lower. This indicator reading implies that despite any short-term bounces, underlying selling pressure could be building. The ADX on the daily chart at 31.78 indicates a strong downward trend, contradicting the bullish signals on shorter timeframes. This suggests that the longer-term trend might be reasserting itself.
The 4-hour chart also presents a bearish bias, with the MACD below its signal line and price action below the middle Bollinger Band, indicating a downward inclination. While the Stochastic on the 4-hour chart shows a %K line below %D, confirming a bearish signal, the daily Stochastic's %K line is above %D, adding to the indicator conflict. This mixed bag of signals means that any bullish conviction is fragile. The support levels at $4,640.46 (1H) and more significantly at $4,598.66 (1D) become crucial points to watch. A break below these levels would significantly strengthen the bearish argument.
Moreover, the broader market sentiment plays a vital role. The S&P 500 is showing a strong daily uptrend, but the Nasdaq 100 has a negative daily trend. This divergence in US equity markets could signal a broader risk-off sentiment creeping in, which, while often beneficial for gold, can also be accompanied by dollar strength. If geopolitical risks subside even momentarily, or if US economic data surprises to the upside (as hinted by recent releases concerning inflation and employment, though specific figures are pending), the demand for safe-haven assets like gold could wane. The recent news about rising US inflation, even with a potential dollar slide, could also lead to expectations of further Fed tightening, which is typically bearish for non-yielding assets like gold.
Navigating the Cross-Currents: Intermarket Analysis
Understanding gold's position requires looking beyond its own charts. The correlation with the US Dollar Index (DXY) is paramount. Currently, the DXY's daily trend is bullish, but its 1-hour chart shows a bearish trend. This conflict suggests that the dollar's next move is uncertain, creating volatility for gold. If the DXY breaks below its 1-hour support at 99.53, it could provide a tailwind for XAUUSD. Conversely, a DXY rally above its 1-hour resistance at 99.77 could pressure gold lower.
The performance of major equity indices also offers clues. The S&P 500 is in a strong daily uptrend, but the Nasdaq 100 is showing a bearish daily trend. This divergence is concerning for risk appetite. Typically, a strong S&P 500 would support risk-on assets, but the weakness in the tech-heavy Nasdaq 100 might be a leading indicator of broader market jitters. If risk sentiment deteriorates further, gold could benefit as a safe haven, but this is contingent on the dollar's reaction. The correlation between oil prices and inflation expectations is also noteworthy. Brent crude is showing a strong daily uptrend (ADX 56.53), suggesting rising energy costs and potentially higher inflation, which traditionally supports gold. WTI also shows a very strong daily uptrend. This inflationary pressure is a fundamental bullish factor for gold, acting as a potential hedge against rising prices.
The performance of other precious metals like silver (XAGUSD) also provides context. Silver is currently trading at $72.18 and shows a predominantly bearish sentiment across its timeframes, with a strong daily sell signal. While gold and silver often move together, divergences can occur. Silver's weakness might suggest that industrial demand concerns, which are more significant for silver than gold, are weighing on the white metal. However, gold's primary driver remains its safe-haven status and inflation-hedging properties, which appear to be in demand amidst the current geopolitical climate.
The Indicator Conundrum: What Do the Numbers Really Say?
Delving deeper into the technical indicators reveals the complexity of the current market. On the daily chart, the RSI at 45.29 is below 50, indicating a bearish bias, and the ADX at 31.78 confirms a strong downtrend. This is a significant red flag for bulls. However, the daily Stochastic is showing a bullish crossover (%K above %D), suggesting a potential reversal or at least a pause in the downtrend. This conflict between RSI/ADX and Stochastic is a classic sign of a market in transition or consolidation.
On the 1-hour chart, the picture is markedly different. RSI is at 50.56, hovering around the neutral mark but with an upward tendency. The MACD shows positive momentum, and the Stochastic has a %K line below %D, indicating a potential short-term sell signal within the broader bullish trend. The ADX on the 1-hour chart is a mere 12.77, signifying a weak trend – essentially, chop. This means that short-term moves can be sharp but lack follow-through. The 4-hour chart leans bearish with RSI at 52.34, MACD negative, and Stochastic showing a bearish crossover, but ADX remains weak at 13.1. This conflicting data across timeframes means that traders must be highly selective and employ strict risk management.
The Verdict: A Precarious Balance
The current market environment for XAUUSD is defined by a precarious balance. Geopolitical tensions and rising oil prices provide a fundamental tailwind for gold, acting as a hedge against inflation and uncertainty. The safe-haven narrative remains strong, especially with the DXY showing signs of potential weakness on shorter timeframes. However, the daily technical indicators, particularly the RSI and ADX, suggest that the bearish trend might still have legs, or at least that significant upside may be capped near current resistance levels.
The critical resistance level to watch is $4,704.15. A decisive breach and hold above this point, especially if accompanied by strong volume and a shift in daily indicators towards bullish confirmation, would signal a continuation of the uptrend. Conversely, failure to overcome this resistance, coupled with a break below the immediate support at $4,640.46 and ultimately the daily support at $4,598.66, would likely see gold retest lower levels. The market is at a crossroads, and the next significant catalyst - be it economic data, a geopolitical development, or a shift in central bank rhetoric - will likely determine the immediate direction.
Bearish Scenario: Testing Lower Ground
65% ProbabilityNeutral Scenario: Range-Bound Consolidation
25% ProbabilityBullish Scenario: Clearing the Hurdles
10% ProbabilityFrequently Asked Questions: XAUUSD Analysis
What happens if XAUUSD breaks below its daily support at $4,598.66?
A decisive break below $4,598.66 would invalidate short-term bullish hopes and strengthen the bearish case. This could trigger further selling pressure, potentially targeting the next support level at $4,546.99 as the market re-evaluates risk sentiment and inflation expectations.
Is the RSI at 45.29 a sell signal for XAUUSD right now?
The daily RSI at 45.29 suggests a bearish bias, indicating that selling momentum may be present. However, it's not yet in oversold territory, and the conflicting signals from shorter timeframes mean caution is advised. A confirmed break below key support would validate this bearish signal.
How will current geopolitical tensions affect XAUUSD's price around $4,660?
Escalating Middle East tensions, particularly concerning Iran, generally support gold as a safe-haven asset. This factor is currently providing a floor around $4,660.84. However, sustained geopolitical risk without further escalation might see its impact diminish, especially if economic data points towards tighter monetary policy.
Should traders consider buying XAUUSD at $4,660.84 given the mixed signals?
Buying at $4,660.84 requires careful risk management due to conflicting signals. A breakout above the $4,671.87 resistance on the 1-hour chart could offer a short-term entry, but invalidation below $4,640.46 support is crucial. Long-term conviction requires a clear break above daily resistance at $4,704.15.
Technical Outlook Summary
| Indicator | Value | Signal | Interpretation |
|---|---|---|---|
| RSI (14) | 45.29 | Bearish | Below 50 suggests downside bias |
| MACD Histogram | +15.20 | Bullish | Positive momentum on daily |
| Stochastic | K=73.61, D=67.21 | Bullish Crossover | %K > %D, potential reversal |
| ADX | 31.78 | Strong Trend | Indicates a strong downtrend on daily |
| Bollinger Bands | Middle Band Break | Watch | Price is below middle band on daily |
Track markets in real-time
AI-powered analysis, technical indicators and real-time price data.
Join Our Telegram Channel
Breaking market news, AI analysis and trading signals instantly.
Join Channel