
Amidst a mixed global economic outlook, the Nasdaq100 finds itself at a critical juncture. While recent sessions have seen minor gains, a deeper look reveals a prevailing bearish trend, raising the question: Is this a temporary reprieve or a deceptive trap for unsuspecting investors?
- The Nasdaq100 is currently trading around $24,775.76, struggling to overcome bearish pressure.
- Key resistance lies at $24,794.42, a level that needs to be breached for any sustained bullish momentum.
- The ADX, currently at 13.02 on the 4H chart, indicates a weak trend, suggesting that the recent price action may lack conviction.
- Global economic uncertainty and rising interest rate expectations continue to weigh on market sentiment.
Navigating the Economic Crosscurrents Affecting the Nasdaq100
The Nasdaq100's performance is intricately linked to broader macroeconomic factors. Recent data indicates a mixed bag of economic signals, with some sectors showing resilience while others struggle. The Federal Reserve's stance on interest rates remains a key driver, with investors closely monitoring any hints of policy shifts. According to Reuters, Fed officials remain committed to taming inflation, even if it means slower economic growth. This hawkish stance has contributed to the prevailing bearish sentiment, as higher interest rates tend to dampen growth prospects for technology companies, which dominate the Nasdaq100.
Furthermore, geopolitical tensions and trade disputes continue to add to the uncertainty. The ongoing conflict in Eastern Europe and simmering tensions between the US and China have created a risk-averse environment, prompting investors to seek safe-haven assets. This risk-off sentiment has further weighed on the Nasdaq100, as investors rotate out of growth stocks and into more defensive sectors.
Decoding Technical Signals: A Multi-Timeframe Analysis
A comprehensive technical analysis across multiple timeframes provides valuable insights into the Nasdaq100's current trajectory. On the daily chart, the index is trading below its 200-day moving average, a key indicator of long-term trend. The Relative Strength Index (RSI) stands at 44.22, indicating that the index is neither overbought nor oversold, suggesting further room for downside movement. The Moving Average Convergence Divergence (MACD) histogram is showing negative momentum, further corroborating the bearish outlook.
Zooming in to the 4-hour timeframe, the bearish trend remains evident. The index is trading below its 50-period moving average, and the Stochastic oscillator is signaling oversold conditions. However, the ADX is at 13.02, indicating a weak trend. This divergence between the oversold Stochastic and the weak ADX suggests that the current downside momentum may be losing steam, but a sustained reversal is not yet confirmed. The index is currently facing resistance at $24,794.42, a level that needs to be decisively breached for any bullish hopes to materialize.
The hourly chart paints a similar picture, with the RSI hovering around 48.46. The Nasdaq100 is currently finding support near $24,769.24. The key takeaway from this multi-timeframe analysis is that the bearish trend remains intact, but the oversold conditions and weak ADX readings suggest that a period of consolidation or a minor pullback may be in store before the next leg down.
Why Nasdaq100 Volatility Analysis Points to a Breakout
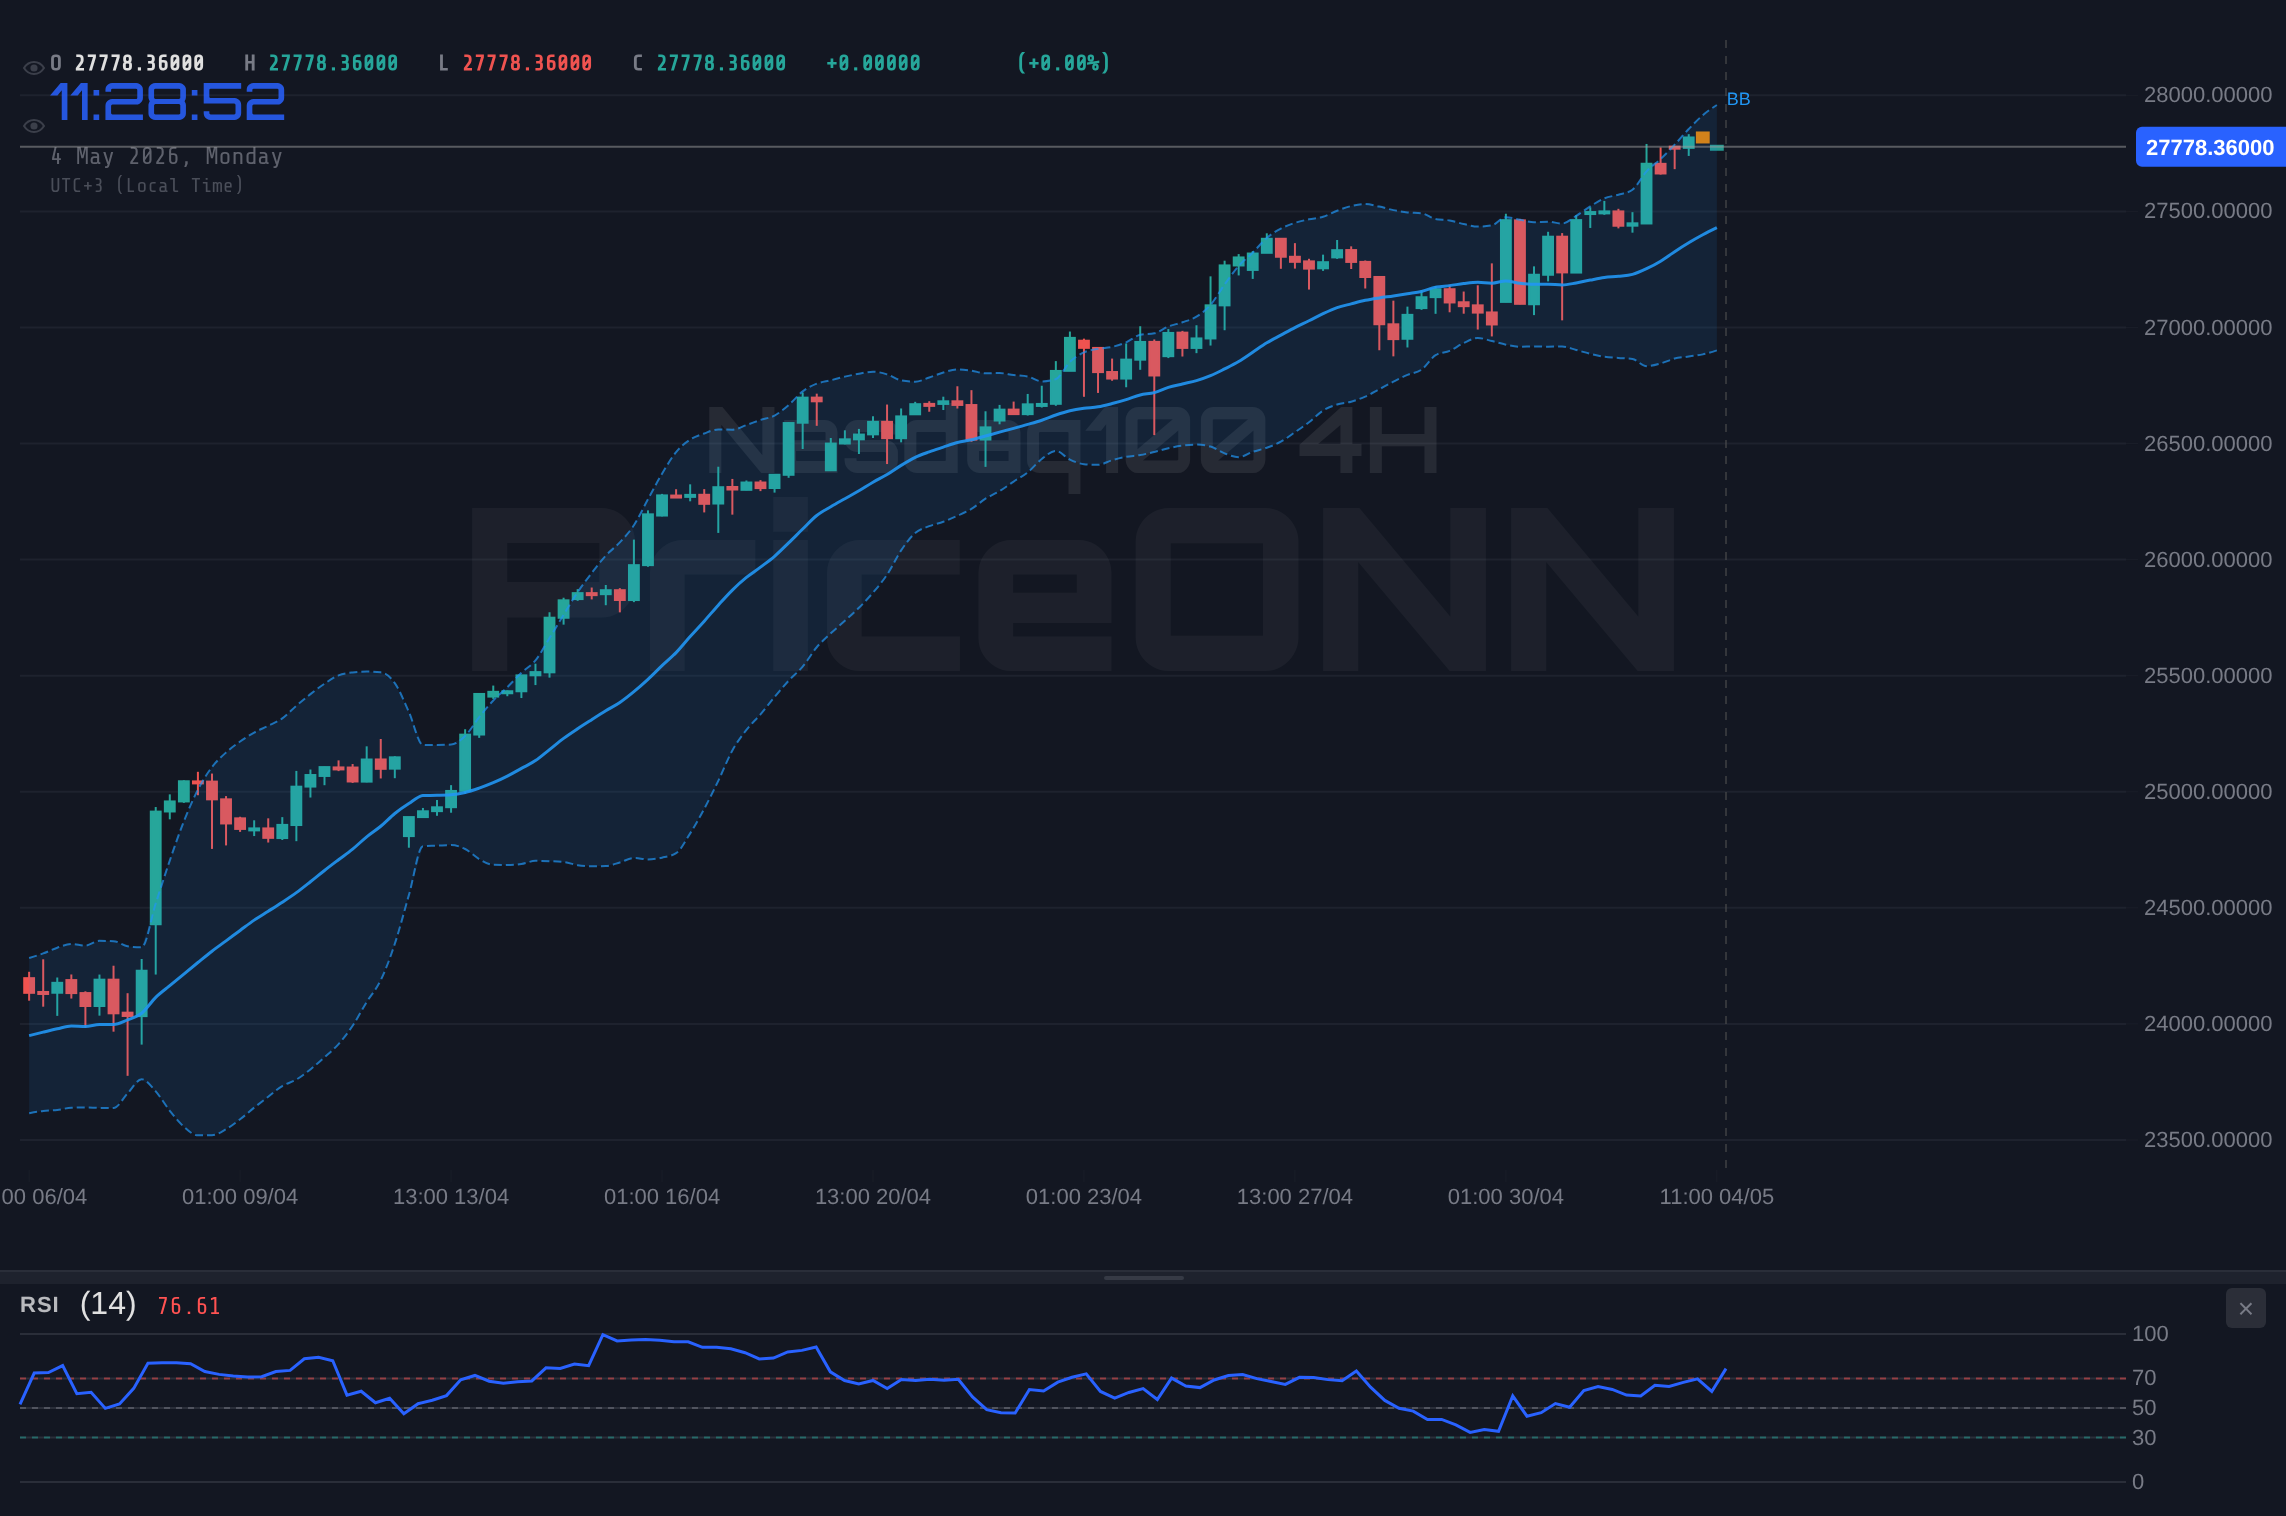
Volatility analysis provides another layer of understanding to the Nasdaq100's current state. Implied volatility, as measured by the VIX index, remains elevated, reflecting the prevailing uncertainty in the market. This elevated volatility suggests that significant price swings are likely in the near term. The Bollinger Bands, which measure price volatility around a moving average, are widening, indicating that the Nasdaq100 is poised for a potential breakout. The direction of this breakout will likely depend on the resolution of the macroeconomic factors discussed earlier.
Options market activity also provides clues about investor sentiment. Put-call ratios, which measure the relative demand for put options (bearish bets) versus call options (bullish bets), remain elevated, suggesting that investors are hedging against further downside risk. However, a decrease in open interest on short-dated put options hints at short covering, which could provide a temporary boost to the index.
Key Support and Resistance Levels to Watch Closely
Identifying key support and resistance levels is crucial for developing a sound trading strategy. Based on the current market data, immediate resistance for the Nasdaq100 lies at $24,794.42, followed by $24,820.43 and $24,859.43. These levels represent potential areas where selling pressure may intensify, preventing further upside movement. A successful breach of these resistance levels would signal a potential shift in sentiment and open the door for a more sustained rally.
On the downside, immediate support can be found at $24,769.24, followed by $24,754.56 and $24,739.72. These levels represent areas where buying interest may emerge, providing a cushion against further declines. A break below these support levels would confirm the bearish trend and pave the way for a test of lower levels.
Reading the ADX: Is This a High-Probability Setup?
The Average Directional Index (ADX) is a valuable tool for gauging the strength of a trend. Currently, the ADX on the 4-hour chart stands at 13.02, indicating a weak trend. This suggests that the recent price action may lack conviction and is susceptible to reversals. A strong trend, characterized by an ADX above 25, would provide more confidence in the prevailing bearish bias. In the absence of a strong trend, traders should exercise caution and wait for further confirmation before initiating short positions.
However, a daily close above $24,794.42 would open the door for a test of higher resistance levels, potentially invalidating the bearish thesis. Traders should closely monitor the price action around this level, as a decisive breakout could signal a shift in sentiment and trigger a rally towards $24,820.43 and beyond.
Frequently Asked Questions: Nasdaq100 Analysis
Is Nasdaq100 a good buy right now?
At the current price of $24,775.76, the Nasdaq100 is facing strong bearish pressure and weak trend strength. A sustained bullish setup requires a break above $24,794.42, so patience is key.
What is the Nasdaq100 price forecast for this week?
The Nasdaq100 price forecast for this week hinges on breaking $24,794.42; if broken, expect a rally to $24,820.43. Failure to break resistance could see a move towards support at $24,769.24.
What are the key support and resistance levels for Nasdaq100?
Key support levels for the Nasdaq100 are $24,769.24, $24,754.56 and $24,739.72. Key resistance levels are $24,794.42, $24,820.43 and $24,859.43.
Why is Nasdaq100 moving today?
The Nasdaq100 is moving today due to a combination of factors, including global economic uncertainty, rising interest rate expectations, and geopolitical tensions that are influencing investor sentiment.
Technical Outlook Summary
| Indicator | Value | Signal |
|---|---|---|
| RSI (14) | 44.22 | Neutral |
| MACD Histogram | Negative | Bearish |
| Stochastic | 46.71 | Bearish |
| ADX | 13.02 | Weak Trend |
| Bollinger | Lower Band | Bearish |
Track markets in real-time
AI-powered analysis, technical indicators and real-time price data.
Join Our Telegram Channel
Breaking market news, AI analysis and trading signals instantly.
Join Channel