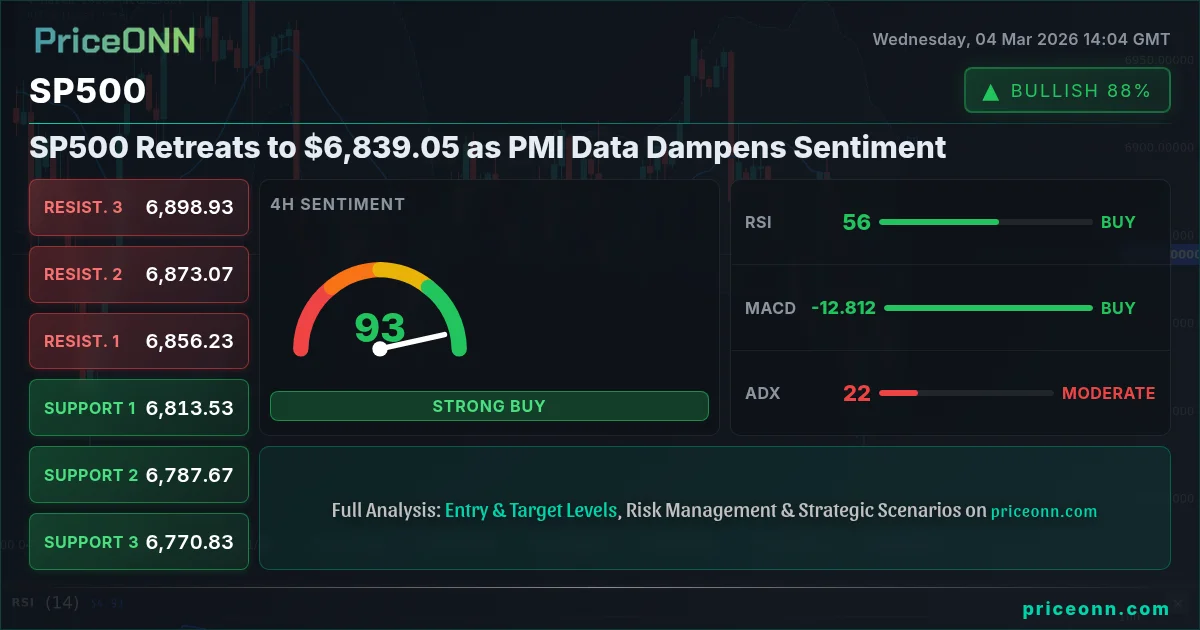
The SP500 is currently trading near $6,839.05, facing downward pressure after recent PMI data releases painted a less optimistic picture of economic activity. This level is critical as traders assess whether the index can maintain its upward trajectory or if a deeper correction is on the horizon. The current bearish sentiment is further compounded by geopolitical tensions and uncertainty surrounding future Federal Reserve policy.
- RSI at 46.09 on the daily chart indicates potential for further downside.
- Critical support level lies at $6,717.6, a break below which could trigger a sharper sell-off.
- MACD histogram shows negative momentum, suggesting bearish sentiment is gaining strength.
- Federal Reserve policy expectations are driving SP500 correlation with the DXY.
Having tracked the SP500 through multiple economic cycles, it's clear that PMI data often acts as a leading indicator for broader market sentiment. The recent figures suggest a potential slowdown, prompting investors to re-evaluate their positions. This pullback offers an opportunity to examine the underlying technical structure and identify key levels that will determine the index's next move. The SP500's failure to sustain gains above the $6,884 resistance adds to the bearish outlook.
Technical Picture: Key Levels in Focus
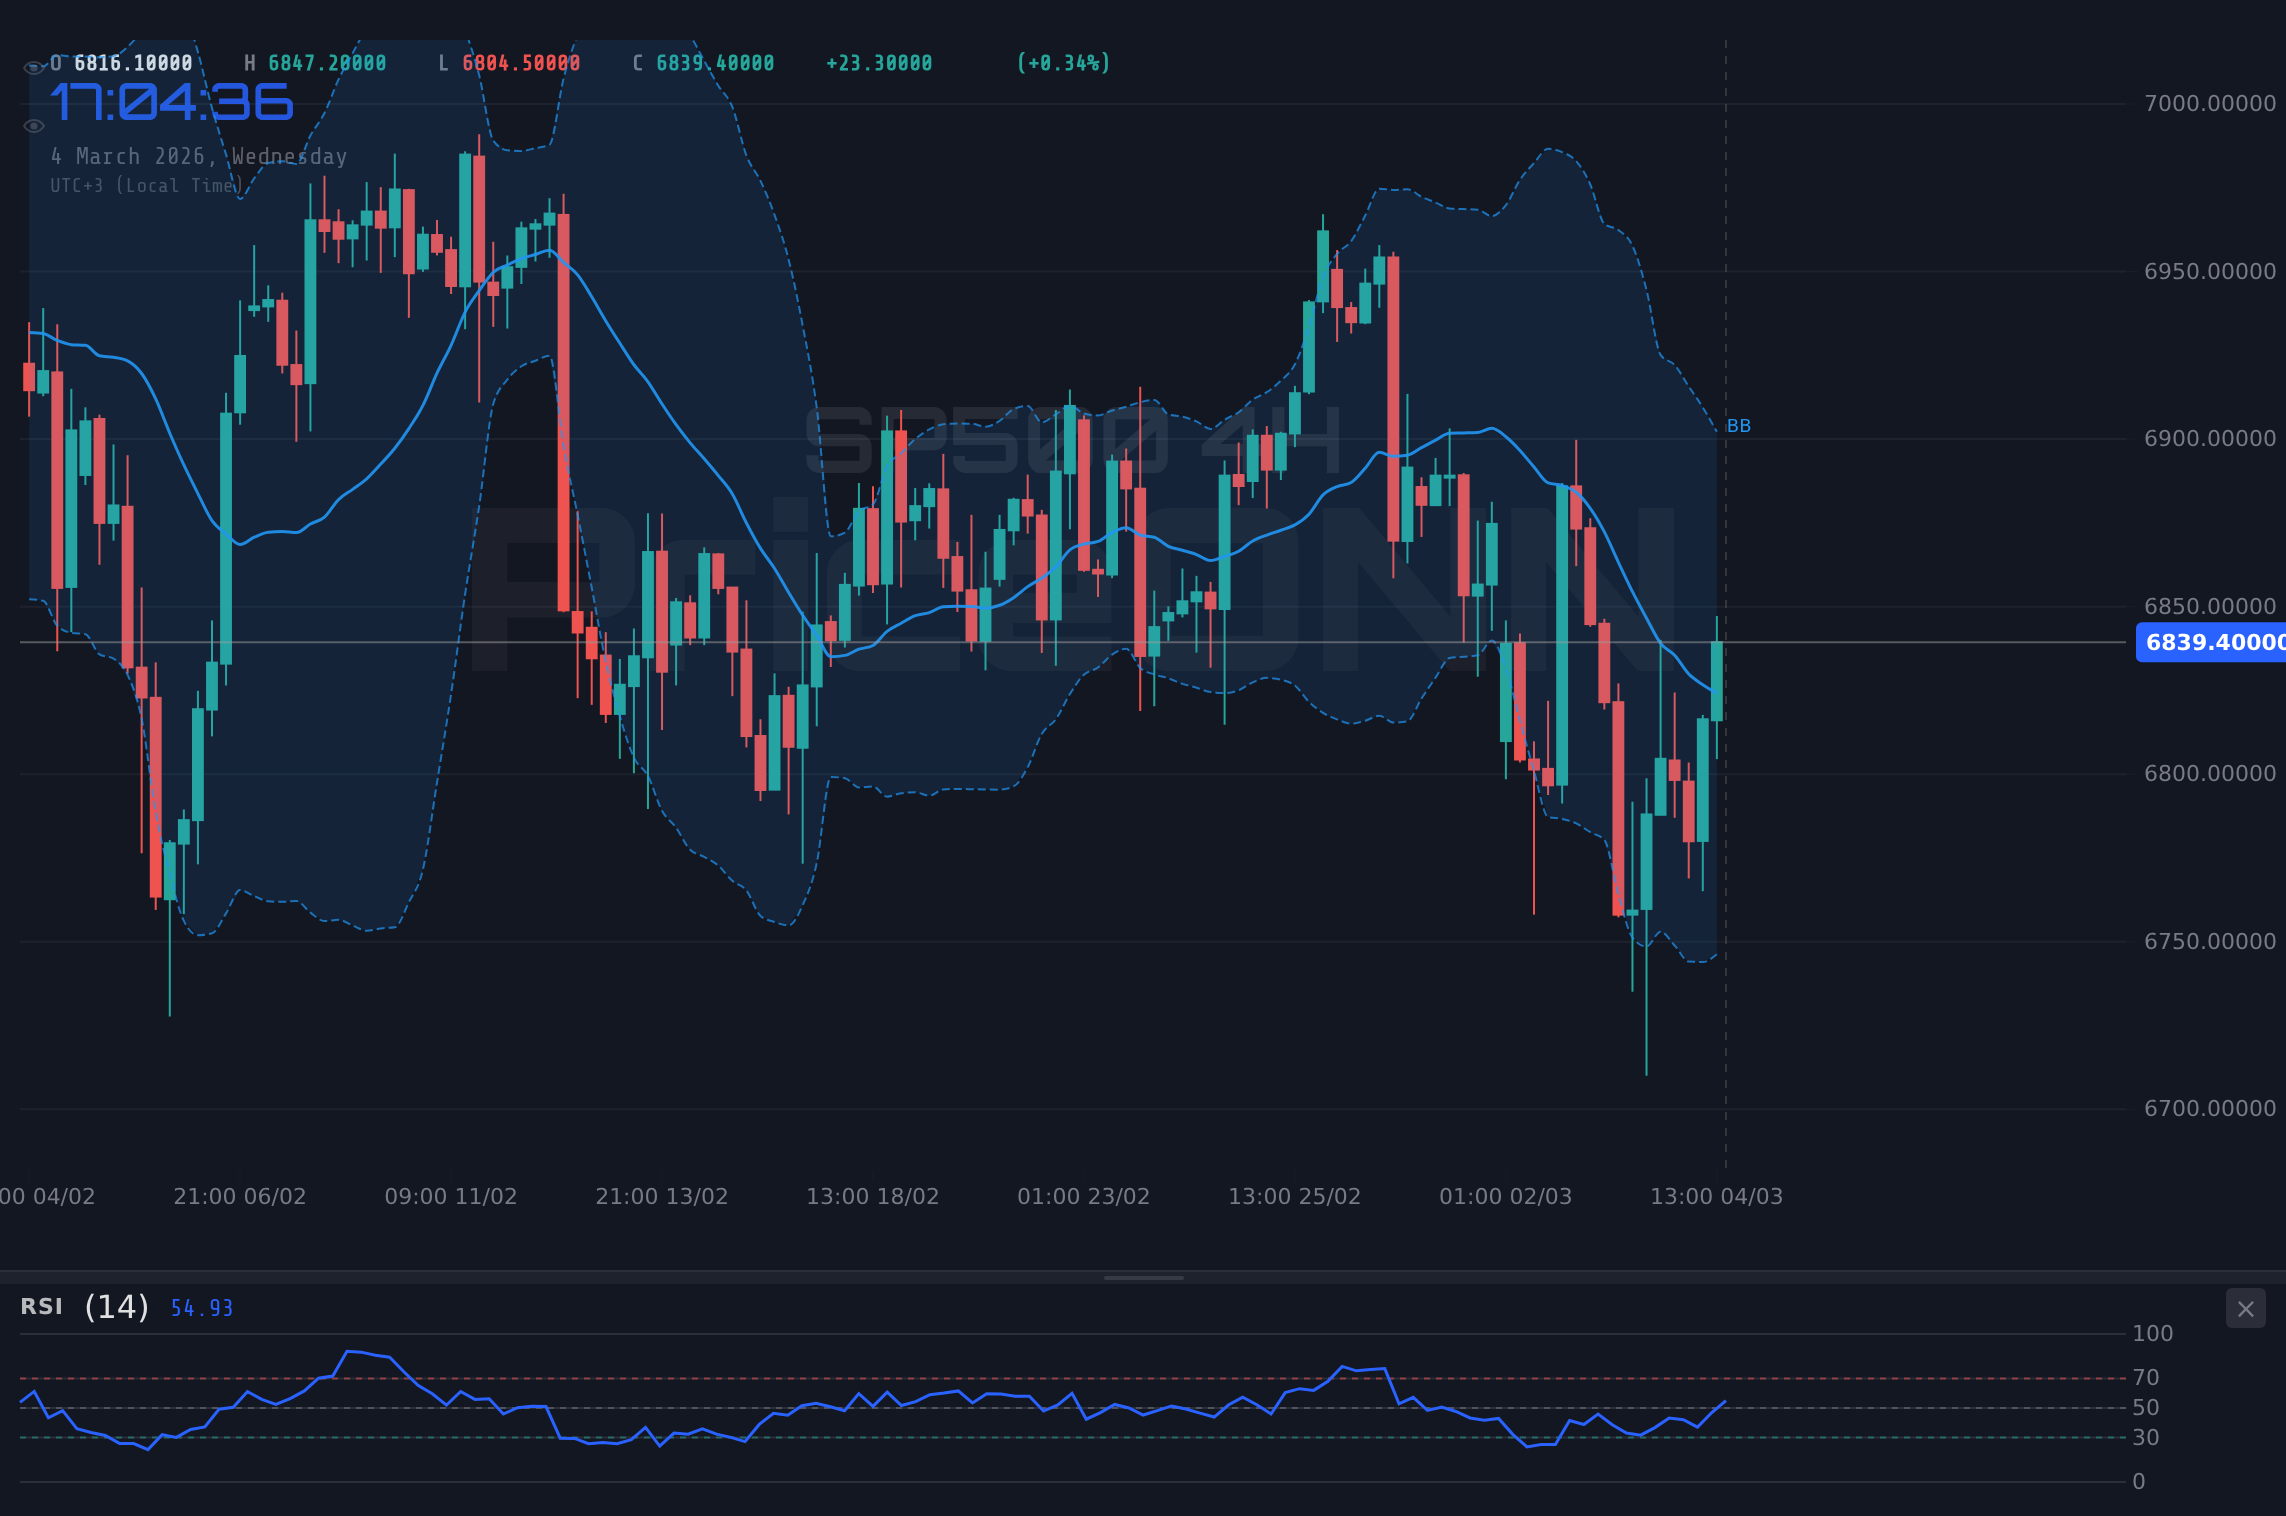
A closer look at the SP500's technical chart reveals several important signals. The 4-hour chart shows a strong downtrend with the ADX at 23.17, indicating moderate trend strength. The index is currently trading below its middle Bollinger Band, further confirming bearish momentum. The Stochastic oscillator, with K=47.37 and D=59.24, suggests that the SP500 may be poised for further declines. This technical confluence adds weight to the bearish scenario.
The SP500's performance is also heavily influenced by broader market dynamics. With the DXY currently at 98.58, a strong dollar is putting pressure on equities, including the SP500. This inverse correlation is a key factor to watch, as further dollar strength could exacerbate the selling pressure. Risk appetite is also declining, as evidenced by recent geopolitical tensions, potentially increasing safe-haven demand and further weighing on the SP500.
Key support levels to watch include $6,717.6, followed by $6,630.6. A break below $6,717.6 could trigger a sharper sell-off, potentially targeting the $6,630.6 level. On the upside, immediate resistance lies at $6,884, followed by $6,963.4. A sustained move above $6,884 would be needed to negate the current bearish bias. The current price action suggests that the path of least resistance is to the downside.
Historically, when the RSI reaches similar levels on the daily chart, we've often seen a period of consolidation or further downside. The MACD histogram is also showing negative momentum, suggesting that the bearish sentiment is gaining strength. This combination of factors warrants caution, particularly for those holding long positions. Traders should closely monitor these levels and adjust their strategies accordingly.
Bearish Scenario: Breakdown Imminent?
The bearish scenario hinges on continued weakness in economic data and persistent geopolitical tensions. If the SP500 breaks below the $6,717.6 support, we could see a rapid decline towards $6,630.6, and potentially even $6,551.2. This scenario is further supported by the negative momentum on the MACD histogram and the relatively weak RSI reading. A significant catalyst, such as a surprise interest rate hike or a major geopolitical event, could accelerate this decline. If this condition plays out, we could see a great setup!
Bullish Scenario: Recovery Hinges on Data
The bullish scenario requires a significant improvement in economic data and a calming of geopolitical tensions. If the SP500 can hold above the $6,717.6 support and break above the $6,884 resistance, we could see a rally towards $6,963.4, and potentially even $7,050.4. This scenario is less likely given the current technical picture, but a positive surprise in upcoming economic data could provide the necessary catalyst. Patience looks like it will be rewarded here.
Economic Data Watch
Several key economic data releases are on the horizon that could significantly impact the SP500. On Monday, March 2nd, the ISM Manufacturing PMI was released. Furthermore, today, Wednesday, March 4th, the ISM Services PMI and Factory Orders data are due. These figures will provide further insight into the health of the US economy and could either exacerbate or alleviate the current bearish pressure. Traders should closely monitor these releases and adjust their strategies accordingly.
According to Reuters, Fed officials continue to emphasize the importance of data dependency in their policy decisions. This means that upcoming economic data releases will be crucial in determining the Fed's next move. If the data continues to point to a slowdown, the Fed may be forced to reconsider its hawkish stance, potentially providing some support to the SP500.
Sustained hold above $6,717.6 support, followed by a break above $6,884 resistance, targeting $6,963.4 and potentially $7,050.4. Requires positive economic data and easing of geopolitical tensions.
Breakdown below $6,717.6 support, leading to a rapid decline towards $6,630.6 and potentially $6,551.2. Supported by negative momentum and persistent geopolitical risks.
Frequently Asked Questions: SP500 Analysis
Is SP500 a good buy right now?
Given the current bearish sentiment and technical indicators, SP500 may not be a good buy right now. A break below $6,717.6 could trigger a further decline. Therefore, caution is warranted.
What is the SP500 price forecast for this week?
The SP500 price forecast for this week is mixed, with potential for further downside towards $6,630.6 if the $6,717.6 support is breached. A sustained move above $6,884 could signal a potential recovery. Probability assessment is tilted towards the downside.
What are the key support and resistance levels for SP500?
Key support levels for SP500 are $6,717.6, $6,630.6, and $6,551.2. Key resistance levels are $6,884, $6,963.4, and $7,050.4. These levels should be closely monitored for potential trading opportunities.
Why is SP500 moving today?
SP500 is moving today due to disappointing PMI data releases, which have dampened investor sentiment. Additionally, geopolitical tensions and uncertainty surrounding Federal Reserve policy are contributing to the downward pressure.
Technical Outlook Summary
| Indicator | Value | Signal |
|---|---|---|
| RSI (14) | 46.09 | Neutral |
| MACD Histogram | Negative | Bearish |
| Stochastic | 47.37/59.24 | Bearish |
| ADX | 28.78 | Strong Downtrend |
| Bollinger | Middle Band | Watch |
Key Levels
Support Levels
Resistance Levels
Track markets in real-time
AI-powered analysis, technical indicators and real-time price data.
Join Our Telegram Channel
Breaking market news, AI analysis and trading signals instantly.
Join Channel