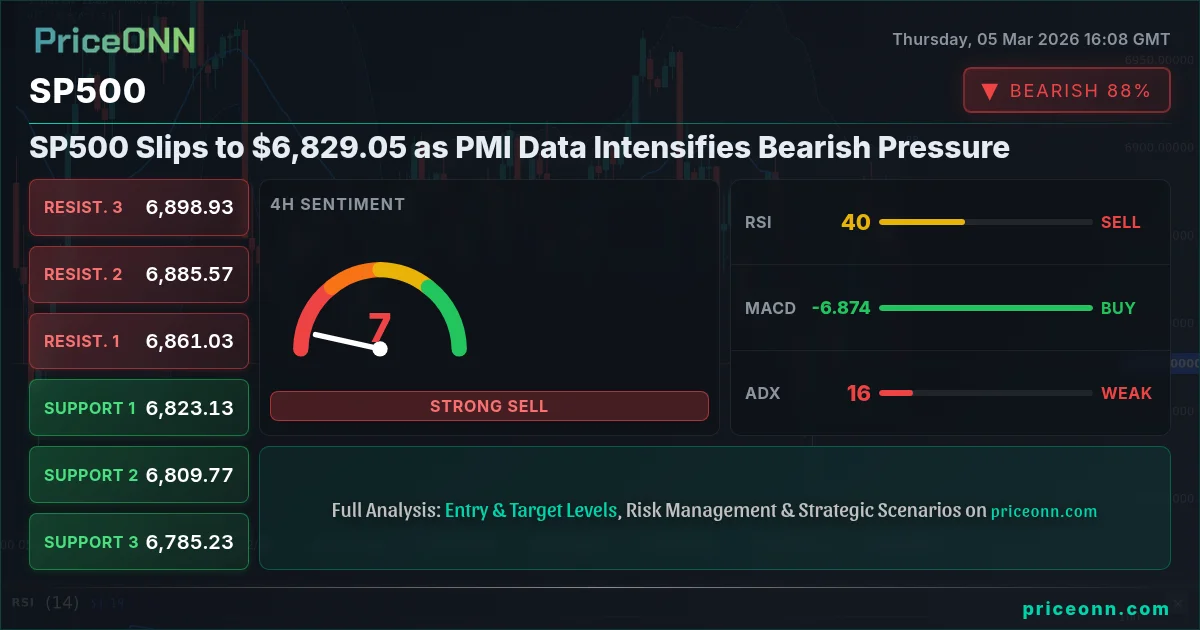
The SP500 is caught in a tug-of-war, with bulls attempting to defend key support levels while bears capitalize on negative PMI data, driving the index down to $6,829.05. The question now is whether this is a temporary pullback or the beginning of a more substantial correction.
The recent decline in the SP500 can be attributed to a confluence of factors, most notably the disappointing PMI data released earlier today. This data has fueled concerns about a potential economic slowdown, leading investors to reduce their exposure to risk assets. The SP500 today analysis reveals a market struggling to find a clear direction, with volatility analysis indicating a potential breakout.
The Bull Case for SP500
Despite the recent bearish pressure, there are arguments to be made for a potential SP500 recovery. First, while the daily chart indicates a strong downtrend with an ADX of 29.1, the 4H chart shows a more neutral stance, with the Stochastic at 63.69, leaving room for potential upside before hitting overbought levels. Second, the index is still trading above its 200-day moving average, a key indicator of long-term trend strength. A bounce off the $6,795.33 support level could signal a renewed bullish phase. Furthermore, corporate earnings season is just around the corner, and positive surprises could provide a much-needed boost to market sentiment. The fact that the Nasdaq 100 is showing a slightly more positive picture with a Stochastic K=49.11, D=47.32 on the 1H timeframe indicates that there is still some underlying strength in the tech sector which is a strong component of the SP500.
From a market sentiment analysis perspective, the current pullback could be seen as a healthy correction after a prolonged period of gains. Such pullbacks are often necessary to shake out weak hands and set the stage for the next leg up. Additionally, low interest rates and continued fiscal stimulus provide a supportive backdrop for equities in the long run. Should geopolitical tensions ease, as indicated by the recent pullback in gold prices to $5,101.71, risk appetite could return, benefiting the SP500. The SP500 RSI on the daily timeframe, while neutral at 45.53, isn't deeply oversold, allowing for a potential bounce if market conditions improve.
The Bear Case for SP500
On the other hand, the bear case for SP500 is equally compelling. The disappointing PMI data is a clear warning sign that economic growth may be slowing down. The daily SP500 MACD signal is showing negative momentum, confirming the bearish trend. The current SP500 price forecast is not encouraging, as the index struggles to maintain its upward trajectory. The fact that the DXY is strengthening, currently at 98.91, is putting further pressure on the SP500. With the 1H RSI at 31.18, the Dow Jones 30 is also showing strong bearish signals.
Furthermore, rising inflation and the prospect of higher interest rates could weigh heavily on corporate earnings and valuations. The market may also be underestimating the potential impact of geopolitical risks, particularly escalating tensions in the Middle East. Any further escalation could lead to a significant flight to safety, benefiting safe-haven assets like gold and US Treasuries while hurting equities. The SP500 weekly outlook suggests that the index may struggle to break above the $6,915.23 resistance level. The fact that WTI crude oil is showing a strongly overbought picture with a daily RSI of 81.66 also reinforces the inflation concerns.
Technicals as the Tiebreaker
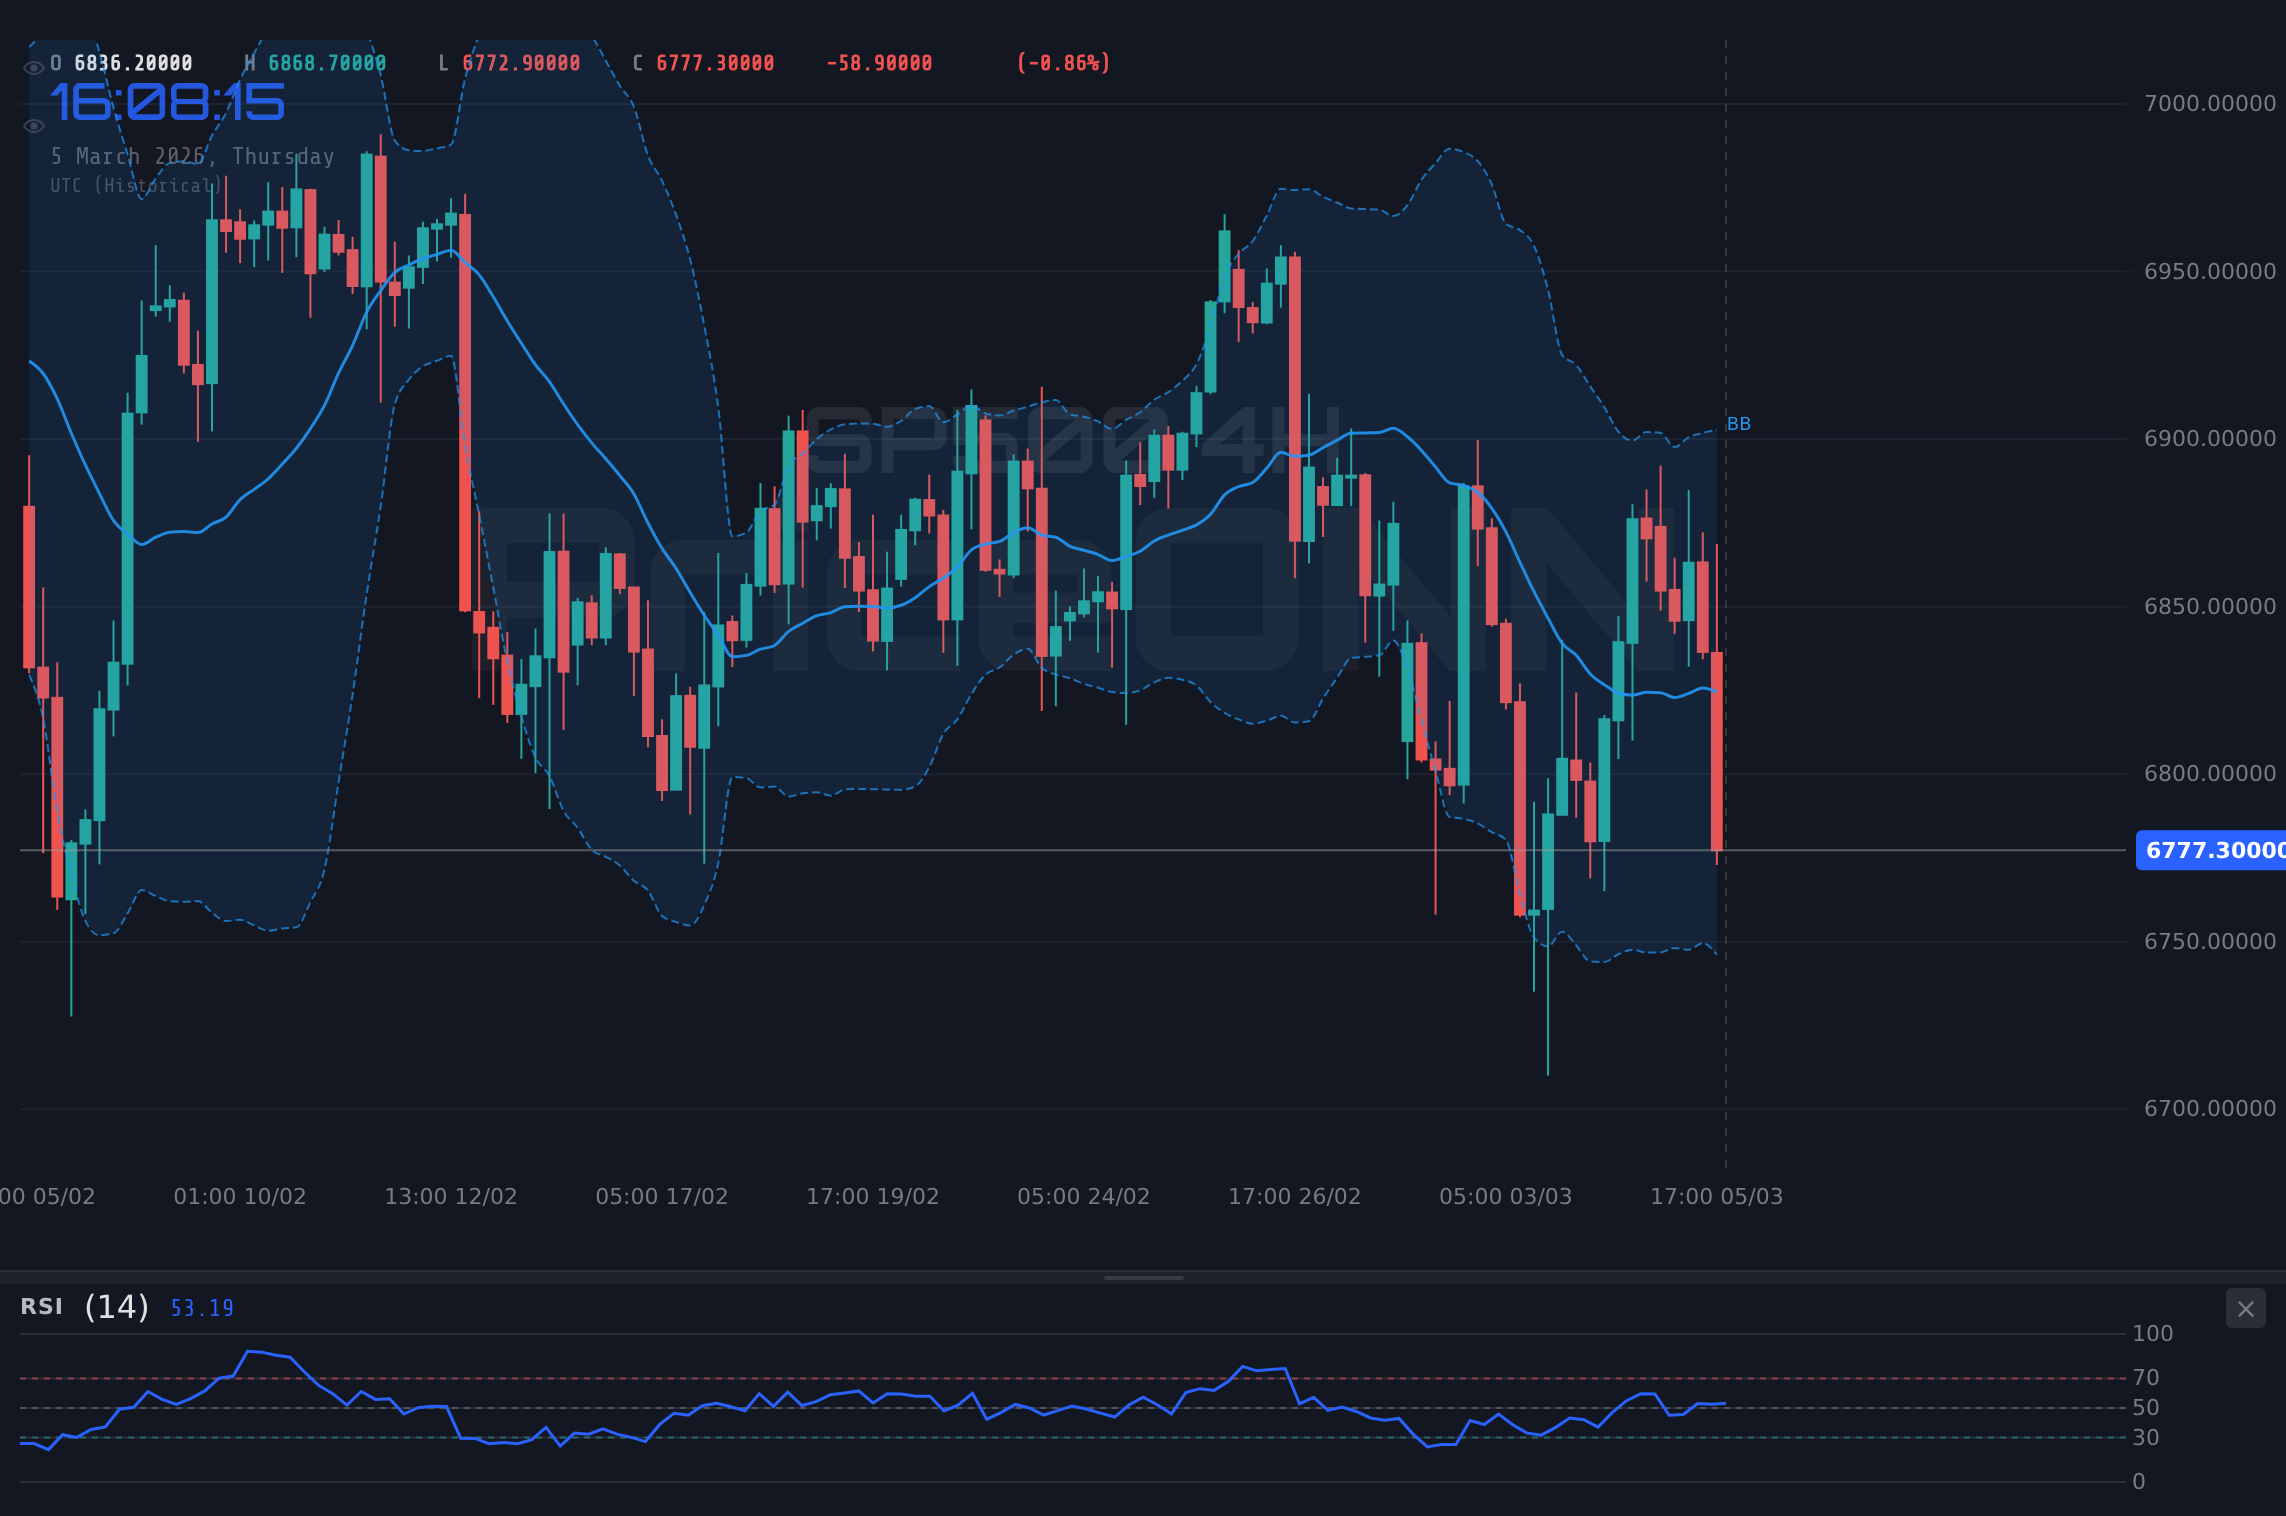
Looking at the technical indicators, the picture is mixed. On the hourly chart, the SP500 is trading below its 50-day and 200-day moving averages, suggesting short-term weakness. However, the daily chart shows that the index is still trading above its 200-day moving average, indicating long-term strength. The key level to watch is the $6,795.33 support. A break below this level could trigger a sharp sell-off, with the next major support level at $6,720.27. On the upside, the index faces significant resistance at $6,915.23. A sustained break above this level would negate the bearish outlook and pave the way for a retest of recent highs.
The SP500 breakout scanner is currently not showing any clear signals, indicating that the market is in a state of uncertainty. The SP500 support and resistance levels are well-defined, providing traders with clear entry and exit points. The SP500 RSI is hovering around neutral territory, suggesting that the market is neither overbought nor oversold. The SP500 MACD signal is showing negative momentum, but the histogram is not yet deeply negative, indicating that the bearish trend may be losing steam. The ADX, at a weak 15.66 on the 4H chart, confirms this lack of strong trend commitment.
The Verdict: Proceed with Caution
Given the mixed signals from both fundamental and technical factors, a cautious approach is warranted. The SP500 news impact is currently negative, as investors react to the disappointing PMI data. However, the market may be overreacting, and a bounce is possible in the short term. The SP500 market sentiment is currently bearish, but this could change quickly if positive news emerges. The SP500 key levels are well-defined, providing traders with clear entry and exit points. Traders should closely monitor the $6,795.33 support level. A break below this level could trigger a sharp sell-off, while a bounce could signal a renewed bullish phase.
The SP500 faces headwinds from weak PMI data and a strengthening dollar, but underlying support and potential earnings surprises could provide a floor. Watch key levels and upcoming economic releases to gauge the next move. Manage your risk, wait for your setup-the market always gives a second chance.
Frequently Asked Questions: SP500 Analysis
Is SP500 a good buy right now?
Given the current bearish pressure and the index trading at $6,829.05, it's a high-risk entry. Waiting for a confirmed bounce off the $6,795.33 support level or a break above the $6,915.23 resistance would be a more prudent approach.
What is the SP500 price forecast for this week?
The SP500 price forecast for this week is uncertain, with the index likely to trade in a range between $6,720.27 and $6,915.23. A sustained break above or below these levels would provide a clearer direction.
What are the key support and resistance levels for SP500?
Key support levels for SP500 are $6,795.33 and $6,720.27, while key resistance levels are $6,915.23 and $6,960.07. These levels represent potential areas of buying and selling pressure.
Why is SP500 moving today?
The SP500 is moving lower today due to disappointing PMI data, which has raised concerns about a potential economic slowdown and its impact on corporate earnings. The strengthening dollar is also adding pressure.
Track markets in real-time
AI-powered analysis, technical indicators and real-time price data.
Join Our Telegram Channel
Breaking market news, AI analysis and trading signals instantly.
Join Channel