USD/JPY has recently surged past the critical level of $154.75, raising questions about the sustainability of this breakout. As traders analyze market dynamics, they are left wondering whether this movement signifies a genuine bullish trend or merely a trap for unsuspecting bulls.
Current support levels are positioned below $154.75, while resistance levels loom above, indicating a critical juncture for USD/JPY traders.
Market Context and Recent Performance
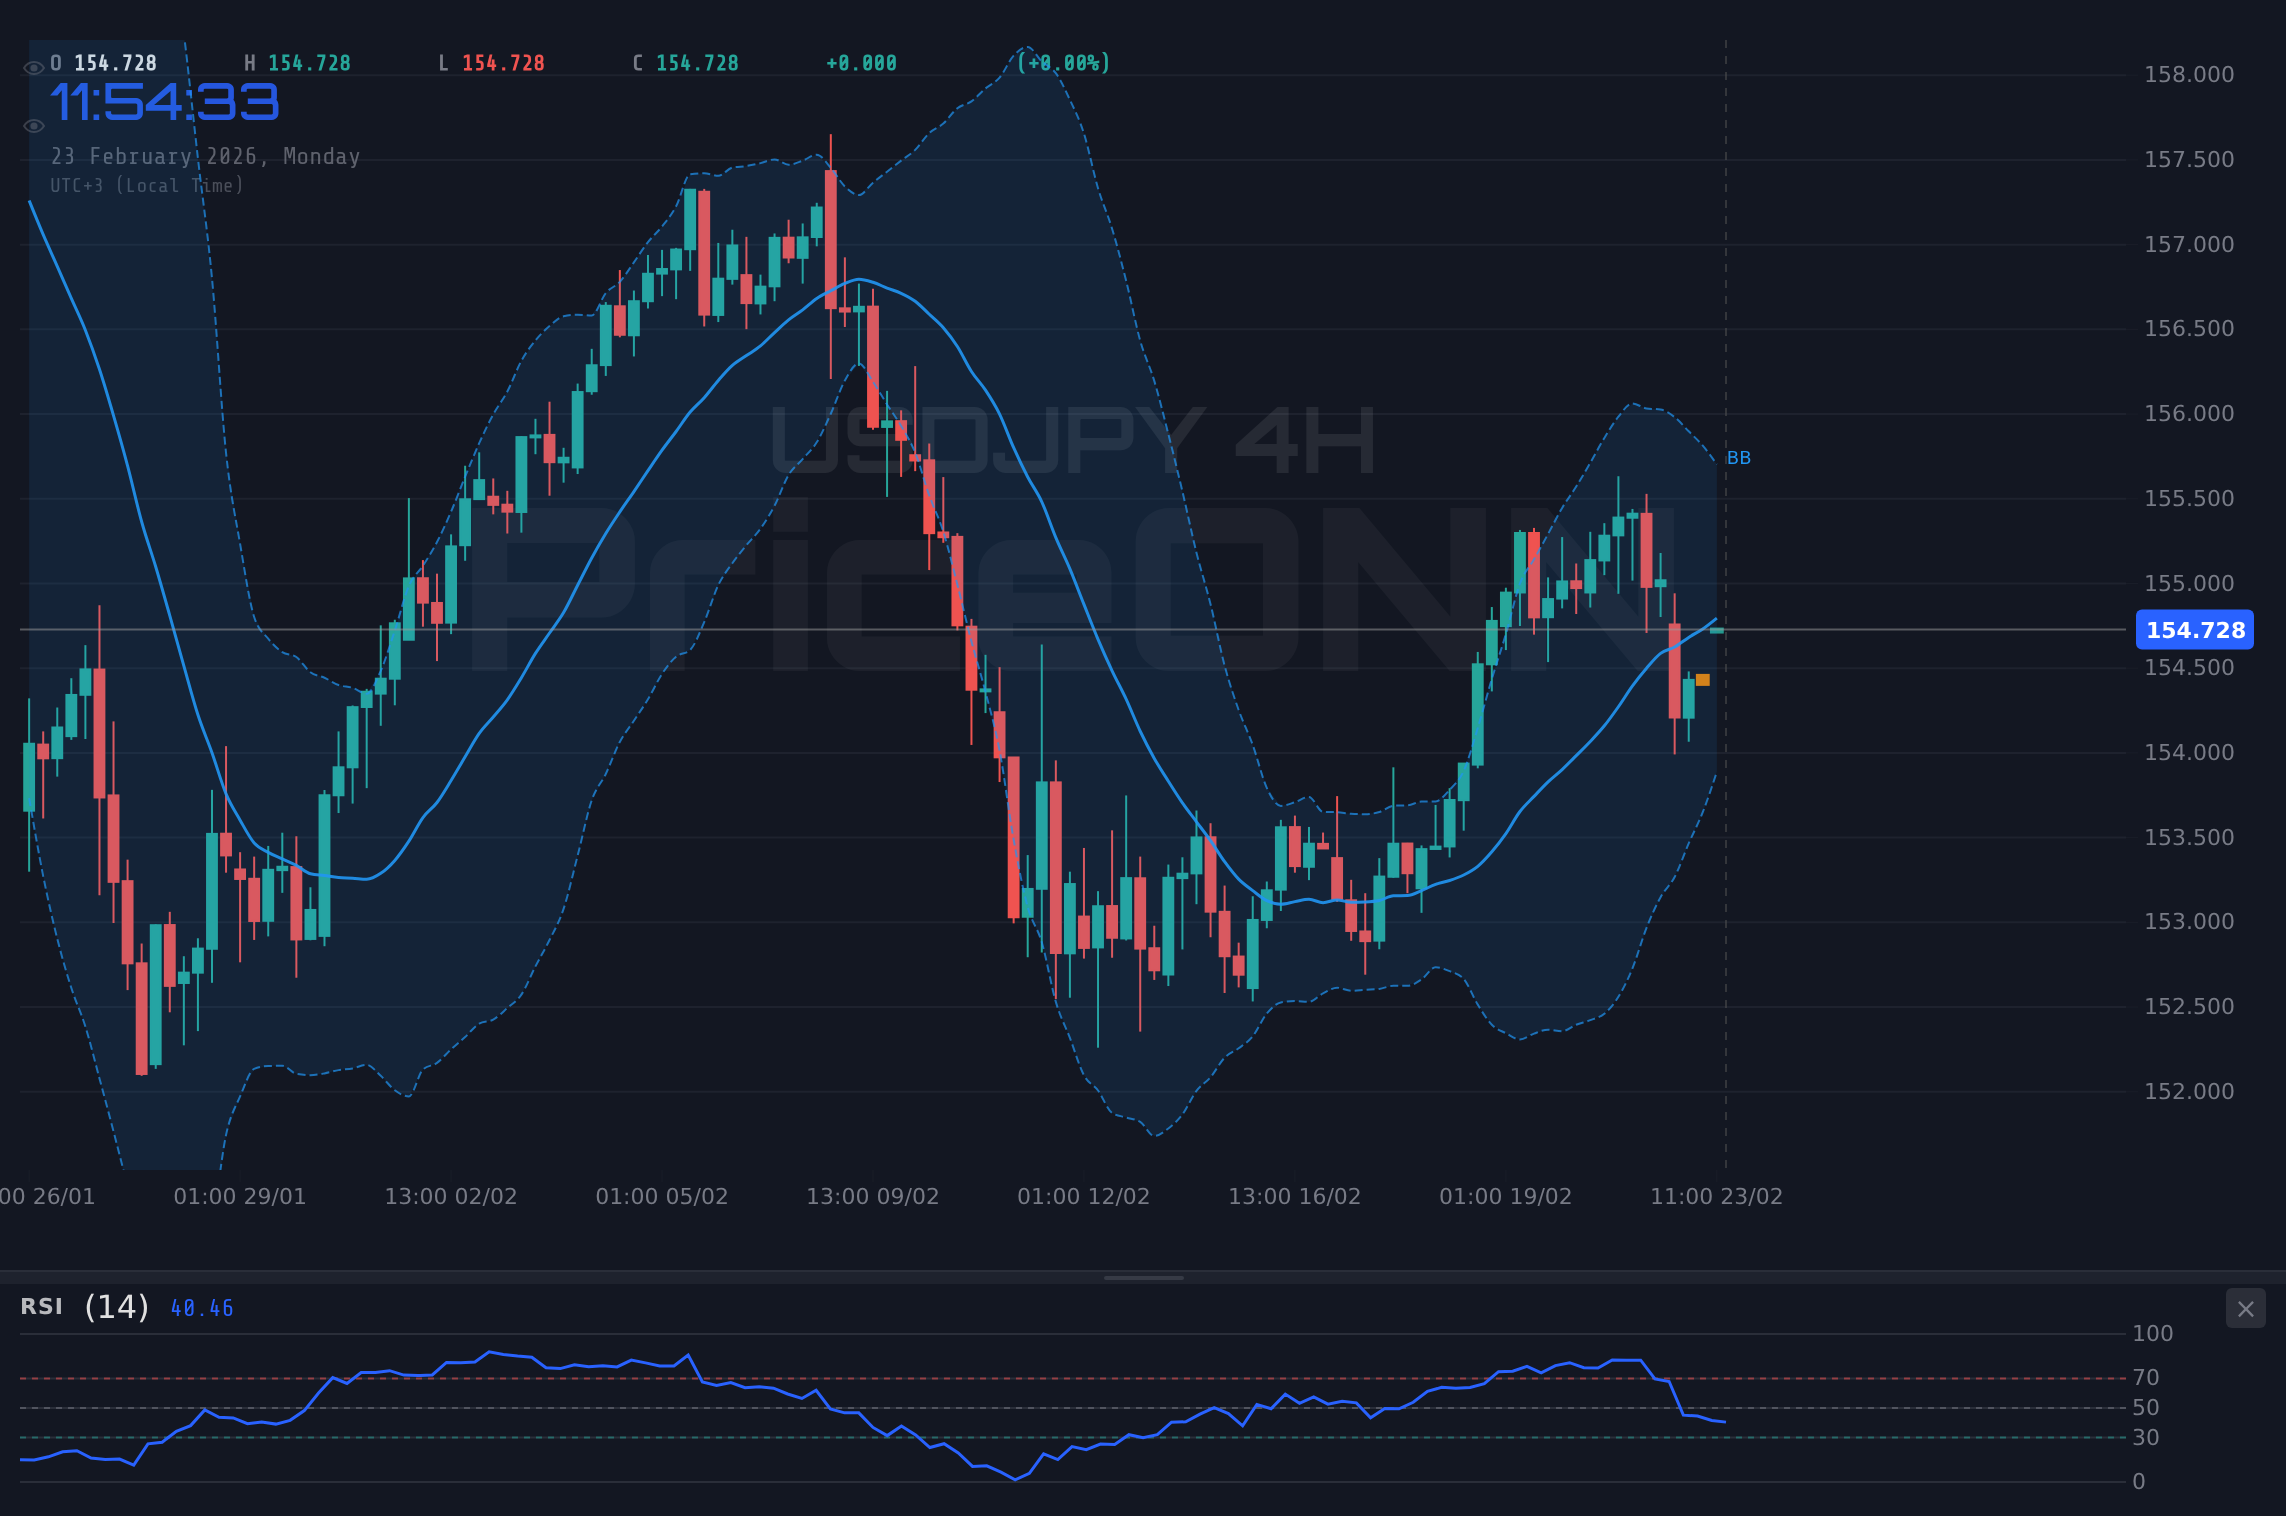
The USD/JPY pair has shown notable volatility in recent sessions, with the current price standing at $154.75. This level is significant as it marks a psychological barrier for many traders. As the DXY has risen, the implications for USD/JPY become evident: a stronger dollar typically pressures major currencies, including the yen.
- DXY Movement: Currently at 97.37, signaling strength in the dollar.
- Market Sentiment: Risk appetite appears to be stabilizing, influencing USD/JPY positively.
- Geopolitical Factors: Ongoing tensions in Asia could create safe haven demand for the yen.
Technical Analysis
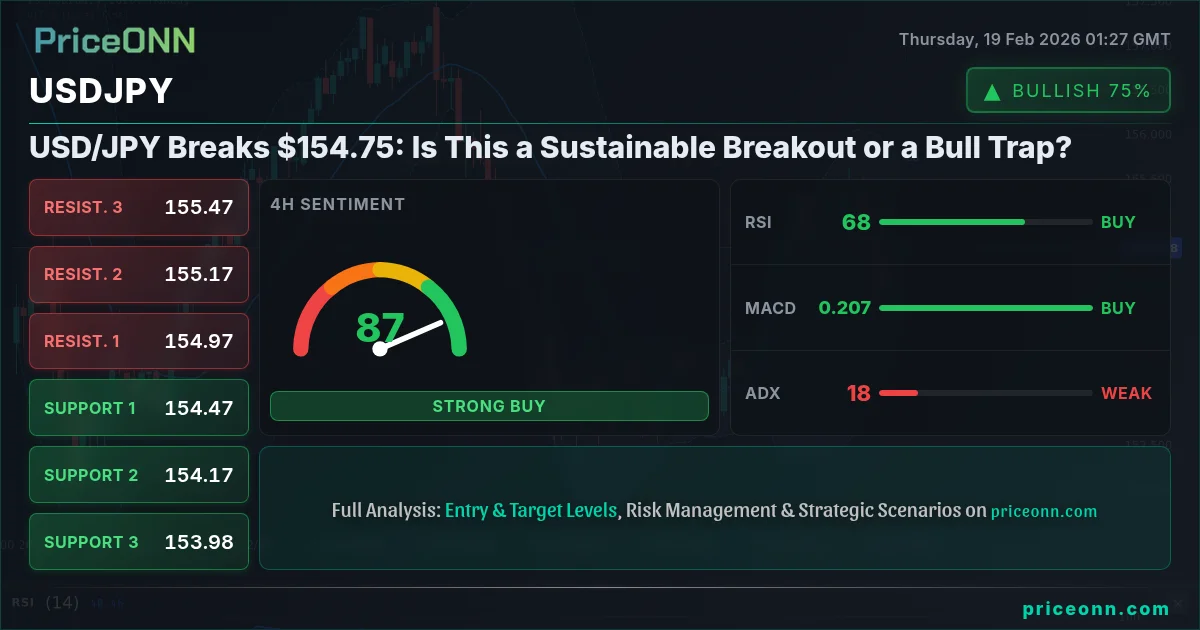
The technical indicators for USD/JPY present a mixed picture:
Despite the bullish momentum indicated by MACD, the high RSI suggests that the pair may be overbought. Traders should be cautious of potential pullbacks.
Key Support and Resistance Levels
Trade Planning
Trade Plan
Scenario A: Trend Continuation (Main)
- Direction: Long
- Entry Trigger: Close above $154.80
- Target 1: $155.00 (~25 pips)
- Target 2: $155.20 (~45 pips)
- Stop/Invalidation: Close below $154.50
Scenario B: Pullback Reaction (Alternative)
- Condition: Hold above $154.64 + RSI divergence
- Entry Trigger: Close above $154.80 + increased volume
- Target: $155.20
- Invalidation: Close below $154.50
News Risk: Upcoming economic data releases may increase volatility. Consider reducing position size ahead of announcements.
The USD/JPY pair is at a pivotal moment, currently trading at $154.75. As the market navigates through these levels, investors must remain vigilant and prepared for potential volatility. The combination of technical signals indicates a complex landscape-both an opportunity and a risk await those ready to act.
Track markets in real-time
AI-powered analysis, technical indicators and real-time price data.
Join Our Telegram Channel
Breaking market news, AI analysis and trading signals instantly.
Join Channel