Weekly Market Outlook - Week 12 (March 16, 2026 – March 20, 2026): CPI Impact, Dollar Strength, Oil Consolidation
Week 12 (March 16, 2026 – March 20, 2026) market outlook: US CPI data will drive markets. Dollar strength is expected. Oil to consolidate. Full technical analysis and key levels inside.
Weekly Market Outlook: March 16, 2026 – March 20, 2026 (Week 12)
Executive Summary
The upcoming week (Week 12, March 16-20, 2026) will likely be dominated by the release of US CPI data, which could significantly impact the US dollar and risk sentiment. Continued dollar strength is anticipated, potentially putting pressure on other major currencies and precious metals. Oil prices will likely consolidate gains made amid ongoing geopolitical tensions, with traders monitoring supply disruptions and demand forecasts. Equity markets could remain volatile, reacting to economic data and geopolitical developments.
The Dollar Index (DXY) closed at 100.20, showing strong bullish momentum. The daily RSI is at 74.7, indicating overbought conditions, but the 1H and 4H RSI values are also elevated, suggesting continued buying pressure. The MACD histogram is positive across all timeframes, supporting the bullish outlook. Traders will be watching for a potential breakout above the 100.30 resistance level. A pullback towards the 99.58 level could present a buying opportunity. Overall, the DXY is expected to maintain its upward trajectory, driven by safe-haven demand and potentially hawkish signals from economic data.
EUR/USD closed at 1.14174, signaling continued weakness. The RSI is deeply oversold on the 1H, 4H, and daily charts (23.1, 31.1, and 23.6 respectively). The MACD histogram is negative or neutral across all timeframes. The pair will likely face downward pressure, potentially testing the 1.1400 support level. A break below this level could lead to further declines. Resistance is expected around 1.15307 (pivot level). Any rallies will likely be short-lived, given the strong dollar and bearish technical indicators.
GBP/USD closed at 1.32218, indicating bearish sentiment. The RSI is below 40 across all timeframes, suggesting further downside potential. The MACD histogram is negative or neutral. The pair will likely test the 1.3200 support level. If this level breaks, further declines towards 1.3100 could occur. Resistance is found near the 1.33605 (pivot). Traders should monitor the daily bulletin for potential shorting opportunities.
USD/JPY closed at 159.74, showing strong bullish momentum. The RSI is in overbought territory on the daily chart (70.1), but the 1H and 4H RSI values are also elevated, suggesting continued buying pressure. The MACD histogram is positive. The pair will likely continue its upward trajectory, potentially testing the 160.00 level. Support is expected around 159.10 (pivot). Traders should be cautious of potential pullbacks, given the overbought conditions.
AUD/USD closed at 0.69811, indicating bearish sentiment. The RSI is below 50 on the 1H, 4H, and daily charts. The MACD histogram is negative or neutral. The pair will likely face downward pressure, potentially testing the 0.69516 support level. Resistance is expected around 0.71003 (pivot level). The overall trend is bearish, suggesting further declines.
NZD/USD closed at 0.57750, showing significant weakness. The RSI is below 40 across all timeframes. The MACD histogram is negative or neutral. The pair will likely test the 0.57601 support level. Resistance is expected around 0.58694 (pivot level). The bearish sentiment is expected to persist.
Gold closed at $5,021.73, continuing its decline. The RSI is below 50 on the daily chart (47.9) and oversold on the 1H chart (28.5), suggesting further downside potential. The MACD histogram is negative across all timeframes. Gold could test the $5,000 level. A break below this psychological level could lead to further declines towards $4,972.12 (S2). Resistance is expected around $5,108.45 (pivot). Traders should monitor the dollar's movement and inflation data for potential catalysts. Consider reviewing the chart analysis for detailed trading strategies.
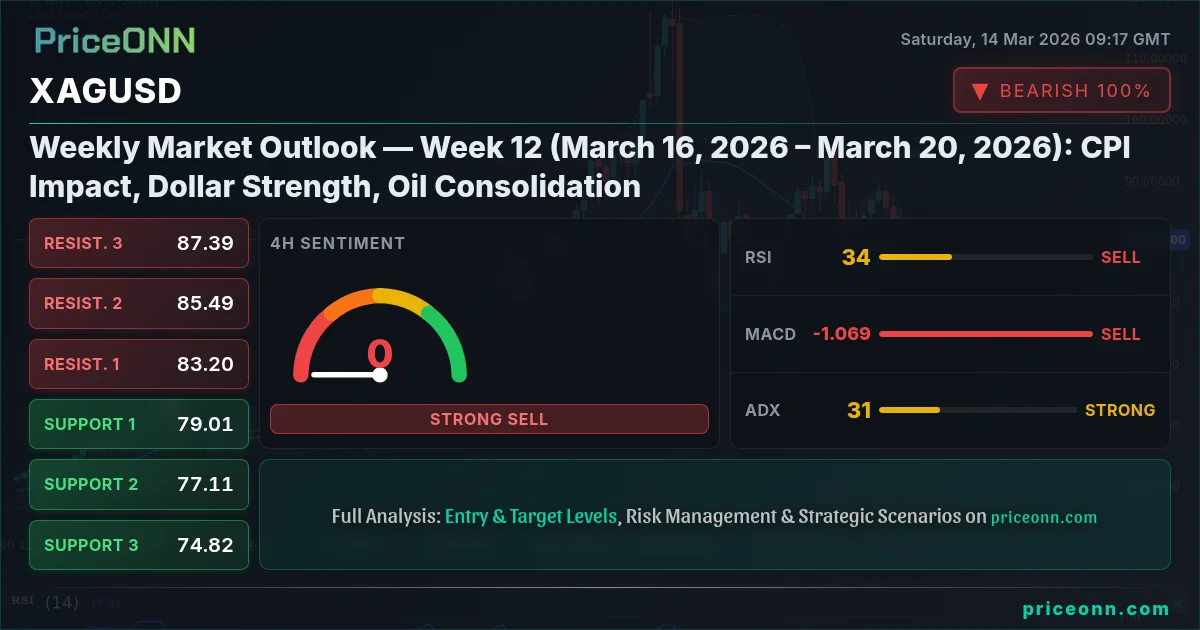
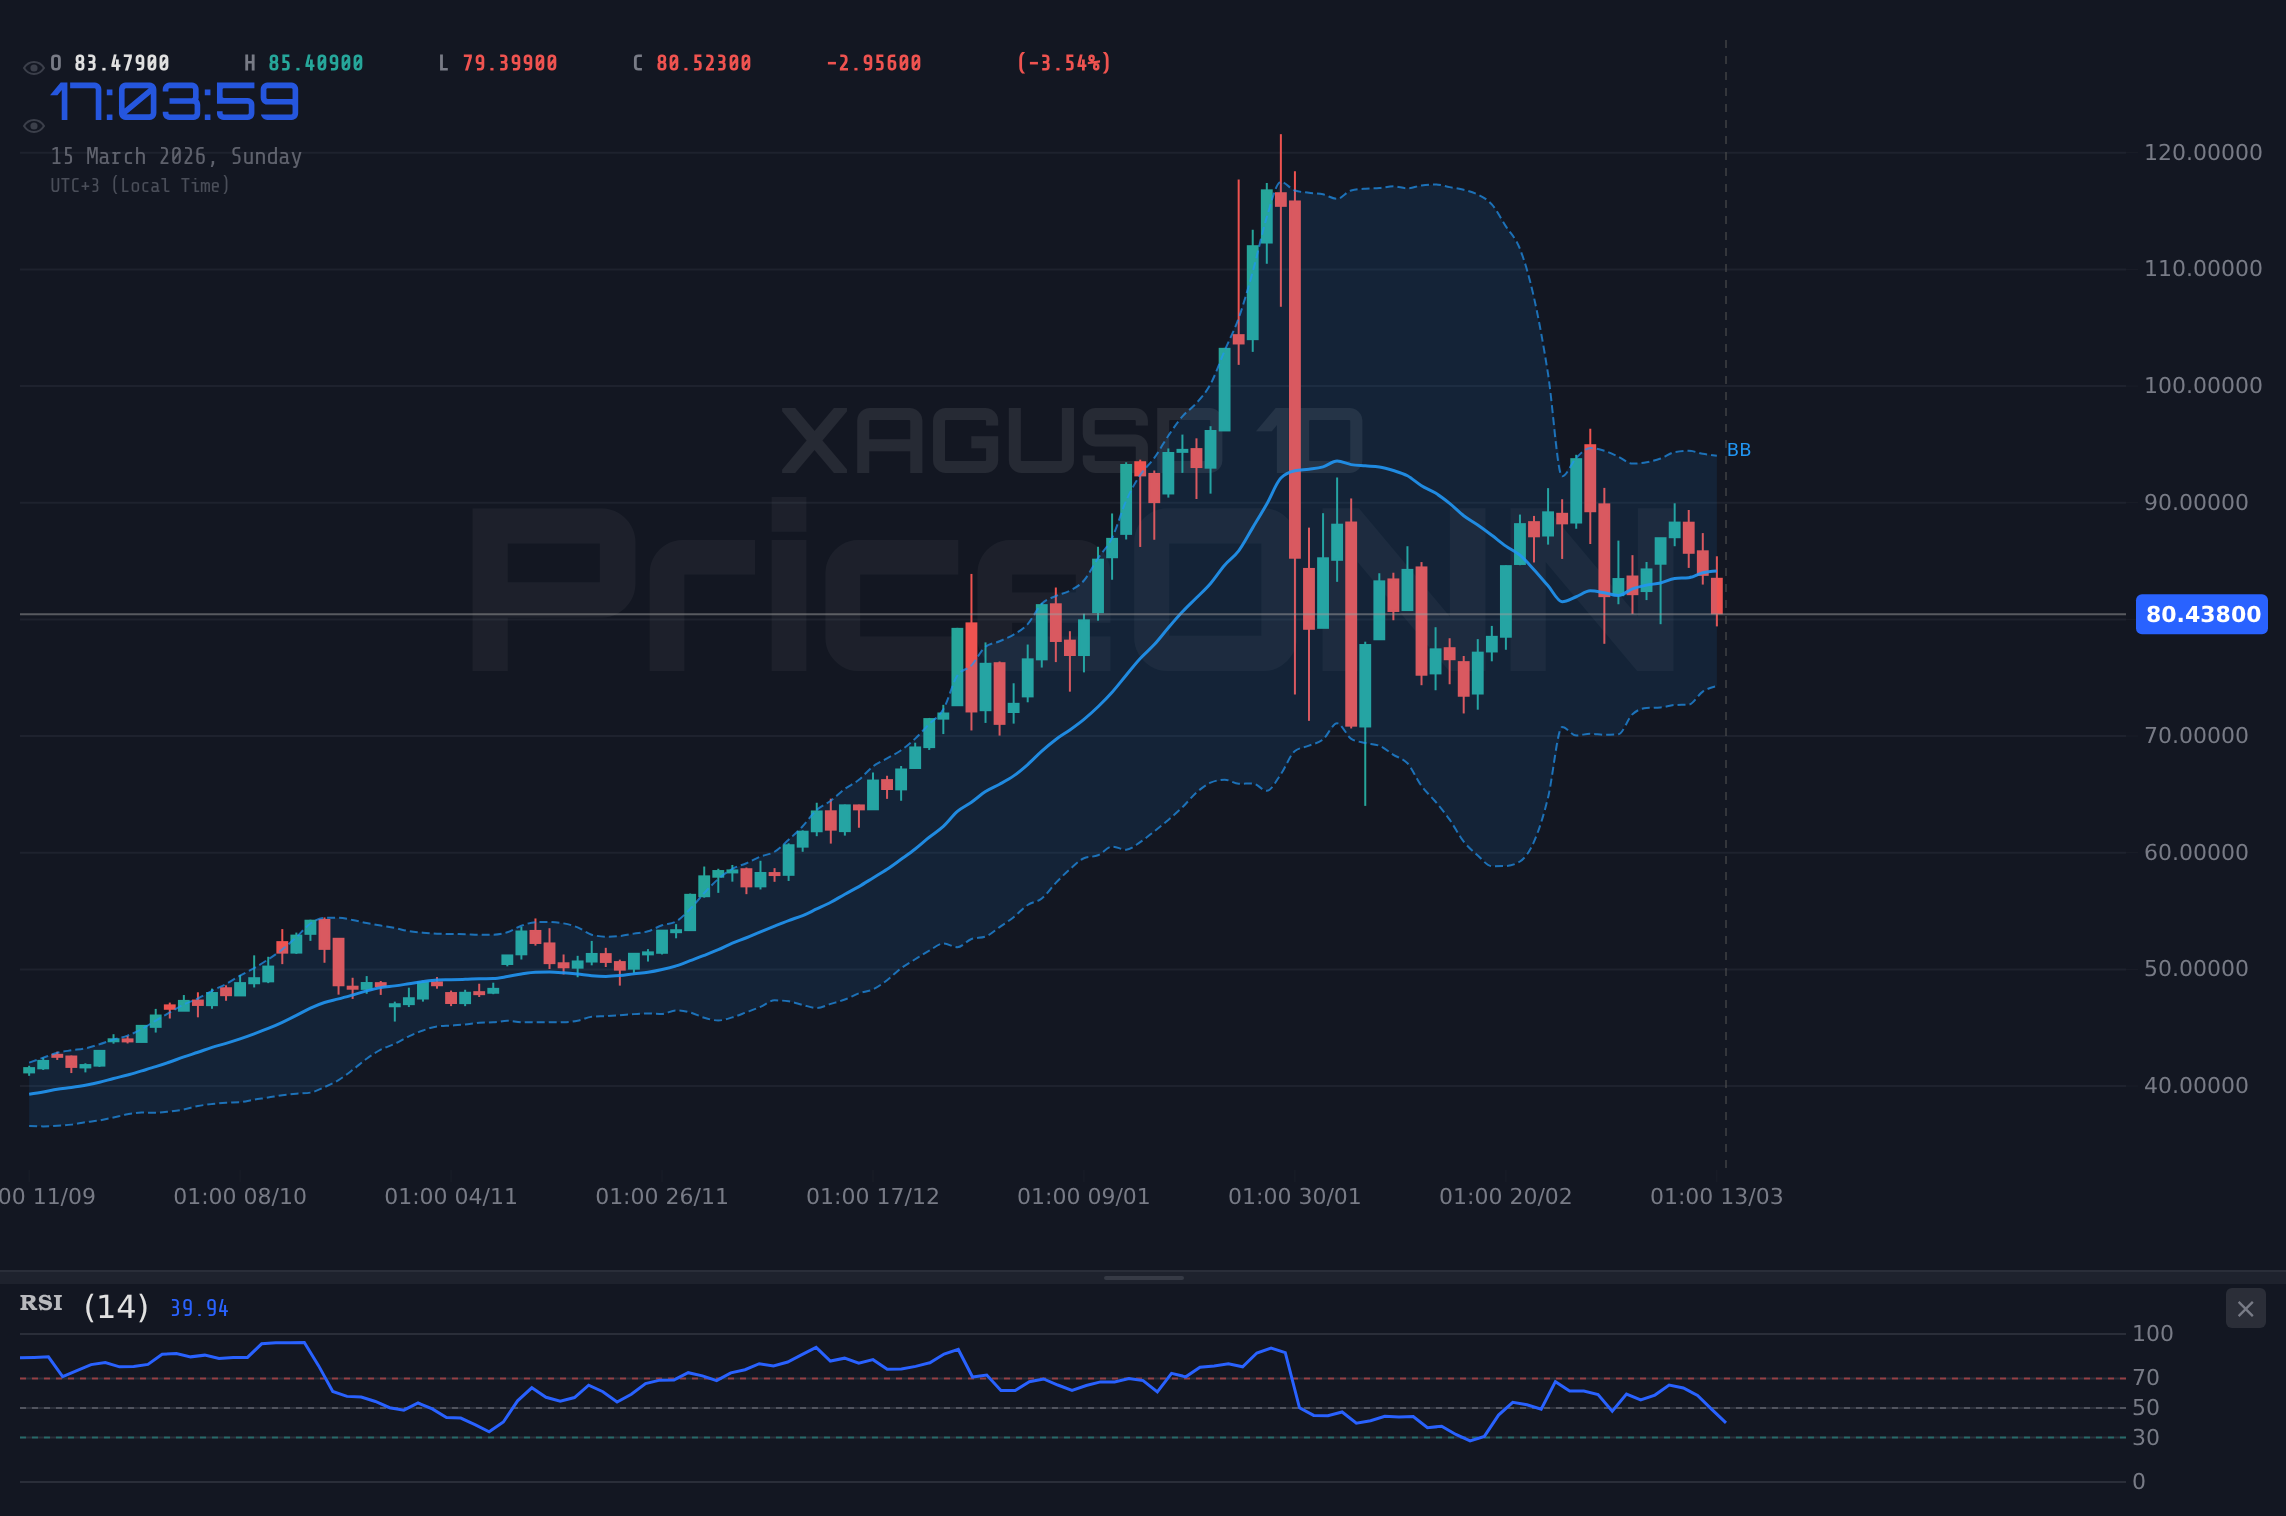
Silver closed at $80.578, experiencing a significant drop. The RSI is below 50 on the daily chart (45.4) and oversold on the 1H chart (33.1). The MACD histogram is negative. Silver could test the $80.00 level. A break below this level could lead to further declines towards $77.66 (S3). Resistance is expected around $84.73 (pivot). Like gold, silver will likely be sensitive to dollar strength and inflation data.
Brent crude closed at $103.82, showing strong bullish momentum. The RSI is in overbought territory on the daily chart (87.4). The MACD histogram is positive. Brent could test the $105.00 level. Support is expected around $99.54 (pivot). Traders should monitor geopolitical tensions and supply disruptions for potential catalysts.
WTI crude closed at $99.18, also showing strong bullish momentum. The RSI is in overbought territory on the daily chart (82.9). The MACD histogram is positive. WTI could test the $100 level. Support is expected around $93.99 (pivot). Similar to Brent, geopolitical tensions and supply disruptions will likely drive price action. Active trading signals indicate a buy signal on the daily timeframe, though the strength is only 30%.
Bitcoin closed at $70,670, experiencing a slight decline. The RSI is around 50 on the daily chart (51.9). The MACD histogram is positive on the daily timeframe but negative on the 1H chart. Bitcoin could consolidate around this level. Support is expected around $69,444 (S1). Resistance is expected around $73,344 (R1). Traders should monitor overall market sentiment and regulatory news for potential catalysts.
Ethereum closed at $2,075.44, also experiencing a slight decline. The RSI is around 50 on the daily chart (50.7). The MACD histogram is positive on the daily timeframe but negative on the 1H chart. Ethereum could consolidate around this level. Support is expected around $2,034.00 (S1). Resistance is expected around $2,187.21 (R1). Similar to Bitcoin, traders should monitor market sentiment and regulatory news.
The S&P 500 closed at 6,625, showing bearish sentiment. The RSI is below 40 on the daily chart (33.6). The MACD histogram is negative. The index could test the 6,600 level. Resistance is expected around 6,703 (pivot). Economic data and geopolitical developments will likely drive price action. The sentiment is strongly bearish based on multi-timeframe analysis.
The Nasdaq 100 closed at 24,337, showing bearish sentiment. The RSI is below 40 on the daily chart (39.8). The MACD histogram is negative. The index could test the 24,200 level. Resistance is expected around 24,651 (pivot). Technology sector news and economic data will likely be key drivers.
The Dow Jones 30 closed at 46,503, indicating bearish sentiment. The RSI is below 30 on the daily chart (27.4), suggesting oversold conditions, but the overall trend is bearish. The MACD histogram is negative. The index could test the 46,200 level. Resistance is expected around 46,903 (pivot). Traders should monitor economic data and corporate earnings reports.
Resistance
Price
R3
47,806
R2
47,563
R1
47,146
Pivot
46,903
Support
Price
S1
46,486
S2
46,243
S3
45,826
Fib 61.8%
48,902
Economic Calendar Preview
US CPI (YoY) (Feb) - Tuesday, March 17, 2026 13:30 UTC
Forecast: 2.9% | Previous: 3.1%
Scenario
Condition
Expected Impact
Better than expected
Actual > 2.9%
USD strengthens - Higher inflation than expected could prompt the Federal Reserve to maintain a hawkish stance, supporting the dollar.
In line with forecast
Actual ≈ 2.9%
Neutral reaction
Worse than expected
Actual
USD weakens - Lower inflation than expected could prompt the Federal Reserve to adopt a more dovish stance, weakening the dollar.
US PPI (YoY) (Feb) - Wednesday, March 18, 2026 13:30 UTC
Forecast: 1.8% | Previous: 2.0%
Scenario
Condition
Expected Impact
Better than expected
Actual > 1.8%
USD strengthens - Higher producer prices than expected might signal future inflationary pressures, leading to a stronger dollar.
In line with forecast
Actual ≈ 1.8%
Neutral reaction
Worse than expected
Actual
USD weakens - Lower producer prices than expected might alleviate inflationary concerns, potentially weakening the dollar.
Weekly Trading Bias
US Dollar: Bullish, driven by safe-haven demand and potentially hawkish economic data.
Forex Majors (EUR/USD, GBP/USD, AUD/USD, NZD/USD): Bearish, facing pressure from dollar strength.
USD/JPY: Bullish, but traders should be cautious of potential pullbacks due to overbought conditions.
Precious Metals (Gold, Silver): Bearish, sensitive to dollar strength and inflation data.
Energy Markets (Brent, WTI): Neutral to Bullish, consolidating gains amid geopolitical tensions.
Cryptocurrencies (BTC, ETH): Neutral, consolidating around current levels, awaiting fresh catalysts.
Stock Indices (S&P 500, Nasdaq, Dow Jones): Bearish, reacting to economic data and geopolitical developments.
Overall risk appetite is expected to be subdued, with traders closely monitoring economic data and geopolitical events. Dollar strength will likely be a dominant theme throughout the week.
Disclaimer: This content is for informational and educational purposes only and does not constitute investment advice, financial recommendation, or an offer to buy or sell any financial instrument. Past performance does not guarantee future results. Always do your own research and consult a licensed financial advisor before making investment decisions.
Track markets in real-time
AI-powered analysis, technical indicators and real-time price data.
We are looking for writers who produce market analysis, macro commentary, and data-driven content. Reach readers in 10 languages through our multilingual publishing platform.