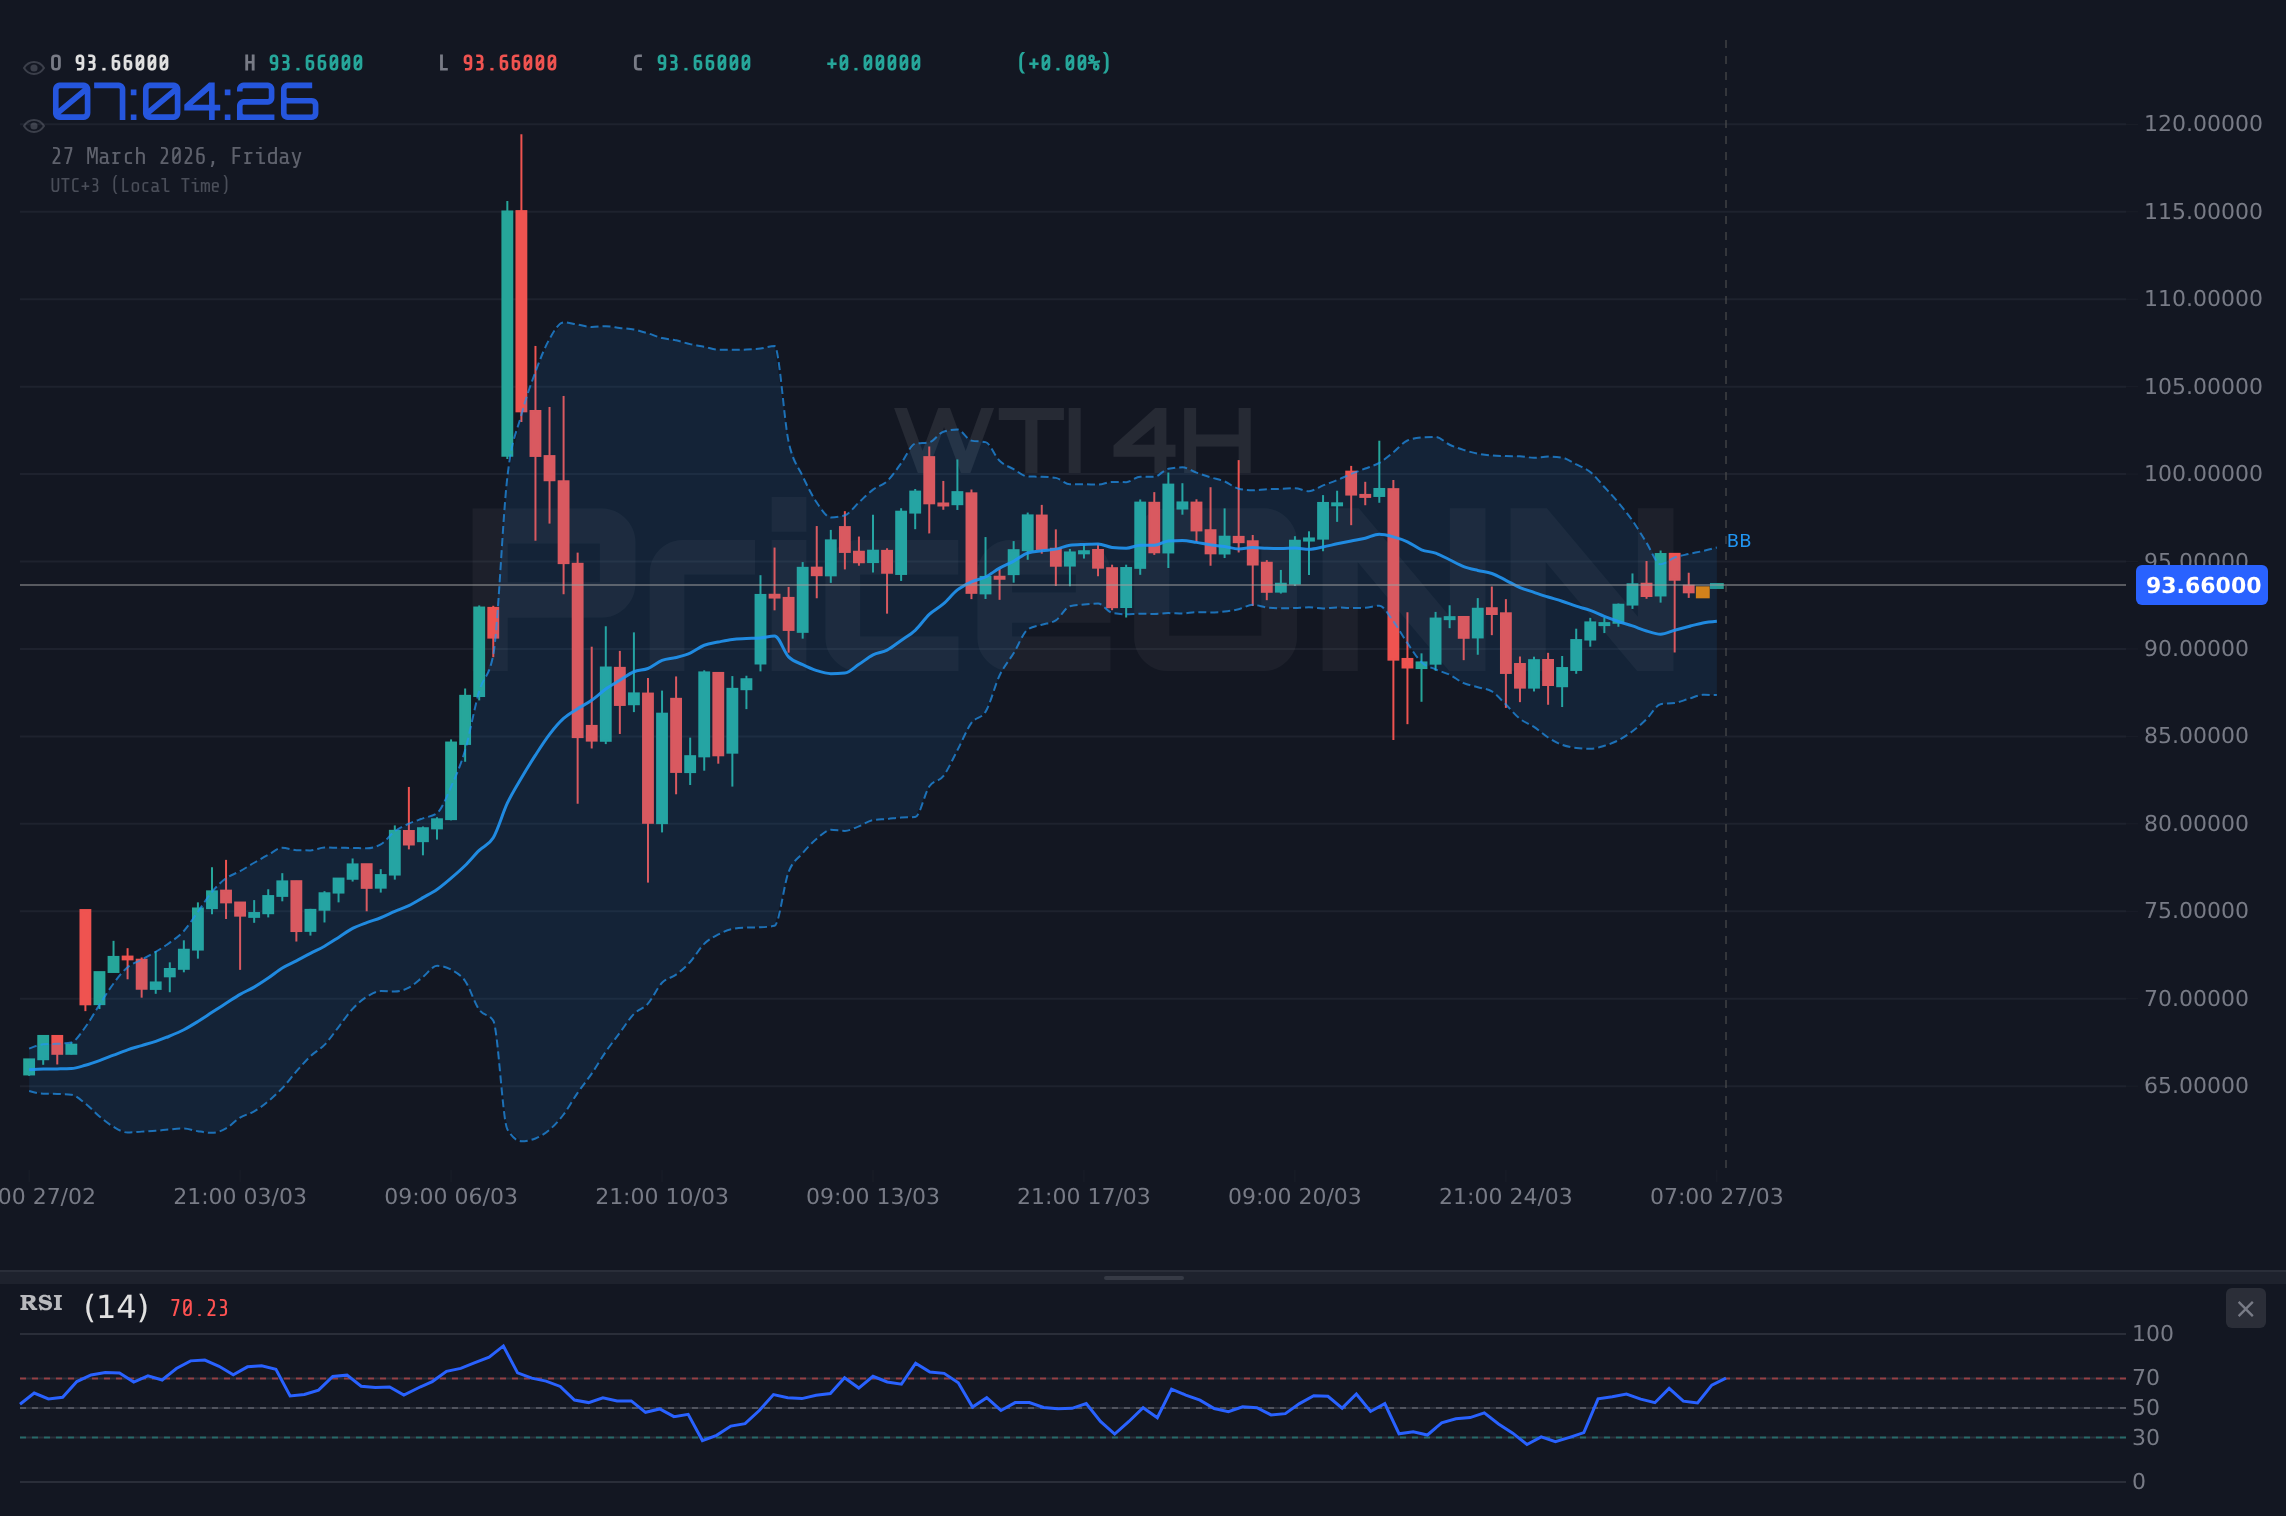
إن الارتفاع المستمر لمؤشر الدولار الأمريكي (DXY)، الذي يختبر حاليًا علامة 99.90، بالإضافة إلى تسارع ضعف الين مع اقتراب زوج USD/JPY من مستوى 160.00 القوي، يخلق رياحًا معاكسة كبيرة عبر الأسواق العالمية. هذا التقاء للقوى الاقتصادية الكلية يؤثر بشكل خاص على السلع، حيث يتداول النفط الخام WTI حاليًا في نطاق ضيق حول 93.82 دولار. في حين أن الرسم البياني اليومي يرسم صورة لاتجاه هبوطي قوي مع مؤشر ADX عند 31.09، فإن الصورة على المدى القصير أكثر دقة. يظهر الرسم البياني للساعة الواحدة اتجاهًا محايدًا مع مؤشر ADX عند 16.94 فقط، مما يسلط الضوء على سوق عالق بين إشارات متعارضة وينتظر محفزًا اتجاهيًا أوضح. هذا هو بالضبط المكان الذي يثبت فيه المتداولون ذوو الخبرة جدارتهم – التنقل في الضوضاء والانتظار للإعداد المناسب.
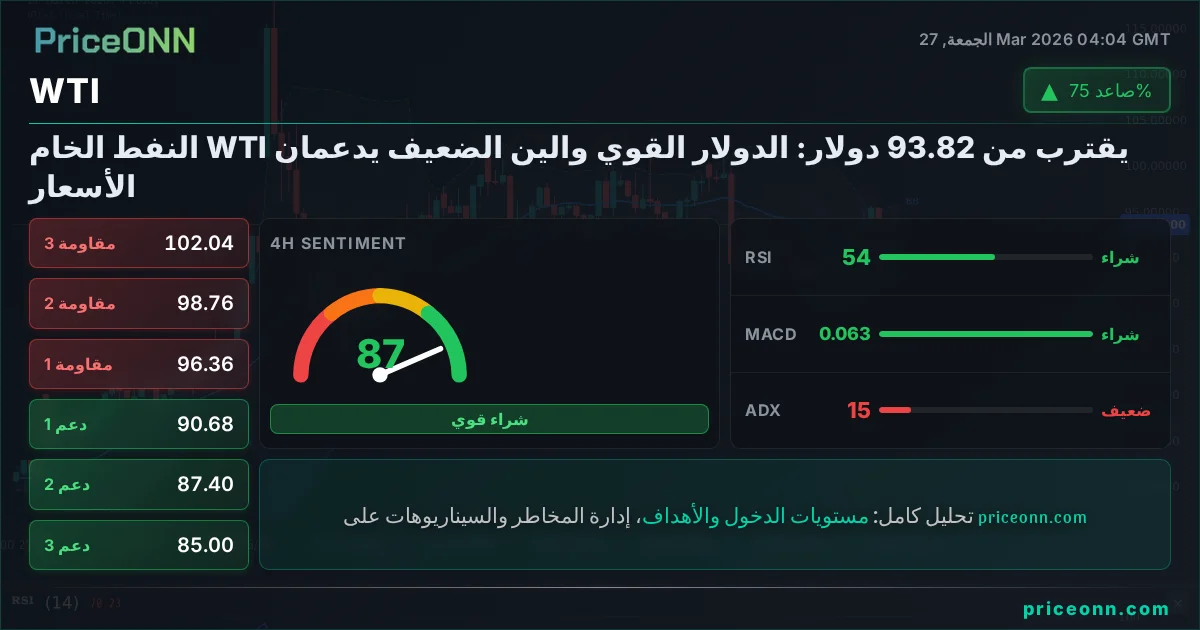
- يتداول النفط الخام WTI حول 93.82 دولار، متأثرًا بقوة الدولار (DXY عند 99.65) وضعف الين (USD/JPY بالقرب من 159.70).
- يُظهر الاتجاه اليومي لـ WTI اتجاهًا هبوطيًا قويًا (ADX 31.09)، لكن الرسوم البيانية قصيرة الأجل تشير إلى توطيد (ADX للساعة الواحدة 16.94).
- يقع الدعم الرئيسي لـ WTI عند 92.67 دولار، مع مقاومة عند 94.10 دولار على الرسم البياني للساعة الواحدة.
- السوق في "منطقة مراقبة" بسبب الظروف المتقلبة (ADX 14.55 على الرسم البياني لأربع ساعات)، مما يتطلب الصبر للحصول على إعداد تداول واضح.
تُعد بيئة السوق الحالية للنفط الخام WTI مثالًا كلاسيكيًا لإعداد "منطقة مراقبة"، كما يشير انخفاض قراءة ADX عند 14.55 على الرسم البياني لأربع ساعات. هذا يشير إلى نقص في الزخم الاتجاهي القوي، مما يجعل أي قرارات تداول محفوفة بالمخاطر بطبيعتها. في حين أن المؤشرات اليومية ترسم صورة سلبية مع مؤشر ADX عند 31.09 ومؤشر RSI عند 33.18، فإن مؤشرات التذبذب قصيرة الأجل تقدم إشارات مختلطة. على سبيل المثال، يُظهر الرسم البياني للساعة الواحدة اتجاهًا محايدًا مع مؤشر ADX عند 16.94 ومؤشر RSI يحوم حول 53.94. هذا التباين عبر الأطر الزمنية يعني أن المشترين والبائعين عالقون حاليًا في صراع. لكي يظهر تداول واضح، نحتاج إلى رؤية اختراق حاسم والثبات فوق المقاومة الرئيسية أو رفض قوي والسقوط دون الدعم الحاسم. حتى ذلك الحين، الصبر أمر بالغ الأهمية. السوق يخبرنا بالانتظار للتأكيد، وليس القفز في المعركة قبل الأوان.
يرتبط السرد الذي يقود عدم اليقين الحالي لـ WTI ارتباطًا وثيقًا بالمشهد الاقتصادي الكلي الأوسع. كان مؤشر الدولار الأمريكي (DXY) في صعود، مرتفعًا لثلاثة أيام متتالية ويقترب من علامة 99.90. هذه القوة، كما تظهر في البيانات عند 99.65، تمارس عادة ضغطًا هبوطيًا على السلع المقومة بالدولار مثل النفط. عندما يقوى الدولار، يصبح شراء النفط أكثر تكلفة لحاملي العملات الأخرى، مما يقلل الطلب. في الوقت نفسه، يعاني الين الياباني من ضعف كبير، مما يدفع زوج USD/JPY نحو مستوى 160.00 الحرج. غالبًا ما يرتبط هذا الانخفاض في قيمة الين، مع تداول زوج USD/JPY بالقرب من 159.70، بزيادة شهية المخاطرة أو، في هذه الحالة، الهروب إلى الدولار كأصل آمن وسط حالة عدم اليقين العالمية الأوسع. يخلق مزيج الدولار القوي والين الضعيف بيئة معقدة لأسعار النفط، حيث قد يتم مواجهة الطلب المعتاد على السلع كأصول آمنة بقوة الدولار.
حالة الارتداد لـ WTI: المشترون يستهدفون 94.10 دولار
على الرغم من الشعور السلبي السائد في الرسوم البيانية اليومية، هناك بصيص أمل للمشترين، يتركز بشكل أساسي حول المؤشرات الفنية قصيرة الأجل. على الرسم البياني للساعة الواحدة، يُظهر WTI اتجاهًا محايدًا مع مؤشر ADX عند 16.94، مما يشير إلى أن الزخم على المدى القصير يمكن أن يتغير. مؤشر RSI(14) عند 53.94، على الرغم من أنه لا يشير إلى ظروف ذروة الشراء، يتجه صعودًا، مما يوحي باهتمام شراء محتمل. علاوة على ذلك، يُظهر مؤشر MACD زخمًا إيجابيًا، مع تداول خط MACD فوق خط الإشارة الخاص به. هذه القوة قصيرة الأجل حاسمة لأنها تمهد الطريق لاختراق محتمل إذا تزامنت العوامل الخارجية بشكل إيجابي. مستوى المقاومة الفوري الذي يجب مراقبته على الرسم البياني للساعة الواحدة هو 94.10 دولار. إغلاق حاسم فوق هذا المستوى، مدعومًا بزيادة الحجم وربما تخفيف مؤشر DXY، يمكن أن يؤدي إلى ارتفاع في تغطية المراكز المدينة. من المرجح أن يستهدف مثل هذه الحركة المقاومة التالية عند 94.63 دولار وربما نحو 95.53 دولار. مؤشر Stochastic، مع K عند 64.82 و D عند 65.41، يقترب أيضًا من منطقة ذروة الشراء، مما قد يشير إلى دفعة صعودية قصيرة الأجل قبل أي انعكاس محتمل.
تعتمد قصة سيناريو WTI الصعودي على عدد قليل من التطورات الفنية والأساسية الرئيسية. أولاً، تحتاج القوة قصيرة الأجل الفورية إلى ترجمتها إلى حركة مستدامة. يُظهر الرسم البياني للساعة الواحدة أن الدعم صامد عند 92.67 دولار، 91.77 دولار، و 91.24 دولار. طالما بقيت هذه المستويات سليمة، فإن المشترين لديهم فرصة. الاختراق فوق مقاومة الساعة الواحدة عند 94.10 دولار هو العقبة الأولى. إذا حدث ذلك، يمكن أن يتغير مزاج السوق بسرعة. رأينا أخبارًا تشير إلى أن متوسط أسعار البنزين الوطنية في الولايات المتحدة قد ارتفع، مما قد يدعم أسعار النفط نظريًا. ومع ذلك، تُظهر البيانات الحالية أن التغيير اليومي لـ WTI سلبي (-0.15٪)، مما يشير إلى أن هذا الارتفاع في أسعار البنزين لم يُترجم بعد إلى أسعار نفط أعلى. يحتاج المشترون إلى التغلب على الاتجاه الهبوطي الأوسع، وهو تحدٍ كبير. مؤشر ADX في الرسم البياني اليومي عند 31.09 يشير بوضوح إلى وجود اتجاه هبوطي قوي، ويتطلب الارتداد قصير الأجل زخمًا كبيرًا لتحدي هذا.
من منظور هيكل السوق، يبحث المشترون عن تأكيد بأن حركة السعر الأخيرة حول 93.82 دولار هي مجرد توطيد مؤقت وليست مقدمة لمزيد من الانخفاض. حقيقة أن WTI يتداول حاليًا ضمن نطاقه اليومي البالغ 92.30 دولار - 94.36 دولار تشير إلى ساحة معركة. إذا تمكن المشترون من التدخل بحسم عند الطرف الأدنى من هذا النطاق، وتحديدًا بالقرب من مستوى الدعم 92.67 دولار، ودفع الأسعار إلى الأعلى، فسوف يبطل ذلك الضغط الهبوطي الفوري. الزخم الإيجابي الذي شوهد في مؤشر MACD للساعة الواحدة هو دليل حاسم للمشترين. ومع ذلك، يتعارض هذا حاليًا مع الزخم السلبي على الرسوم البيانية لأربع ساعات ويومية. للانعكاس الصعودي الحقيقي، سنحتاج إلى رؤية تحول كبير في هذه المؤشرات طويلة الأجل، ربما مصحوبًا بتباعد واضح أو تقاطع صعودي على مؤشر MACD اليومي، وهو ما لا يتوفر حاليًا. يجب على المشترين التعامل مع حقيقة أن الاتجاه العام هبوطي، وأن أي ارتفاع قد يكون تشكيل "علم دب" قبل المزيد من الانخفاضات.
الحالة السلبية لـ WTI: البائعون يستهدفون 92.67 دولار وسط قوة الدولار
الحجة السلبية للنفط الخام WTI مقنعة، مدفوعة بشكل أساسي بقوة الدولار الأمريكي والاتجاه الهبوطي العام الذي تشير إليه مؤشرات فنية طويلة الأجل. مؤشر DXY حاليًا عند 99.65 ويُظهر زخمًا صعوديًا، والذي يرتبط تاريخيًا بانخفاض أسعار النفط. يتفاقم هذا بسبب ضعف الين، مع اقتراب زوج USD/JPY من مستوى 160.00. تشير هذه الخلفية الاقتصادية الكلية إلى أن رأس المال يتدفق نحو الدولار، ربما على حساب الأصول الأكثر خطورة والسلع. على الصعيد الفني، يقدم الرسم البياني اليومي صورة سلبية واضحة: مؤشر ADX عند 31.09 يعني اتجاهًا هبوطيًا قويًا، ومؤشر RSI عند 33.18 في المنطقة المحايدة العميقة ولكنه يتجه نحو الانخفاض، مما يشير إلى مجال لمزيد من الانخفاضات. مؤشر MACD في الرسم البياني اليومي أيضًا أقل من خط الإشارة الخاص به، مما يعزز الزخم السلبي. مستوى الدعم الفوري على الرسم البياني للساعة الواحدة هو 92.67 دولار. اختراق هذا المستوى سيكون إشارة سلبية كبيرة، ومن المحتمل أن يؤدي إلى تفعيل أوامر وقف الخسارة وتسريع الحركة نحو 91.77 دولار وربما 91.24 دولار.
يضيف الرسم البياني لأربع ساعات وزنًا إضافيًا للأطروحة السلبية. هنا، يُصنف الاتجاه على أنه "Düşüş" (اتجاه هبوطي) بقوة 95٪، ومؤشر ADX عند 33.1 يؤكد اتجاهًا قويًا. مؤشر RSI(14) عند 44.2 يتجه نحو الانخفاض، ومؤشر Stochastic (٪K: 18.39، ٪D: 24.38) في منطقة ذروة البيع ولكنه يُظهر إشارة سلبية (٪K
التوترات الجيوسياسية، على الرغم من الاستشهاد بها غالبًا كعامل صعودي للنفط، إلا أنها حاليًا تتضاءل أمام قوة الدولار ومعنويات المخاطرة الأوسع. تقارير الأخبار حول ارتفاع محتمل في أسعار النفط إلى 200 دولار للبرميل بسبب المخاطر الجيوسياسية، على الرغم من كونها مقلقة، إلا أنها لم تُترجم بعد إلى ضغط شراء مستدام لـ WTI. بدلاً من ذلك، يبدو أن السوق يعطي الأولوية لجاذبية الدولار كأصل آمن. الارتفاع الأخير في متوسط أسعار البنزين الوطنية في الولايات المتحدة، بزيادة تقارب 1.00 دولار للجالون، هو عامل يمكن أن يدعم أسعار النفط عادةً. ومع ذلك، فإن التغيير اليومي لـ WTI البالغ -0.15٪ يشير إلى أن هذا لا يؤثر حاليًا على عقد العقود الآجلة الأقرب استحقاقًا. يراهن البائعون على أن الرياح الاقتصادية الكلية المعاكسة – الدولار القوي والين الضعيف – ستثبت في النهاية أنها أقوى من أي مخاوف تتعلق بالعرض على المدى القصير ناتجة عن عدم الاستقرار الجيوسياسي. المستوى الرئيسي الذي يجب مراقبته للبائعين هو اختراق دعم الساعة الواحدة عند 92.67 دولار. حركة مؤكدة دون هذا المستوى ستؤكد على الأرجح استمرار الاتجاه الهبوطي اليومي.
سيناريوهات التداول: التنقل في مياه WTI المتقلبة
السيناريو السلبي: الزخم الهبوطي يتزايد
65% احتماليةالسيناريو المحايد: توطيد حول 93.82 دولار
25% احتماليةالسيناريو الصعودي: قوة الساعة الواحدة تستمر
10% احتماليةتقدم المؤشرات الفنية حاليًا صورة متضاربة، وهي سمة نموذجية للسوق في مرحلة التوطيد. على الإطار الزمني اليومي، يشير مؤشر ADX عند 31.09 إلى اتجاه هبوطي قوي، بينما يشير مؤشر RSI عند 33.18 إلى مجال لمزيد من الانخفاض. ومع ذلك، تقدم الرسوم البيانية قصيرة الأجل منظورًا مختلفًا. يشير مؤشر ADX للساعة الواحدة عند 16.94 إلى اتجاه ضعيف، مع مؤشر RSI عند 53.94 يحوم في المنطقة المحايدة ويُظهر زخمًا صعوديًا. مؤشر Stochastic على الرسم البياني للساعة الواحدة (K=64.82، D=65.41) يقترب من مستويات ذروة الشراء، مما قد يشير إلى دفعة صعودية قصيرة الأجل. على العكس من ذلك، يُظهر الرسم البياني لأربع ساعات اتجاهًا هبوطيًا قويًا (ADX 33.1) مع مؤشر RSI عند 44.2 وإشارة Stochastic سلبية. هذا التباين يعني أنه يجب على المتداولين توخي الحذر. هناك حاجة إلى تأكيد إشارة واضحة، ويفضل أن يكون اختراقًا حاسمًا لمقاومة الساعة الواحدة الفورية عند 94.10 دولار للسيناريوهات الصعودية، أو رفضًا قويًا دون دعم الساعة الواحدة عند 92.67 دولار لاستمرار الاتجاه الهبوطي.
من منظور إدارة المخاطر، تتطلب حالة "منطقة المراقبة" الحالية نهجًا منضبطًا. نظرًا للسوق المتقلب الذي تشير إليه قراءات ADX المنخفضة على الأطر الزمنية الأقصر، فإن التداول ضد الاتجاه اليومي السائد (وهو هبوطي) يحمل مخاطر أعلى. قد تتمثل استراتيجية محتملة في الانتظار حتى يتم تأكيد اختراق مستويات الدعم أو المقاومة قصيرة الأجل الفورية. على سبيل المثال، قد يشير إغلاق يومي فوق 94.10 دولار إلى ارتفاع في تغطية المراكز المدينة، مستهدفًا مستويات أعلى. ومع ذلك، فإن احتمالية حدوث هذا السيناريو منخفضة حاليًا (10٪) نظرًا للمؤشرات الفنية الأوسع والرياح الاقتصادية الكلية المعاكسة. سيناريو أكثر احتمالًا (65٪) يتضمن انهيارًا دون 92.67 دولار، بما يتماشى مع الاتجاه اليومي وربما يؤدي إلى مزيد من ضغط البيع. السيناريو المحايد، حيث يتوطد WTI بين 92.67 دولار و 94.10 دولار، يمثل جزءًا كبيرًا من الاحتمالية (25٪) ويسلط الضوء على عدم اليقين الحالي في السوق.
يُعد الارتباط بمؤشر الدولار الأمريكي (DXY) عاملاً حاسمًا يجب مراقبته. مع وصول مؤشر DXY حاليًا إلى 99.65 ويُظهر زخمًا صعوديًا، فإنه يضع ضغطًا على WTI. إذا استمر مؤشر DXY في الصعود، ربما مدفوعًا بتشديد السياسة النقدية من قبل الاحتياطي الفيدرالي أو تصاعد المخاطر العالمية، فإنه سيحد من أي ارتفاعات في أسعار النفط. على العكس من ذلك، إذا تعثر مؤشر DXY، فقد يوفر رياحًا داعمة لا غنى عنها لـ WTI. يلعب الدولار القوي أيضًا دورًا في قصة ضعف الين، مع اقتراب زوج USD/JPY من مستوى 160. تشير هذه البيئة الاقتصادية الكلية إلى أن رأس المال يفضل الدولار كأصل آمن، والذي يمكن أن يتجاوز أحيانًا عوامل العرض/الطلب الخاصة بالسلع على المدى القصير. يجب على المتداولين مراقبة مسار مؤشر DXY عن كثب كمؤشر رائد للتحولات المحتملة في حركة سعر WTI.
يضيف تدفق الأخبار الأخير طبقة أخرى من التعقيد. تنتشر تقارير عن ارتفاع محتمل في أسعار النفط إلى 200 دولار للبرميل بسبب التوترات الجيوسياسية، ومع ذلك يتداول WTI حاليًا بالقرب من 93.82 دولار. هذا يشير إلى أن السوق إما لا يسعر بالكامل هذه المخاطر الجيوسياسية المتطرفة، أو أن قوة الدولار تعمل حاليًا كقوة أكثر هيمنة. الارتفاع في أسعار البنزين الأمريكية هو أيضًا نقطة اهتمام، لكن تأثيره على العقود الآجلة للنفط لا يزال خافتًا في الوقت الحالي. يركز البائعون على حقيقة أنه على الرغم من هذه العناوين الإخبارية الصعودية المتعلقة بالعرض، تظل حركة السعر خافتة وتتماشى مع الاتجاه الهبوطي الأوسع. غالبًا ما تشير هذه الفجوة بين العناوين الإخبارية وحركة السعر إلى أن السوق يتجاوز العناوين الفورية ويتجه نحو المحركات الاقتصادية الكلية الأكثر استمرارًا، مثل توقعات أسعار الفائدة وحركات العملات.
بالنظر إلى التقويم الاقتصادي الأوسع، كانت البيانات الاقتصادية الأمريكية الأخيرة مختلطة. جاء مؤشر مديري المشتريات الصناعي الأمريكي (Manufacturing PMI) عند 52.4، أعلى من التوقعات البالغة 51.5، مما يشير إلى بعض المرونة في قطاع التصنيع. ومع ذلك، كان مؤشر مديري المشتريات للخدمات ISM أضعف قليلاً من المتوقع عند 51.1 مقابل توقعات بلغت 52.0. تساهم هذه الأرقام في النقاش المستمر حول التوقعات الاقتصادية الأمريكية والسياسة المحتملة للاحتياطي الفيدرالي. غالبًا ما تؤدي البيانات المختلطة إلى زيادة التقلبات وعدم اليقين في الأسواق، مما يدعم بشكل أكبر سرد "منطقة المراقبة" لـ WTI. ستكون الأحداث القادمة، وخاصة أي إصدارات عالية التأثير تتعلق بالتوظيف أو التضخم، حاسمة في تشكيل توقعات السوق وربما كسر WTI من نطاقه الحالي. سيراقب المتداولون عن كثب أي علامات على تحول في توقعات سياسة الاحتياطي الفيدرالي، حيث سيؤثر ذلك بشكل كبير على كل من الدولار وأسعار السلع.
أسئلة وأجوبة: فك رموز وضع WTI الحالي في السوق
ماذا يحدث إذا كسر WTI دون مستوى الدعم 92.67 دولار؟
من المرجح أن يؤكد الاختراق دون 92.67 دولار على الرسم البياني للساعة الواحدة استمرار الاتجاه الهبوطي اليومي، حيث يتماشى مع الإشارات السلبية من الأطر الزمنية الأطول. يمكن أن يؤدي هذا إلى مزيد من البيع، مع أهداف محتملة عند 91.77 دولار و 91.24 دولار. من الناحية المثالية، سيأتي التأكيد مع زيادة الحجم وإغلاق مستمر دون هذا المستوى.
هل يجب أن أشتري WTI بالمستويات الحالية بالقرب من 93.82 دولار نظرًا للإشارات الصعودية قصيرة الأجل؟
الشراء بالمستويات الحالية محفوف بالمخاطر بسبب الاتجاه الهبوطي اليومي القوي وظروف التداول المتقلبة التي يشير إليها مؤشر ADX. في حين أن الرسم البياني للساعة الواحدة يُظهر بعض الزخم الصعودي، فإن إعدادًا ذا احتمالية أعلى سيتطلب اختراقًا مؤكدًا والثبات فوق مستوى المقاومة 94.10 دولار، أو ارتدادًا واضحًا من مستوى الدعم 92.67 دولار مع التحقق من المؤشرات طويلة الأجل.
هل مؤشر RSI عند 53.94 هو إشارة صعودية لـ WTI الآن؟
مؤشر RSI البالغ 53.94 على الرسم البياني للساعة الواحدة في المنطقة المحايدة ويُظهر بعض الزخم الصعودي، ولكنه ليس إشارة صعودية قوية بحد ذاته. يشير إلى أن اهتمام الشراء موجود ولكنه ليس مهيمنًا بعد. للحصول على إشارة صعودية مؤكدة، سنبحث عن انتقال مؤشر RSI بشكل حاسم إلى منطقة ذروة الشراء (فوق 70) أو عن تأكيده لاختراق السعر فوق مستويات المقاومة الرئيسية.
كيف سيؤثر مؤشر DXY القوي عند 99.65 على أسعار WTI هذا الأسبوع؟
يضع مؤشر DXY القوي عند 99.65 ضغطًا هبوطيًا على WTI بشكل عام لأنه يجعل النفط أكثر تكلفة للمشترين غير الدولاريين. إذا استمر مؤشر DXY في الارتفاع، ربما مدفوعًا بتوقعات سياسة الاحتياطي الفيدرالي أو المخاوف الجيوسياسية، فإنه سيحد من أي إمكانات صعودية لـ WTI ويزيد من احتمالية التحرك نحو مستويات الدعم السفلية.
تعكس المعركة بين المشترين والبائعين عند علامة 93.82 دولار لـ WTI صراعًا مع قوى اقتصادية كلية متضاربة وإشارات فنية مختلطة عبر أطر زمنية مختلفة. في حين أن الرسوم البيانية اليومية تشير إلى اتجاه هبوطي قوي، فإن الزخم قصير الأجل يقدم بصيص أمل لارتفاع في تغطية المراكز المدينة. ومع ذلك، تشير قراءات ADX المنخفضة على الأطر الزمنية الأقصر إلى التقلب، مما يجعلها "منطقة مراقبة" في الوقت الحالي. الصبر والالتزام بمبادئ إدارة المخاطر هما المفتاح. سيكون الانتظار لاختراق حاسم فوق 94.10 دولار أو رفض قوي دون 92.67 دولار أمرًا بالغ الأهمية لتحديد إعداد التداول التالي ذي الاحتمالية العالية.
| المؤشر | القيمة | الإشارة | التفسير |
|---|---|---|---|
| RSI (14) | 53.94 | محايد | يحوم في المنطقة المحايدة، زخم صعودي. |
| MACD Histogram | إيجابي | صعودي | لوحظ زخم إيجابي على الرسم البياني للساعة الواحدة. |
| Stochastic | K:64.82, D:65.41 | محايد | يقترب من ذروة الشراء على الساعة الواحدة، مما يشير إلى دفعة محتملة قصيرة الأجل. |
| ADX (1H) | 16.94 | اتجاه ضعيف | سوق متقلب، نقص في الاقتناع الاتجاهي. |
| ADX (4H) | 33.10 | اتجاه قوي | يؤكد الاتجاه الهبوطي القوي على المدى المتوسط. |
| ADX (1D) | 31.09 | اتجاه قوي | يؤكد الاتجاه الهبوطي القوي على الرسم البياني اليومي. |