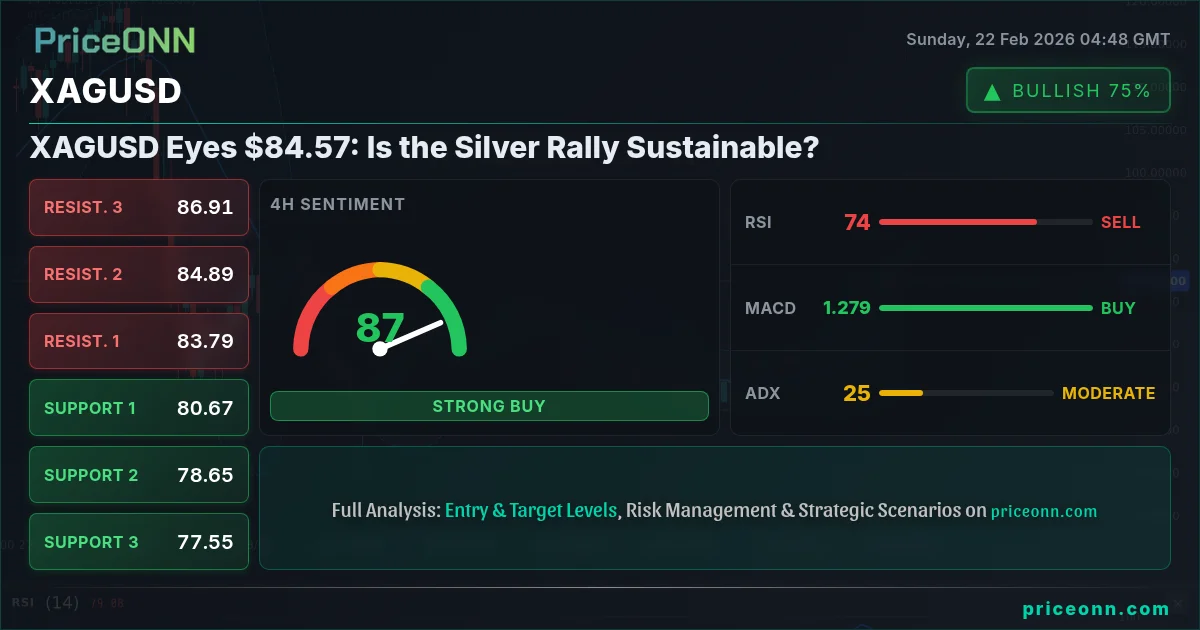
Silver's recent surge has caught the attention of traders worldwide. XAGUSD is currently trading at $84.57, a level that could determine the metal's short-term trajectory. The question now is: can this rally continue, or is a pullback on the horizon?
- RSI at 84.29 on the 1H chart signals potential overbought conditions, warranting caution.
- Critical support lies at $82.83, a level that bulls need to defend to maintain the upward momentum.
- MACD histogram indicates positive momentum, but traders should watch for a potential divergence.
- DXY's current level of 97.44 may exert downward pressure on XAGUSD if the dollar strengthens.
Decoding the Bullish Momentum in XAGUSD
XAGUSD's recent performance has been nothing short of impressive. The metal has been steadily climbing, fueled by a combination of technical and fundamental factors. The daily change of 7.73% underscores the strength of this rally. However, it's crucial to delve deeper into the indicators and market context to assess its sustainability.
On the hourly timeframe, XAGUSD exhibits a strong bullish trend, evidenced by a trend strength of 100%. The immediate support level is identified at $82.83, and the immediate resistance is at $83.48. A decisive break above this resistance could pave the way for further gains. The RSI, however, is flashing a warning signal, as it resides in the overbought territory at 84.29. This suggests that the market may be due for a breather. The ADX at 29.93 confirms a strong uptrend, indicating that the bulls are firmly in control, for now. The Stochastic oscillator, with K=98.49 and D=93.01, reinforces the overbought condition, hinting at potential profit-taking.
Multi-Timeframe Analysis: Aligning the Signals
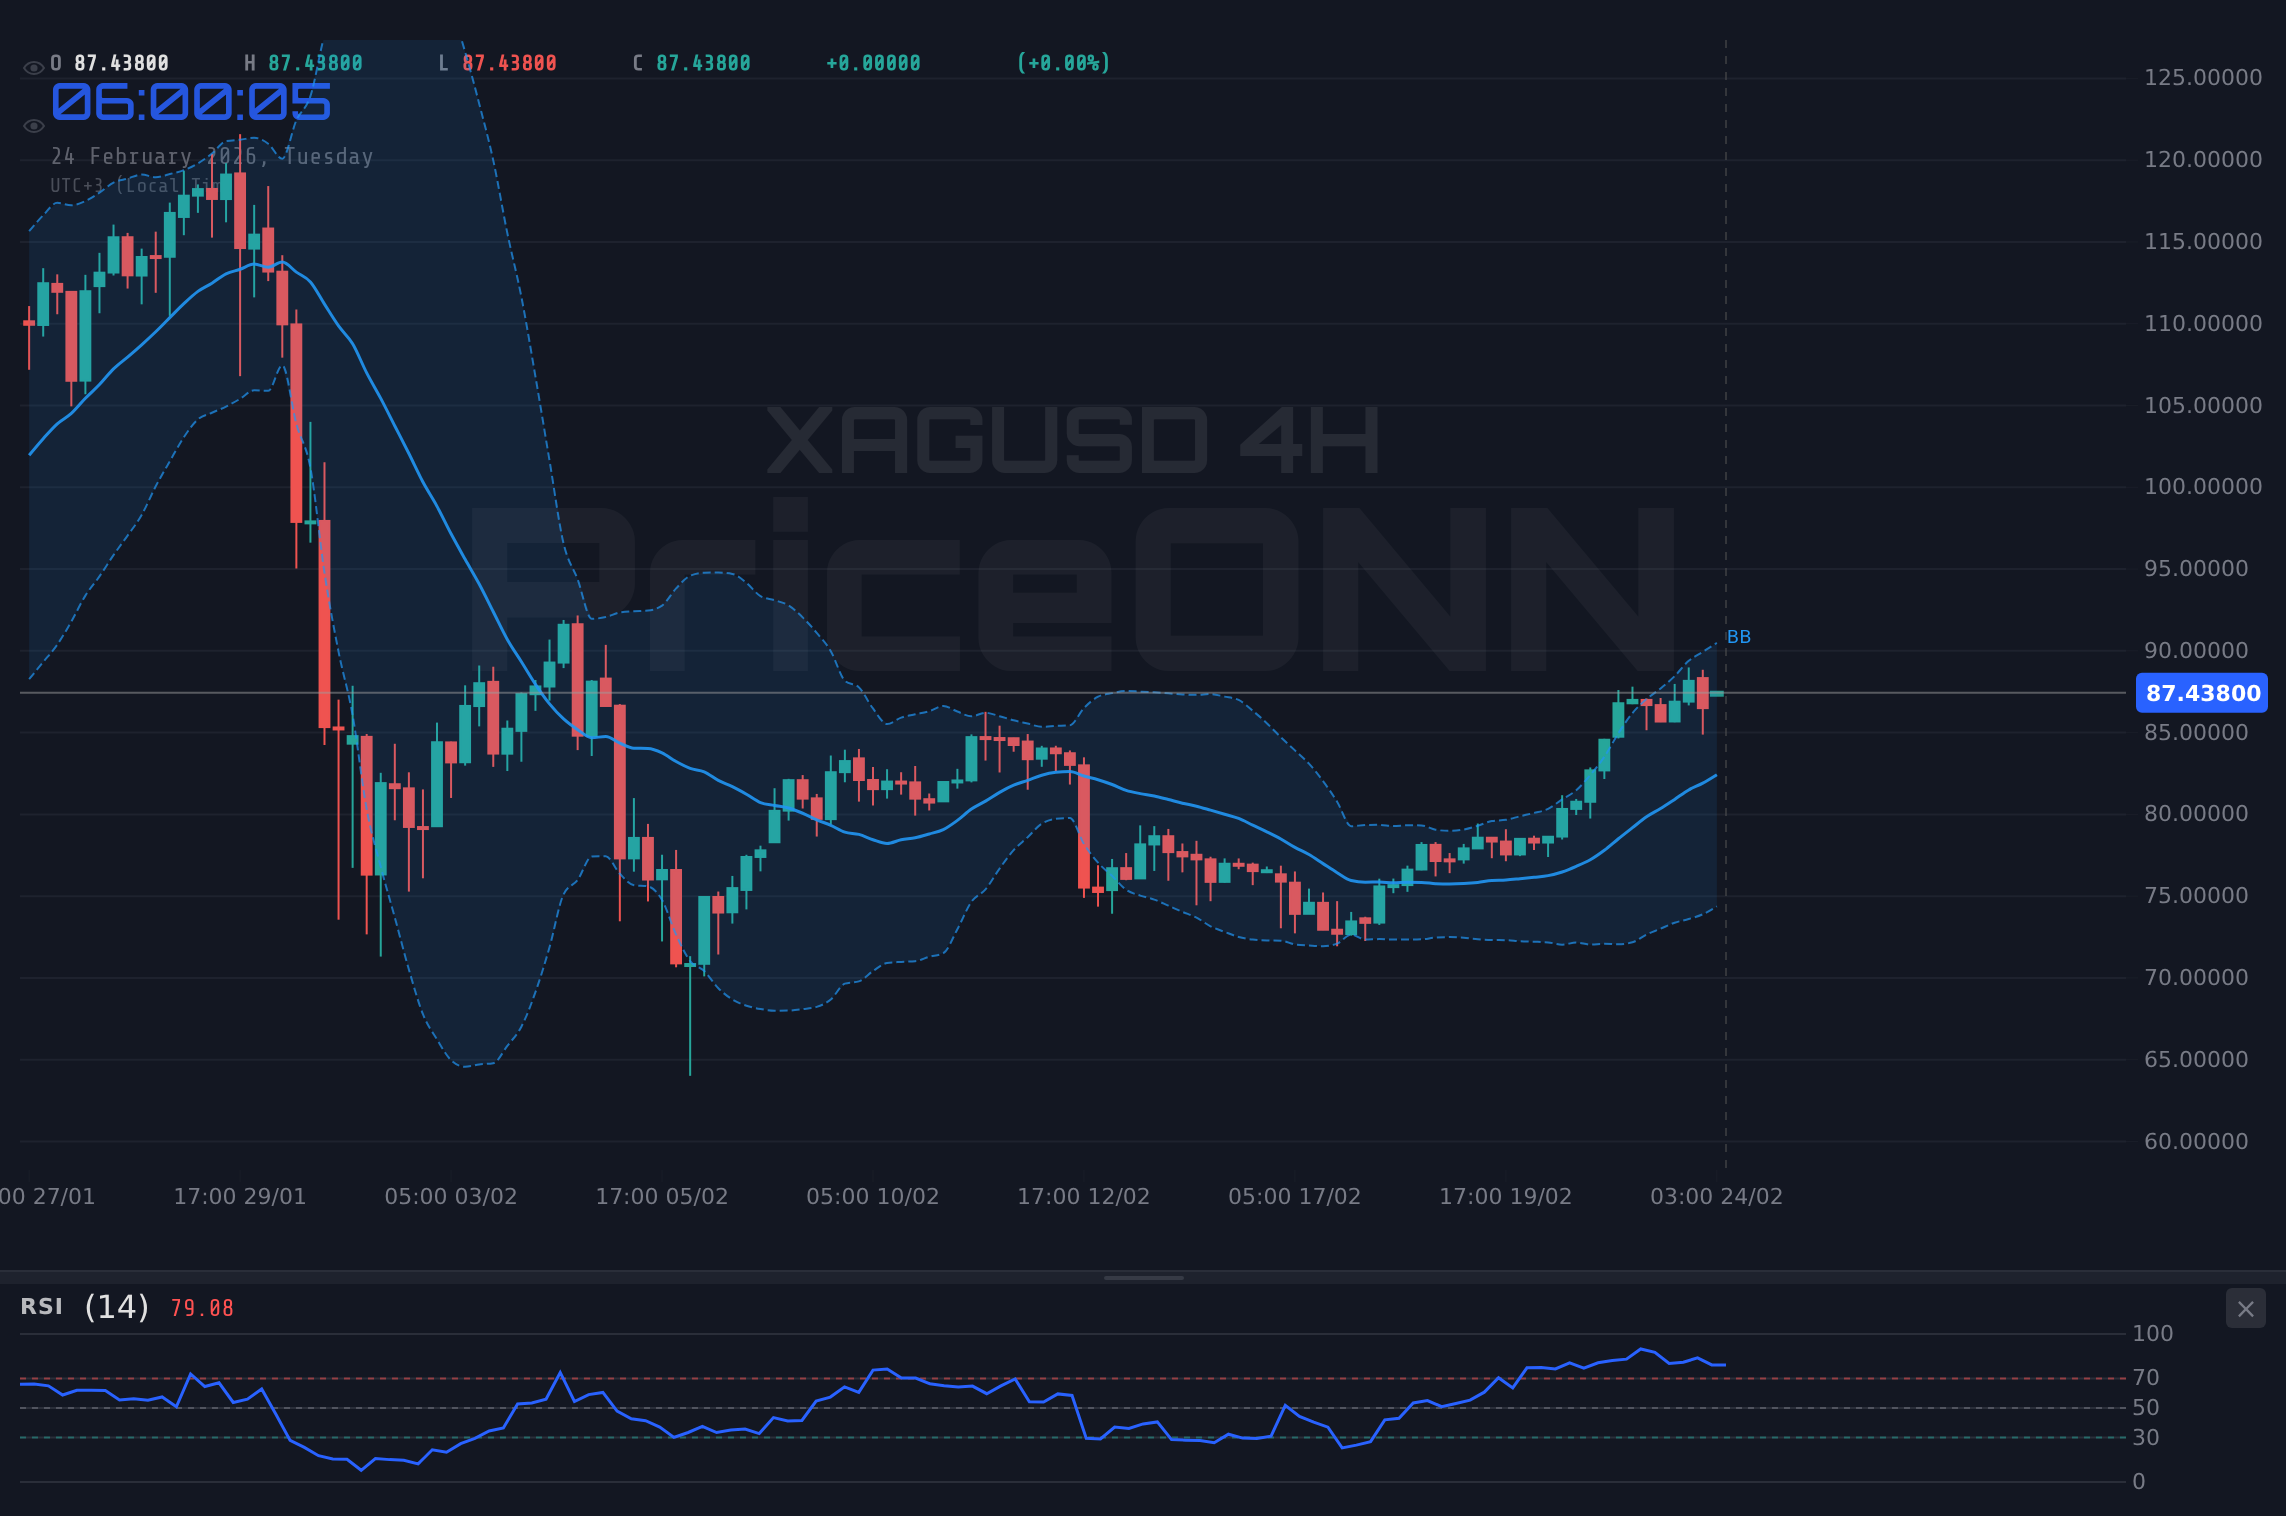
To gain a more comprehensive understanding of XAGUSD's prospects, it's essential to analyze the metal across multiple timeframes. The 4-hour chart presents a slightly different picture, with the trend classified as neutral, albeit with a 50% strength rating. Key support levels on this timeframe are at $80.18, $79.58, and $79.19, while resistance levels are at $81.16, $81.54, and $82.14. The RSI, while still in overbought territory at 73.45, is not as extreme as on the hourly chart. The Stochastic oscillator is also signaling a bullish crossover, with K=90.92 and D=76.19. The ADX at 23.98 suggests a moderate uptrend, lending credence to the bullish bias. The MACD shows positive momentum, further supporting the bullish case. This multi-timeframe alignment strengthens the case for continued upside potential, but traders should remain vigilant for signs of exhaustion.
Zooming out to the daily timeframe, the trend is classified as bullish with a strength of 91%. Key support levels are at $76.79, $75.08, and $73.76, while resistance levels are at $79.83, $81.15, and $82.86. The RSI is at 51.57, indicating a neutral stance. However, the MACD shows negative momentum, a potential cause for concern. The Stochastic oscillator is signaling a bullish crossover, with K=64.33 and D=47.69. The ADX at 31.12 suggests a strong downtrend, conflicting with the overall bullish sentiment. This divergence in signals underscores the need for caution, as the daily chart is exhibiting signs of potential weakness.
Risk/Reward Dynamics: Navigating the Volatility
The current market environment is characterized by heightened volatility, and XAGUSD is no exception. The daily range of $77.4 - $84.62 underscores the potential for sharp price swings. Traders must carefully assess the risk/reward dynamics before entering any positions. The overbought conditions on the shorter timeframes suggest that a pullback is likely, but the overall bullish trend indicates that any dips may be short-lived. The key is to identify optimal entry points that offer a favorable risk/reward ratio. The support levels identified on the hourly and 4-hour charts can serve as potential areas of interest for dip buyers. However, traders should also be prepared to cut losses if the price breaks below these levels. The first support level on the 1H chart lies at $82.83. The second support level on the 1H chart lies at $82.42. The third support level on the 1H chart lies at $82.18. The first resistance level on the 1H chart lies at $83.48. The second resistance level on the 1H chart lies at $83.73. The third resistance level on the 1H chart lies at $84.13. The strong uptrend suggests that the bulls are still in control.
One factor to consider is the correlation between XAGUSD and the DXY (Dollar Index). The DXY currently sits at 97.44. Silver often moves inversely to the dollar, so a strengthening dollar could put downward pressure on XAGUSD. Therefore, traders should monitor the DXY closely for any potential shifts in momentum. The SP500 and Nasdaq are indicators of risk appetite, and a decline in these indices could trigger safe-haven demand for silver. This is a critical point because the SP500 is showing as 0, meaning that there may be issues with risk appetite. The Nasdaq100, on the other hand, is at 24996.74, and is showing an uptrend.
Economic Calendar: Awaiting the Next Catalyst
The economic calendar is relatively light in the near term, but traders should remain aware of any potential data releases that could impact market sentiment. All the data is showing as "-" for the USD. This means that there are no significant catalysts. The key is to monitor the overall market sentiment and react accordingly. Any positive surprises could fuel further gains in XAGUSD, while negative surprises could trigger a pullback.
Trade Plan: Capitalizing on the Bullish Momentum
Given the current technical picture, a potential trade plan for XAGUSD could involve the following:
This trade plan assumes that the bullish momentum will continue, and that XAGUSD will break above the immediate resistance level of $83.48. The targets are based on the next resistance levels identified on the hourly chart. The stop-loss is placed below the immediate support level of $82.83 to protect against potential downside risk.
Bearish Scenario: Identifying the Risks
While the overall trend is bullish, it's important to consider the potential risks. The overbought conditions on the shorter timeframes suggest that a pullback is likely. If XAGUSD fails to break above $83.48, it could trigger a wave of profit-taking, leading to a deeper correction. The key support levels to watch are $82.83, $82.42, and $82.18. A break below these levels could signal a shift in momentum, opening the door for further downside.
XAGUSD at $84.57: A Critical Juncture
XAGUSD's current price of $84.57 represents a critical juncture. The metal is trading near key resistance levels, and the technical indicators are painting a mixed picture. The bullish momentum is undeniable, but the overbought conditions and potential DXY strength warrant caution. Traders should carefully assess the risk/reward dynamics and monitor the price action closely for any signs of a shift in momentum. The key is to remain flexible and adapt to the changing market conditions.
Frequently Asked Questions: XAGUSD Analysis
Is XAGUSD a good buy right now?
XAGUSD is showing strong bullish momentum, currently trading at $84.57, but is overbought in the short-term. A buy could be considered on a break above $83.48 with a stop-loss at $82.83, or on a pullback to the $82.83 support level.
What is the XAGUSD price forecast for this week?
The XAGUSD price forecast for this week is cautiously bullish, with potential targets at $83.73 and $84.13 if the uptrend continues. However, overbought conditions suggest a possible pullback, so traders should be prepared for volatility.
What are the key support and resistance levels for XAGUSD?
Key support levels for XAGUSD are $82.83, $82.42, and $82.18. Key resistance levels are $83.48, $83.73, and $84.13, all based on the 1H timeframe data.
Why is XAGUSD moving today?
XAGUSD is moving today due to strong bullish momentum and positive market sentiment. However, potential downward pressure from a strengthening dollar (DXY at 97.44) and overbought conditions could temper gains.
Having tracked XAGUSD through the 2024 rate cycle, I've seen similar patterns emerge, where initial breakouts lead to short-term overbought conditions before the underlying trend resumes. Historically, when RSI reaches this zone on XAGUSD, the outcome has been a period of consolidation before further upside.
Track markets in real-time
AI-powered analysis, technical indicators and real-time price data.
Join Our Telegram Channel
Breaking market news, AI analysis and trading signals instantly.
Join Channel