Dollar Slides as ECB Out-Hawks Fed Amid Oil Shock and Rising Inflation Risks
Dollar had every reason to rally last week, but instead ended as the worst performer among major currencies. Sharp selloff in global equities, surging Treasury yields, and escalating geopolitical risks would typically trigger strong safe-haven demand for the greenback. Yet, that relationship broke down.
The key driver behind this anomaly is the growing divergence in central bank expectations. Markets are increasingly pricing that some major central banks, particularly ECB, will turn more aggressive in tackling inflation, even as Fed remains relatively cautious. This shift came into focus following last week’s central bank “marathon”, where policymakers effectively revealed how they intend to handle the energy-driven inflation shock.
As a result, policy divergence-not risk sentiment-dominated the FX markets. Euro was among the strongest performers, supported by rapidly rising expectations of ECB tightening. Sterling also held firm, with markets pricing in a meaningful probability of further tightening from BoE as energy-driven inflation risks build. In contrast, Dollar lagged as Fed’s “hawkish wait” stance failed to match the tightening momentum seen elsewhere.
Looking ahead, the key question is whether policy divergence will continue to dominate. As long as oil prices remain elevated and inflation risks persist, markets are likely to keep pricing tighter policy paths for ECB and BoE relative to Fed. This dynamic should continue to weigh on Dollar and support relative strength in European currencies. However, this pattern is not unconditional. A more extreme escalation in geopolitical tensions-triggering a liquidity shock or “peak fear” event-could restore Dollar’s safe-haven appeal.
Risk-Off Deepens as Equities Slide and Yields Break Higher
Risk aversion intensified further last week as global equity markets extended their selloff. DOW fell -2.1% to close at 45,577.47, bringing it closer to the key 45k medium-term support level. S&P 500 and also declined -1.9% and -2.1% respectively, with both indices confirming downside breakouts that signal a broader corrective phase.
At the same time, Treasury yields surged, with US 10-year yield breaking decisively above the 4.3 resistance level and moving toward the 4.4–4.5 zone. This move reflects a sharp repricing of inflation risks and expectations that central banks will maintain restrictive policies for longer.
Other asset classes reinforced the risk-off environment. Gold tumbled more than -10% to close below 4,500 level, driven by a combination of hawkish policy signals and forced liquidation dynamics. Meanwhile, Brent crude remained elevated above 110 after briefly spiking near 120, underscoring the persistent inflationary impulse from energy markets. In currencies, however, the pattern diverged sharply from expectations, with Dollar lagging while Euro outperformed.
Iran War Escalation Locks in Energy Shock as Oil Holds Elevated with Upside Risk
The Iran war has escalated into a sustained energy disruption, with both sides expanding the scope of attacks to critical infrastructure and strategic assets. Iran’s missile strikes on the U.S. Diego Garcia base mark a significant geographic expansion, while continued Israeli strikes on Iranian energy facilities signal a deliberate move to target economic lifelines rather than just military positions.
Retaliation has increasingly focused on energy supply chains. Iranian-linked strikes have disrupted LNG exports in Qatar, knocking out a meaningful portion of capacity, with estimates suggesting multi-year recovery timelines. At the same time, Iran’s threats of broader asymmetric attacks reinforced the view that the conflict is unlikely to be contained quickly.
The Strait of Hormuz remains effectively constrained. While not fully closed in a formal sense, the combination of missile threats, drones, and naval disruption has sharply reduced safe passage. According to a mid-March 2026 Defense Intelligence Agency (DIA) assessment, the strait could remain functionally closed for anywhere between one to six months. This timeframe alone is sufficient to embed a prolonged supply shock into global markets, regardless of whether hostilities intensify further.
Oil markets have responded with a sustained risk premium. Brent’s move toward 120 and stabilization above 110 reflects ongoing supply concerns, while the widening spread with WTI underscores the uneven global impact. With no credible path to de-escalation and infrastructure damage likely to take years to repair, the bias remains toward sustained elevation in oil prices, with risks skewed toward further upside if the conflict escalates again. While a surge toward 200 remains a distant scenario, a firm break above 120 would likely pave the way toward 160.
ECB: Inflation Shock Already Beyond Baseline Projections, Forcing Tightening
ECB delivered the most consequential shift of last week’s seven major central bank meetings, not through a rate move, but via its updated inflation projections. By holding the deposit rate at 2.00% while sharply revising its outlook, the central bank effectively acknowledged that the inflation environment has shifted into a more dangerous phase.
In a rare move, ECB staff incorporated data up to March 11 into their projections-a significantly later cutoff than usual. This decision was critical. It showed that policymakers were not “looking through” the recent energy spike as a temporary distortion, but were instead treating it as a structural threat to price stability.
The projections themselves were built around three energy paths, but the baseline immediately revealed a disconnect. It assumes oil peaks at 90, producing inflation of 2.6% in 2026 (an upgrade from 1.9% in December forecast). That assumption has already been overtaken by events, with Brent holding firmly between 100 and 120.
This shifts attention squarely to the adverse scenario. Under that framework, inflation rises to around 3.5% in 2026 and remains elevated for longer, while growth weakens further. Crucially, this is no longer a tail risk-it closely resembles current market conditions.
The implication is that ECB’s baseline is no longer the central case for markets. Instead, the “adverse” scenario has effectively become the working assumption. As long as energy prices remain elevated, the risk of second-round effects through wages and services increases materially, making it difficult for inflation to return to target.
That leaves ECB in a tightening position whether it formally acknowledges it or not. What is framed as conditional action is increasingly being interpreted as inevitable. In effect, ECB has entered a “forced tightening” phase, where policy will have to respond to inflation dynamics that are already unfolding.
Fed Holds Hawkish Wait as ECB Out-Hawks on Asymmetric Energy Shock
A key shift in last week’s macro landscape is the emergence of ECB “out-hawking” the Fed. This divergence is being driven by the asymmetric impact of the Iran war, which has forced ECB to respond to a direct inflation shock, while Fed remains in a more measured, wait-and-see stance.
Fed’s latest dot plot highlights this contrast. Despite the escalation in geopolitical tensions and higher energy prices, the median projection still points to one 25bps rate cut by the end of 2026, targeting a range of 3.25%–3.50%. While inflation forecasts were revised higher, with PCE seen at 2.7%, the adjustment was modest, signaling that policymakers do not yet see the need for a more aggressive response.
The underlying reason lies in structural differences. The U.S. as a net energy exporter, is partially insulated from the supply shock. Higher oil prices weigh on consumers, but they also support domestic production and investment, offsetting some of the drag. This contrasts sharply with Europe, where higher energy costs feed directly into inflation without a corresponding economic benefit.
Market pricing reflects this dynamic. Expectations for a June rate cut have largely been removed, but there is little conviction around tightening. For December, markets assign around an 80% probability that rates remain unchanged at 3.50%–3.75%, indicating that the base case is for policy to stay restrictive for longer rather than shift higher.
In essence, Fed is in a “hawkish wait,” acknowledging inflation risks but holding back from immediate action. In contrast, markets increasingly view ECB as entering a “forced tightening” phase.
Inflation Shock Drives Yields Higher and Stocks Lower, Dollar Outlook Still Uncertain
Technical developments across key markets are reinforcing the shift toward rising inflation risks and tighter global financial conditions. With equities under pressure, yields breaking higher, and oil revisiting a key breakout level, the broader picture points to further stress ahead.
DOW
DOW’s extended decline last week continues to align with the view that the fall from 50,512.79 is still unfolding, with price now approaching a critical support zone around the 45k handle. This zone includes the 38.2% retracement of 36,611.78 to 50,512.79 at 45,202.26, as well as the 2024 peak at 45,071.29.
A strong rebound from this region, followed by a break above 47,428.12, would suggest that selling pressure has reached a near-term climax. Such a development would open the way for a recovery toward the 55 D EMA (now at 48,165.90) and potentially higher.
However, sustained break below 45k would signal a more significant shift, suggesting that the broader uptrend from 36,611.78 (2025 low) is reversing rather than correcting. In that case, downside targets would extend to the 61.8% retracement at 41,921.97, with further risk toward the multi-year channel floor around 40k.
10-Year Yield
The 10-year Treasury yield’s rally from 3.965 accelerated last week, breaking decisively above the key 4.311 structural resistance level. This move suggests that the prior consolidation from the 4.809 (2025 high) has likely completed as a converging triangle, with five waves ending at 3.956.
As long as 4.189 support holds, further upside is expected in the near term. The next key target is the 4.629 resistance zone.
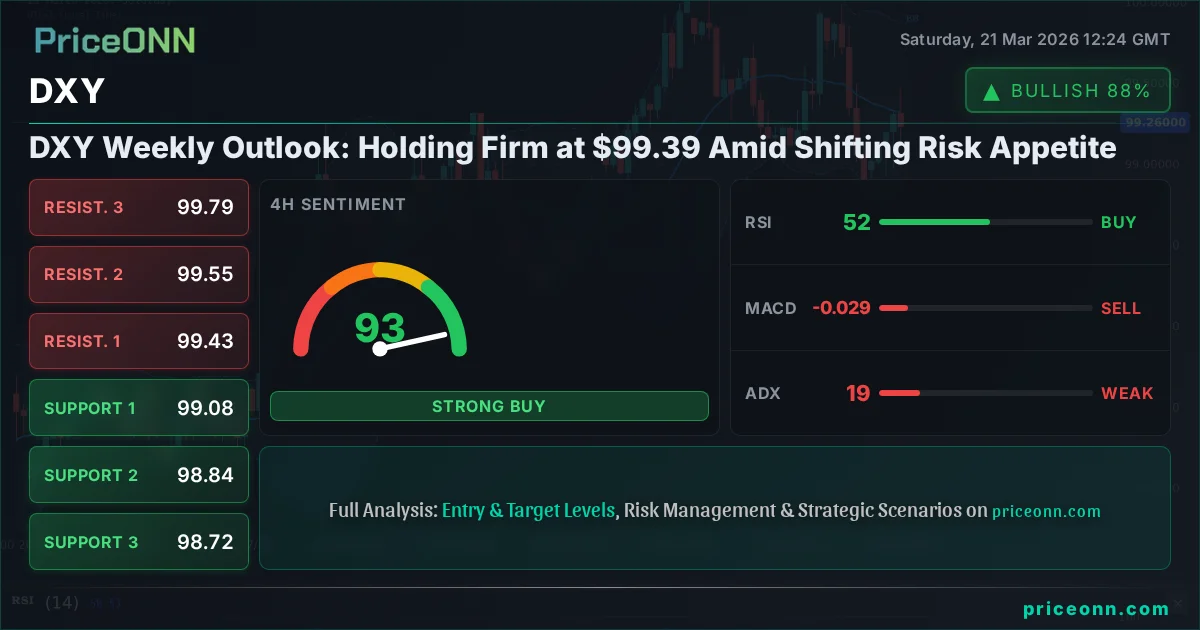
Dollar Index retreated last week but continues to hold above the 98.49 support level. While further rally remains possible, upside is likely to face strong resistance around 38.2% retracement of 110.17 to 99.55 at 101.13.
A break below 98.49 would suggest that the recovery from 95.55 has already completed, bringing a retest of that low into focus and keeping the medium-term outlook bearish.
On the upside, however, sustained break above 101.13 would open the path toward 61.8% retracement at 104.58. Such a move would signal a more meaningful bullish reversal, marking the end of the broader downtrend from 110.17 (2025 high) or even 114.77 (2022 high).
Brent Crude
For Brent crude, the key question is whether the 120 psychological level will cap further gains. A break below 100.48 support would indicate that the rebound from 81.41 has already completed, with the corrective pattern from 119.70 entering a third leg lower toward 81.41 support.
However, decisive break above 120 would signal resumption of the long-term uptrend. In that case, the next target would be the 100% projection of 58.88 to 119.70 from 81.41 at 142.43.
Near-term bias remains to the upside as long as 100.48 holds, with risks skewed toward a breakout given the ongoing supply shock and elevated geopolitical premium.
EUR/USD Weekly Outlook
EUR/USD recovered last week but upside is capped below 1.1666 cluster resistance (38.2% retracement of 1.2081 to 1.1408 at 1.1665). Initial bias remains neutral this week, and further decline is in favor. On the downside, below 1.1408 will resume the fall from 1.2081 to 38.2% retracement of 1.0176 to 1.2081 at 1.1353. However, decisive break of 1.1666 will argue that the fall from 1.2081 has completed, and turn bias back to the upside for 61.8% retracement of 1.2081 to 1.1408 at 1.1824.
In the bigger picture, prior break of 55 W EMA (now at 1.1495) should confirm rejection by 1.2 key cluster resistance level. The whole up trend from 0.9534 (2022 low) might have completed as a three wave corrective rise too. Deeper fall is expected to long term channel support (now at 1.0528). Meanwhile, risk will stay on the downside as long as 1.2081 holds, even in case of strong rebound.
In the long term picture, 38.2% retracement of 1.6039 to 0.9534 at 1.2019, which is close to 1.2000 psychological level is the key for the outlook. Rejection by this level will keep the multi decade down trend from 1.6039 (2008 high) intact, and keep outlook neutral at best. However, decisive break of 1.2000/19, will suggest long term bullish trend reversal, and target 61.8% retracement at 1.3554.
Track markets in real-time
Empower your investment decisions with AI-powered analysis, technical indicators and real-time price data.
Join Our Telegram Channel
Get breaking market news, AI analysis and trading signals delivered instantly to your Telegram.
Join Channel