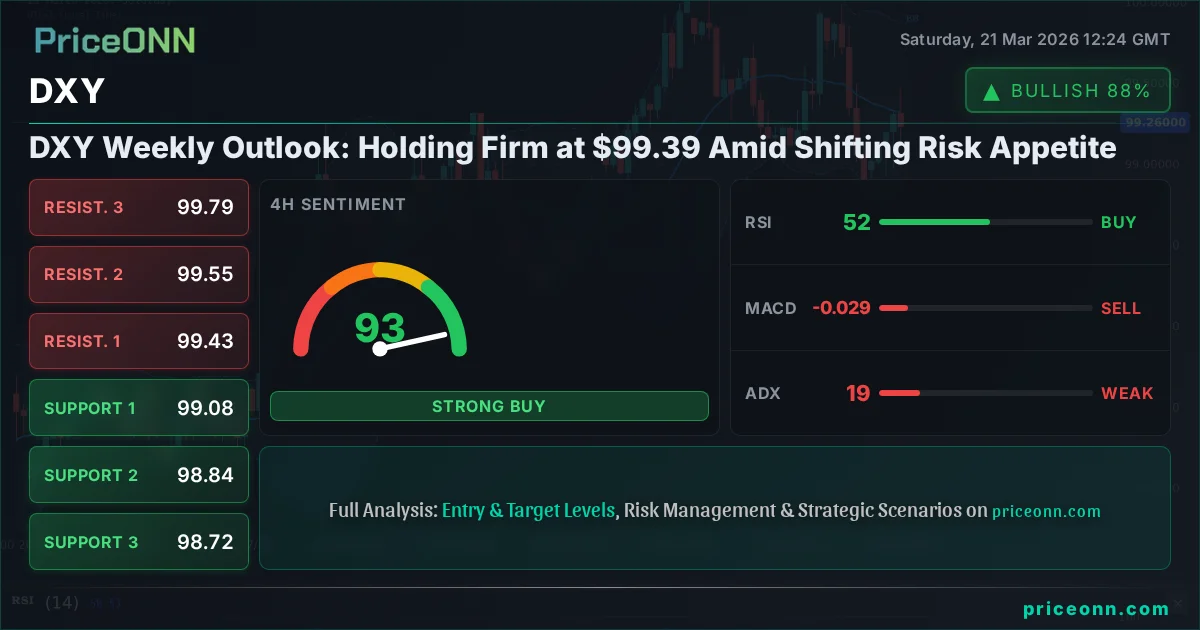
DXY Weekly Outlook: Holding Firm at $99.39 Amid Shifting Risk Appetite
The US Dollar Index (DXY) closed last week near $99.39, navigating mixed signals from technical indicators and geopolitical events. Analysis suggests key levels to watch.
The US Dollar Index (DXY) concluded last week perched precariously near the $99.39 mark, a level that has become a focal point for traders and analysts alike. This past week was characterized by a complex interplay of factors, from escalating geopolitical tensions in the Middle East to the ongoing debate surrounding Federal Reserve monetary policy. While the dollar showed resilience, holding its ground above critical psychological thresholds, the underlying technical signals present a mixed picture, demanding a nuanced approach as we look towards the coming trading sessions. Understanding the confluence of these elements is paramount for anyone seeking to navigate the forex markets effectively.
- The DXY closed the week at $99.39, a crucial psychological level tested multiple times.
- RSI at 58.15 on the daily chart signals a neutral-to-bullish sentiment, but ADX at 34.64 indicates a strong existing trend, not necessarily a new one.
- Key resistance at $99.72 was approached but not decisively broken, while support at $98.36 held firm.
- Geopolitical risks and Fed rate expectations remain the primary drivers for the dollar's next move.
The past week saw the DXY grappling with significant crosscurrents. On one hand, persistent geopolitical instability, particularly in the Persian Gulf, typically fuels safe-haven demand for the US dollar. Renewed attacks in the region, as reported by PriceONN market news, pushed crude oil prices higher, underscoring a global risk-off sentiment that often benefits the greenback. However, this safe-haven bid was somewhat tempered by other market forces. The Federal Reserve's latest signals, interpreted as a 'hawkish hold' by many, suggest a cautious approach to interest rate policy. This uncertainty, combined with a broader market sentiment that, while showing signs of risk aversion, hasn't fully capitulated, created a tug-of-war for dollar bulls.
From a technical standpoint, the DXY's journey last week was a masterclass in consolidation. The daily chart paints a picture of a strong uptrend, with the ADX hovering around 34.64, indicating robust trend strength. However, this strength is not necessarily indicative of immediate upward momentum. The RSI(14) at 58.15 suggests a comfortable position in the neutral-to-bullish zone, well away from overbought territory, implying room for further appreciation. Yet, the Stochastic Oscillator, with K at 65.73 and D at 75.68, presents a bearish divergence on the daily timeframe, hinting at potential downward pressure or a consolidation phase ahead. This conflict between trend strength and oscillator signals is a classic sign of a market at a potential inflection point.
The 1-hour timeframe offers a more granular view, showing a neutral trend with a power of 50%. Here, the DXY oscillated, testing resistance levels and finding support. The RSI at 56.78 suggests a slightly bullish lean in the short term, while the MACD remains positive, indicating some underlying buying pressure. However, the Stochastic K line at 64.62 and D line at 70.05 signal a potential bearish crossover, aligning with the daily divergence. This short-term chop highlights the immediate indecision in the market, where small moves can be amplified by the prevailing uncertainty.
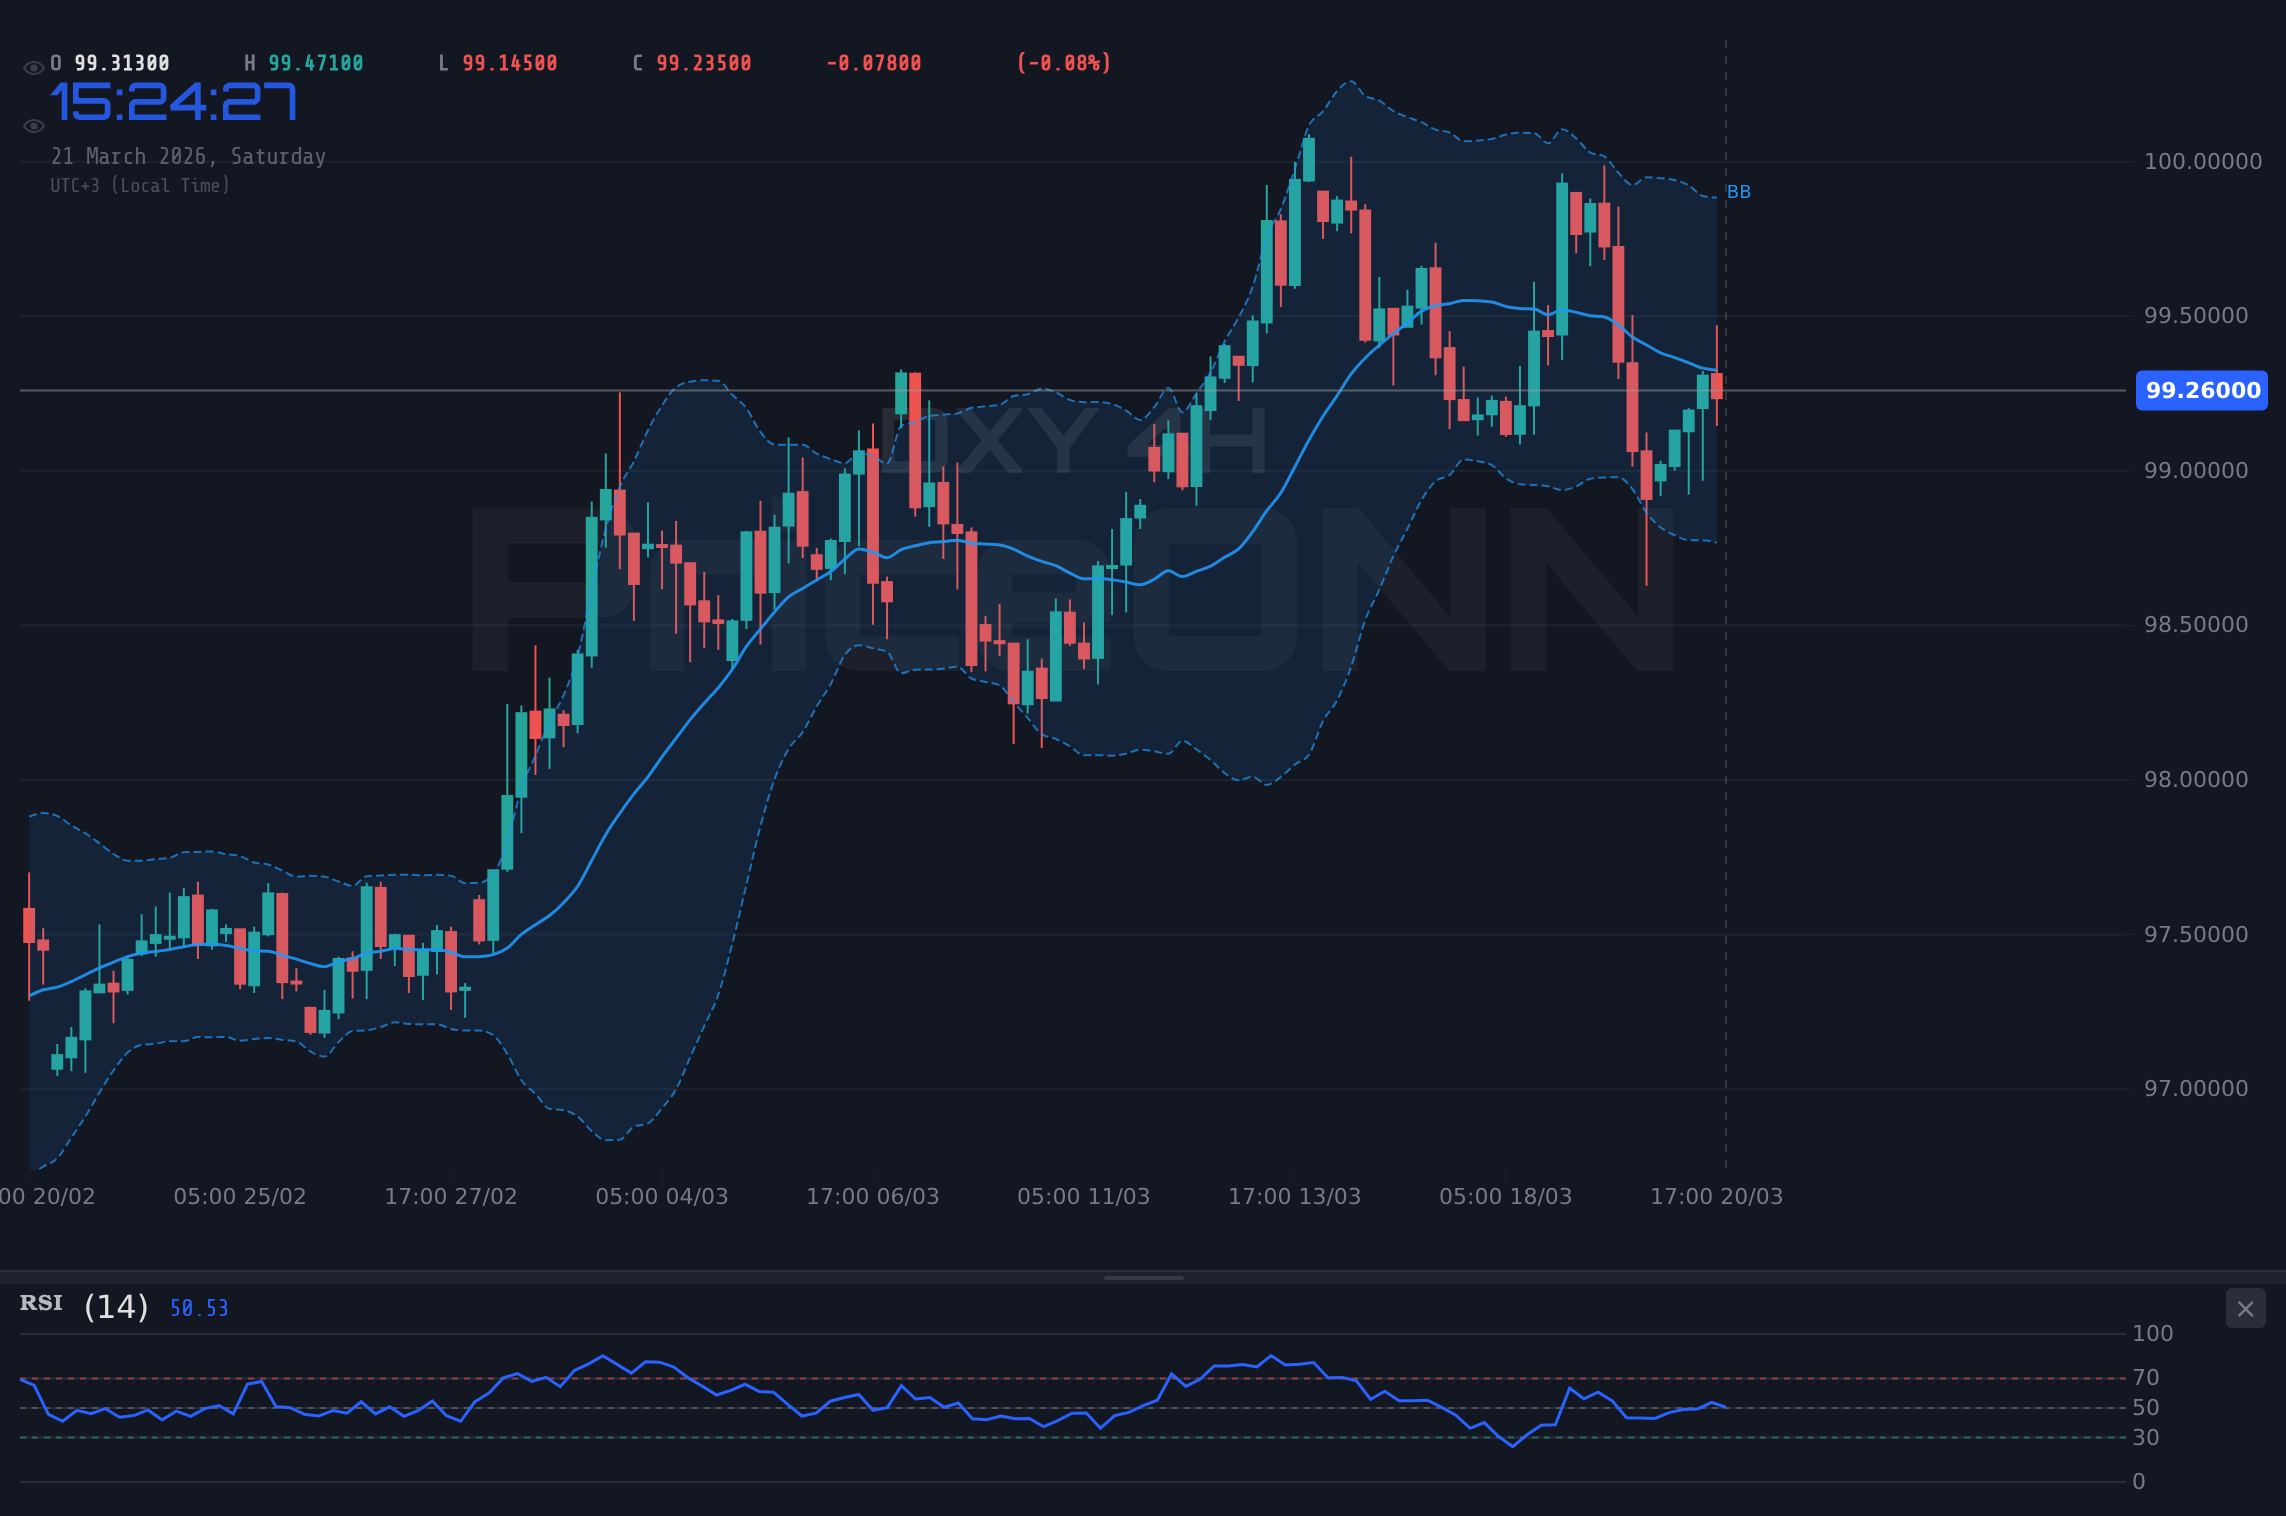
Delving deeper into the 4-hour chart, the trend is identified as bullish with a power of 85%. This timeframe aligns with the broader uptrend narrative, showing the DXY comfortably above the middle Bollinger Band, a sign of bullish momentum. The RSI at 51.52 remains in neutral territory, offering no strong directional conviction, but the MACD's negative momentum, with the MACD line below its signal line, contradicts the bullish trend strength. This divergence is crucial; it suggests that while the overall trend might be upward, the immediate forces at play are not fully supporting further gains. The Stochastic, showing K at 49.17 and D at 32.21, offers a bullish signal, indicating potential upside from this timeframe's perspective, but it's a lone voice amidst conflicting indicators.
The price action around key levels last week was particularly telling. The resistance at $99.72 proved to be a significant hurdle. While the DXY approached it on several occasions, it failed to sustain a decisive breakout above this mark. This inability to clear the resistance suggests that the bulls lacked the conviction or the necessary catalyst to push higher. Conversely, the support level at $98.36, a level referenced in our previous analysis, held firm. Each test of this lower boundary was met with renewed buying interest, reinforcing its significance as a floor for the dollar. The range between $98.36 and $99.72 became a battleground, illustrating the market's indecision.
This price action is not occurring in a vacuum. The broader market context, particularly the performance of major stock indices like the SP500 and Nasdaq, plays a crucial role. Last week, both indices experienced significant pullbacks, with the SP500 falling 1.21% and the Nasdaq 100 dropping 1.65%. This risk-off sentiment in equities typically supports safe-haven assets like the dollar. When stocks fall, investors often rotate into perceived safer assets, and the DXY is a primary beneficiary of such flows. The fact that the DXY managed to hold its ground, despite not making significant gains, can be partly attributed to this underlying demand driven by equity market weakness. The inverse correlation between equities and the dollar remains a dominant theme.
Furthermore, the energy markets provided another layer of complexity. Brent crude oil prices surged by 4.81% to $112.79, and WTI followed suit, climbing 3.87% to $98.50. This sharp rise in oil prices, driven by escalating tensions in the Persian Gulf, has significant implications for inflation expectations. Higher energy costs can stoke inflationary pressures, which could, in theory, push the Federal Reserve towards a more hawkish stance. However, the Fed's recent communications have leaned towards a data-dependent approach, and the market is currently pricing in a cautious outlook rather than aggressive rate hikes. This delicate balance means that while rising oil prices add a hawkish tilt to the inflation narrative, the actual policy response remains uncertain, creating ambiguity for the dollar.
Looking at the forex majors, the DXY's performance was a mixed bag. EURUSD saw a slight decline of 0.07% to 1.15728, reflecting some dollar strength, though the euro itself faces its own set of economic challenges. USDJPY, on the other hand, climbed 0.93% to 159.226, indicating strong dollar demand against the yen, perhaps driven by interest rate differentials and risk appetite. GBPUSD fell 0.59% to 1.33435, and AUDUSD and NZDUSD also weakened against the dollar, showing broad-based dollar strength across the board, albeit not a runaway rally. This pattern suggests that while specific currency pairs might be influenced by their own fundamentals, the overarching trend of dollar resilience, even in the face of indecisive technicals, is significant.
The technical indicators, when viewed in isolation across different timeframes, offer a fragmented outlook. On the 1-hour chart, the majority of signals lean towards 'Buy' (7 out of 8), driven by short-term momentum. However, the 4-hour chart presents a more balanced view, with a 'Buy' signal dominance of 6 out of 8, but with conflicting indicators like a negative MACD momentum. The daily chart, which often carries more weight for longer-term trends, shows a stronger 'Sell' signal leaning (6 out of 8), primarily due to the bearish Stochastic divergence and the ADX suggesting a strong existing trend that might be ripe for consolidation or reversal rather than continuation. This multi-timeframe conflict is the crux of the current market indecision.
The ADX, a measure of trend strength, provides a critical piece of the puzzle. On the daily chart, the ADX at 19.51 suggests a weak trend, which might seem counterintuitive given the overall upward movement. However, this reading often appears during periods of consolidation within a larger trend, or when a trend is losing steam. The 1-hour ADX at 22.64 and 4-hour ADX at 19.43 reinforce this idea of a market that is not exhibiting a strong, committed directional impulse. While the trend strength might be present on the daily chart (ADX 34.64), the intraday and medium-term indicators suggest that the current price action is more about range-bound trading and awaiting a clearer catalyst.
Considering the possibility of a shift in market sentiment, the correlation with gold and silver prices cannot be ignored. Both precious metals experienced sharp declines last week, with XAUUSD tumbling 3.28% to $4,497.65 and XAGUSD falling a staggering 6.67% to $67.90. This significant sell-off in gold, despite rising geopolitical risks, is unusual. Typically, gold acts as a safe-haven asset. Its decline could signal a rotation out of traditional safe havens into other assets perceived as safer, or perhaps a sign that market participants are discounting the immediate geopolitical threat, or even anticipating a stronger dollar. The inverse relationship between DXY and gold is well-established, and the dollar's resilience even as gold falls reinforces the dollar's current strength narrative.
The implications for carry trade strategies are also noteworthy. With the Federal Reserve maintaining its interest rate stance, the interest rate differential between the US dollar and other major currencies might not widen significantly in the immediate term. However, the dollar's perceived stability, especially in times of geopolitical uncertainty, can still make it an attractive funding currency. Currencies like the Japanese Yen (USDJPY up 0.93%) or even the Euro (slight DXY strength despite EURUSD holding near 1.157) can be subject to carry trade pressures if global risk appetite allows for it. The current environment, however, favors funding currencies that offer perceived safety over those offering high yields but carrying significant political or economic risk.
Looking ahead, the DXY's path will likely be dictated by a few key factors. Firstly, the ongoing geopolitical situation in the Middle East will remain a primary driver of safe-haven flows. Any escalation or de-escalation will have a direct impact on risk sentiment and, consequently, on the dollar. Secondly, the Federal Reserve's forward guidance will be crucial. Any hints about the timing or pace of potential interest rate adjustments, or even subtle shifts in language regarding inflation and employment, could significantly move the needle. Finally, key economic data releases, particularly from the US, will provide the necessary confirmation or refutation of the current economic narrative. Traders will be keenly watching for any signs of stagflation or a significant shift in the labor market.
The technical setup suggests that the $99.72 resistance level remains the immediate hurdle for the bulls. A decisive close above this level, ideally with strong volume and supported by positive news flow, could open the door for a move towards the $100.54 region. On the downside, the support at $98.36 is critical. A break below this level, particularly a close below it on the daily chart, would invalidate the current bullish bias and could signal a deeper correction, potentially targeting the $97.82 support. The range between $98.36 and $99.72 is likely to see continued consolidation until a clear catalyst emerges.
The interplay between strong trend indicators (ADX) and conflicting oscillators (Stochastic, RSI divergence) suggests that while the DXY is in an uptrend, the momentum for a significant breakout is currently lacking. This 'choppy' market environment, as indicated by the ADX readings on shorter timeframes, means that price action might be more range-bound than trending. Traders should exercise caution, looking for clear confirmation before committing to large positions. The market is essentially waiting for a decisive signal from either the geopolitical front or the Federal Reserve.
Bullish Scenario: Dollar Strength Continues
45% ProbabilityConsolidation Scenario: Range-Bound Trading
50% ProbabilityBearish Scenario: Dollar Reversal
5% ProbabilityFrequently Asked Questions: DXY Analysis
What happens if DXY breaks decisively above the $99.72 resistance level?
A sustained move above $99.72, confirmed by daily close and strong volume, would invalidate the consolidation scenario and likely target the next resistance at $100.54. This would suggest bulls have regained control, potentially driven by escalating geopolitical risks or hawkish Fed commentary.
Is RSI at 58.15 a buy signal for DXY right now, given the strong ADX trend?
An RSI of 58.15 on the daily chart is in neutral-to-bullish territory, indicating room for upside but not yet an aggressive buy signal. While the ADX at 34.64 suggests a strong trend, the conflicting bearish divergence on the Stochastic oscillator implies that the current trend might lack immediate momentum for a significant breakout. Caution is advised, and confirmation from other indicators or price action is needed.
How will the Federal Reserve's next policy decision affect the DXY at current levels near $99.39?
The Fed's stance is crucial. A 'hawkish hold,' where rates remain steady but rhetoric signals a longer path to cuts or a higher terminal rate, could support the DXY above $99.39. Conversely, any dovish signals or unexpected cuts would likely pressure the dollar, potentially leading to a test of lower support levels around $98.36.
Should traders consider buying DXY at $99.39 given the mixed technical signals and uncertain outlook?
Given the conflicting signals and the DXY's position within a defined range between $98.36 and $99.72, entering at current levels carries risk. A more prudent approach might be to wait for a clear breakout above $99.72 with confirmation, or a confirmed rejection and retest of $98.36, to establish a higher probability trade setup.
| Indicator | Value | Signal | Interpretation |
|---|---|---|---|
| RSI (14) Daily | 58.15 | Neutral | Moving towards overbought, but no immediate signal. |
| MACD Histogram Daily | 0.12 | Bullish | Slightly positive momentum, but fading. |
| Stochastic Daily | K:65.73, D:75.68 | Bearish Divergence | %K < %D suggests potential downside pressure. |
| ADX Daily | 34.64 | Strong Trend | Indicates a well-established trend, but not necessarily new momentum. |
| Bollinger Bands 1D | Middle Band | Watch | Price is above the middle band, suggesting some bullish bias. |
The DXY's performance last week near the $99.39 level highlighted the delicate balance of forces shaping the currency markets. While geopolitical tensions and risk-off sentiment provided a floor, the Fed's cautious stance and mixed technical signals created resistance. The coming week will be critical, with economic data and central bank commentary likely to provide the catalysts needed to break the current range. For now, the $98.36 support and $99.72 resistance levels are the lines in the sand that traders will be watching closely. Volatility can be a trader's best friend when approached with a well-defined plan and disciplined risk management. Remember, the market always offers another opportunity; the key is to be prepared when it arrives.
Track markets in real-time
AI-powered analysis, technical indicators and real-time price data.
Join Our Telegram Channel
Breaking market news, AI analysis and trading signals instantly.
Join Channel