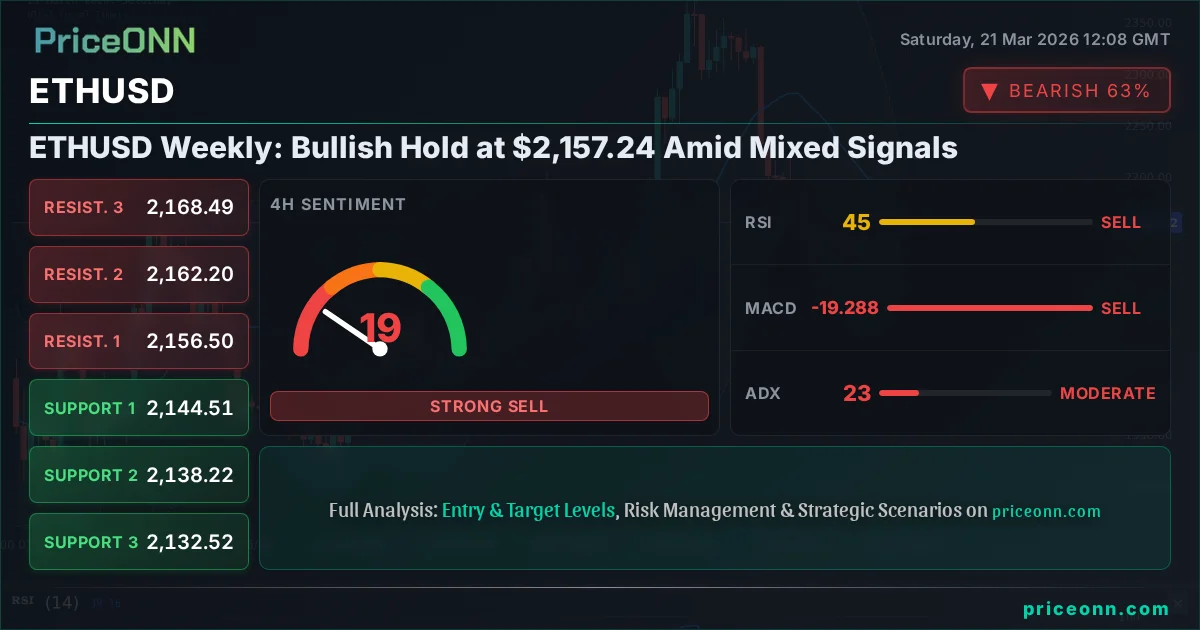
ETHUSD Weekly: Bullish Hold at $2,157.24 Amid Mixed Signals
ETHUSD holds $2,157.24 as mixed signals emerge. Key levels to watch next week as volatility persists. Technical outlook detailed.
ETHUSD finds itself at a critical juncture, currently trading around the $2,157.24 mark as the market digests a week filled with mixed technical signals and underlying macroeconomic currents. This level represents a significant psychological and technical point, with its holding or breaking potentially dictating the short-to-medium term trajectory for the second-largest cryptocurrency. After a week that saw significant price action across various asset classes, including sharp declines in gold and silver alongside a rally in oil and a strengthening dollar, the crypto market, particularly Ethereum, is navigating a complex landscape. The question on many traders' minds is whether the current holding pattern at $2,157.24 is a temporary pause before further downside, or a consolidation phase that could precede a renewed bullish push.
- ETHUSD is currently trading at $2,157.24, a crucial level for trend determination.
- On the 4-hour chart, the ADX reading of 23.43 suggests a moderate trend, while RSI and MACD histogram readings point towards a bearish momentum, creating a mixed technical picture.
- Key support levels are identified at $2,144.51 (4H) and $2,138.22 (4H), with resistance looming at $2,156.50 (4H) and $2,162.20 (4H).
- The DXY is strengthening, currently at 99.39, potentially exerting downward pressure on risk assets like ETHUSD.
The past week has been a turbulent one, underscoring the interconnectedness of global markets. Gold and silver prices experienced a sharp tumble, with XAUUSD shedding over 8.50% and XAGUSD falling over 6.80% in a single day, driven by escalating geopolitical tensions and a strengthening US Dollar Index (DXY), which has climbed to 99.39. This flight to safety, or perhaps a reallocation of capital, has seen traditional safe-haven assets under pressure, a counterintuitive move in the face of heightened global risks. Meanwhile, crude oil prices, particularly WTI, have surged, with WTI reaching $97.82 and Brent $112.79, reflecting concerns over supply disruptions in the Persian Gulf. This rise in energy prices adds another layer to the inflation narrative, a key factor influencing central bank policy decisions.
In the equity markets, major US indices like the S&P 500 and Nasdaq 100 have seen significant pullbacks, closing down 1.21% and 1.65% respectively on Friday. The Dow Jones Industrial Average also closed down, marking its fourth consecutive week of losses. This risk-off sentiment in equities often spills over into riskier assets, including cryptocurrencies. Against this backdrop, ETHUSD's current position at $2,157.24 is particularly noteworthy. While the broader market sentiment has been leaning bearish, Ethereum has shown some resilience, attempting to consolidate around this key price level. The daily chart shows a neutral trend with a 50% strength, indicating indecision, but the 1-hour and 4-hour charts present a more bearish technical picture with strong downtrend signals.
Navigating the Technical Landscape: Multiple Timeframe Insights
Delving into the technical indicators across different timeframes reveals a complex and often contradictory picture for ETHUSD. On the 1-hour chart, the trend is described as neutral with 50% strength, suggesting a lack of clear direction. However, the prevailing signals are leaning towards a buy, with a general signal of 'BUY' (Al: 6, Sat: 2, Nötr: 0). The RSI(14) stands at 56.42, indicating a neutral zone with a slight upward bias, suggesting that buyers are not yet exhausted but not in full control either. The MACD is showing positive momentum, with the MACD line above the signal line, reinforcing a short-term bullish bias. Stochastic indicators are also showing a buy signal with %K at 72.73 and %D at 63.32, firmly in bullish territory. Yet, the ADX at 16.18 points to a weak trend, implying that any upward movement might lack sustained strength. This confluence of signals on the 1-hour chart suggests a potential for short-term gains, but the weak trend indicated by ADX warns against expecting significant momentum.
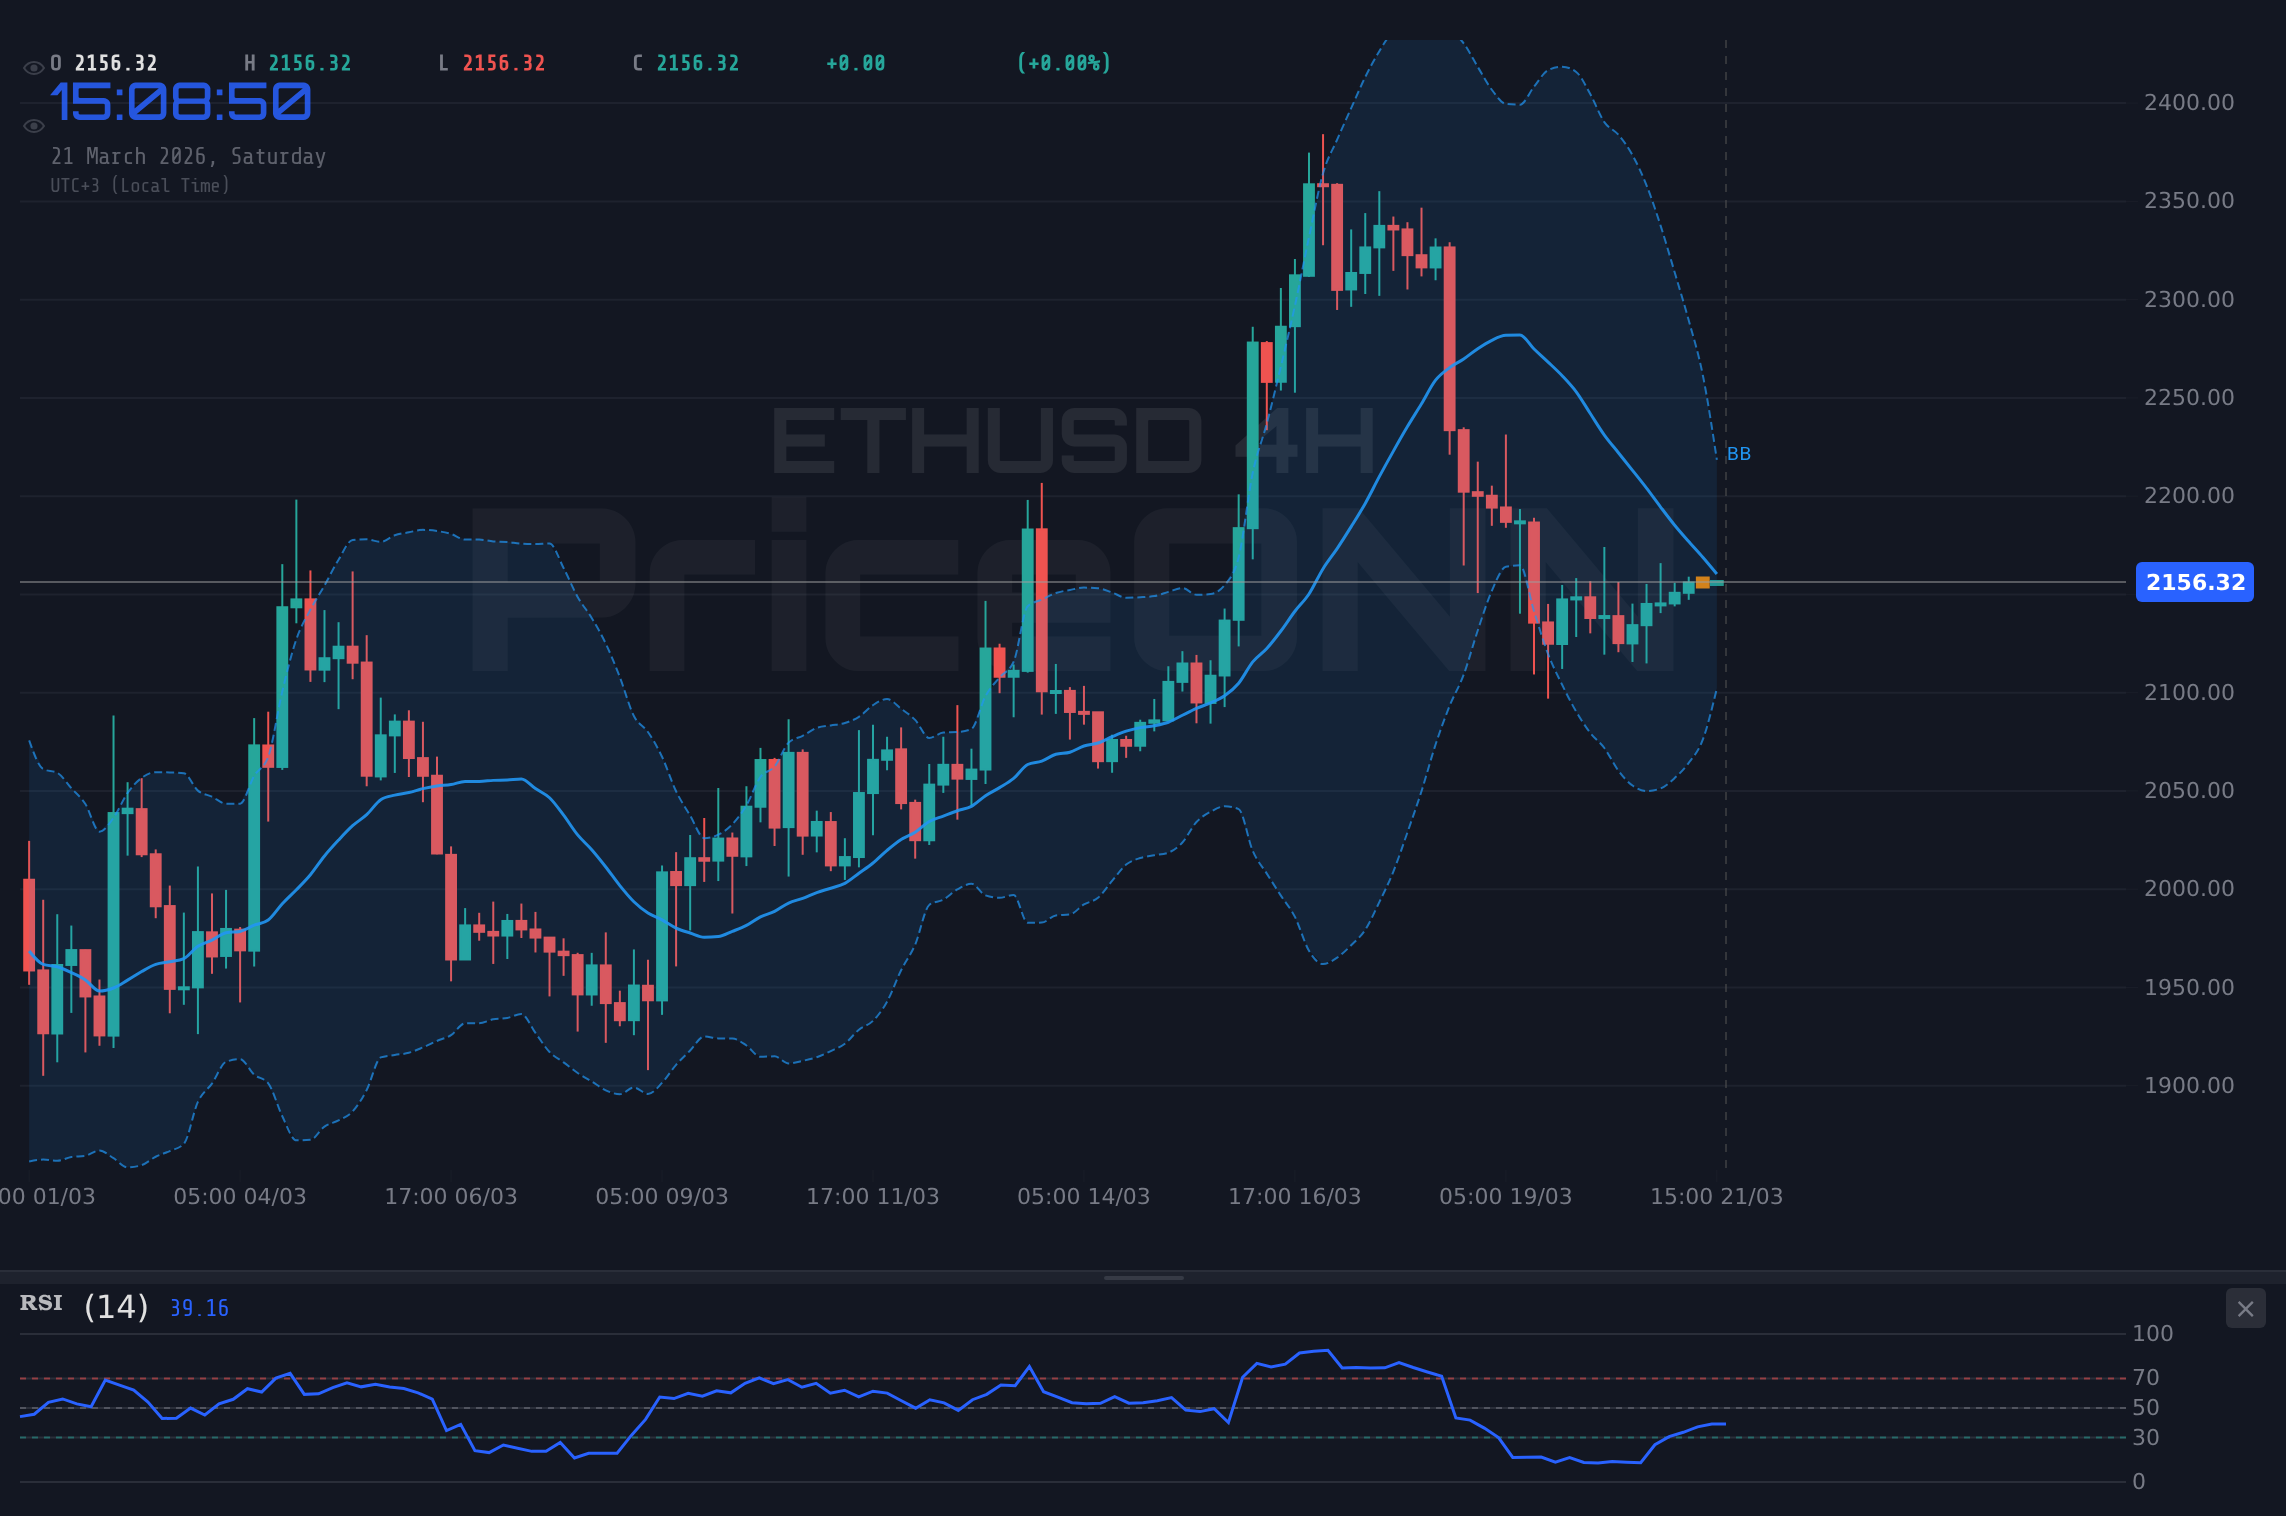
Shifting to the 4-hour timeframe, the technical narrative becomes more cautious, bordering on bearish. The trend is also neutral with 50% strength, but the general signal is a 'SELL' (Al: 3, Sat: 5, Nötr: 0). The RSI(14) has dipped to 44.85, moving closer to the oversold territory and indicating a weakening bullish sentiment or potential for a reversal. Crucially, the MACD is showing negative momentum, with the MACD line below the signal line, a classic bearish signal. The Stochastic indicator, while showing %K at 65.56 and %D at 45.23 (a bullish crossover), is in a zone that suggests caution, and the overall signal is leaning towards a sell. The ADX on this timeframe is 23.43, which is classified as a moderate trend strength, still not indicating a strong directional move but more pronounced than on the 1-hour chart. This timeframe suggests that the immediate upward pressure might be waning, and downside risks are beginning to emerge.
The daily timeframe offers a more defined perspective, leaning towards a bullish trend with 82% strength. The general signal here is 'BUY' (Al: 6, Sat: 2, Nötr: 0), which contrasts sharply with the 4-hour chart. The RSI(14) is at 52.24, residing in neutral territory but with a slight upward bias, suggesting room for growth before hitting overbought conditions. The MACD is positive, with the MACD line above the signal line, indicating bullish momentum. However, the Stochastic K line at 34.71 and D line at 63.70 present a bearish crossover, a signal that buyers might be losing control. The ADX at 23.89 indicates a moderate uptrend, aligning with the overall bullish sentiment on this timeframe. This divergence between the daily and 4-hour charts highlights the choppy nature of the current market, where short-term bearish pressures are being countered by a longer-term bullish bias.
Key Levels and Price Action: The $2,157.24 Battleground
The current price of $2,157.24 for ETHUSD is more than just a number; it's a critical battleground where short-term bearish pressures meet longer-term bullish aspirations. On the 4-hour chart, which often serves as a good barometer for intra-week movements, the immediate resistance is found at $2,156.50, followed by $2,162.20 and then $2,168.49. A decisive break and hold above $2,156.50 would be the first sign of bulls regaining control on this timeframe, potentially targeting the higher resistance levels. Conversely, support on the 4-hour chart lies at $2,144.51, $2,138.22, and $2,132.52. A close below $2,144.51 could signal a short-term bearish continuation, invalidating any immediate upside potential and opening the door for a test of the lower support zones. The proximity of the current price to these levels underscores the sensitivity of ETHUSD to immediate market forces.
Examining the daily timeframe provides a broader perspective on these critical levels. The immediate daily resistance is at $2,174.56, a level that needs to be breached convincingly to confirm a sustained bullish move. Beyond that, $2,203.97 and $2,233.81 stand as significant hurdles. On the downside, daily support is located at $2,115.31, $2,085.47, and $2,056.06. The $2,115.31 level is particularly important; a failure to hold this support could trigger a more significant sell-off, potentially retesting lower price points. The fact that ETHUSD is hovering just below the immediate 4-hour resistance ($2,156.50) while still showing a bullish bias on the daily chart creates a 'make or break' scenario for the coming days. Traders will be closely watching how price reacts to these immediate resistance and support zones, as a clear breakout or breakdown from this range could define the next significant move.
The ADX indicator provides further context to the strength of these potential moves. On the 4-hour chart, an ADX of 23.43 suggests a moderate trend. If price manages to break through resistance, this ADX might increase, confirming a stronger trend. Conversely, if price fails at resistance and heads towards support, the ADX could also rise, indicating a strengthening downtrend. On the daily chart, the ADX at 23.89 also points to a moderate uptrend, reinforcing the idea that while there's a bullish bias, the trend is not yet firmly established. This moderate trend strength means that breakouts could be genuine but also susceptible to failure if conviction doesn't build. The market is currently in a state of flux, where short-term technicals are flashing warning signs, but the longer-term picture still holds a bullish undertone. The key will be whether the price action can overcome the immediate selling pressure to reassert the daily bullish trend.
Macroeconomic Ripples and Geopolitical Undercurrents
The performance of ETHUSD cannot be viewed in isolation. The broader macroeconomic environment, heavily influenced by central bank policies and geopolitical events, plays a crucial role. The US Dollar Index (DXY) at 99.39 is on an upward trajectory, currently showing a strong daily uptrend with 92% strength. A strengthening dollar typically puts downward pressure on risk assets like cryptocurrencies, as it increases the cost of holding them for holders of other currencies and can signal a shift towards safer investments. The DXY's current level and upward momentum suggest that this headwind for ETHUSD is likely to persist, at least in the short term, unless there are significant shifts in monetary policy expectations or global risk sentiment.
The Federal Reserve's stance on interest rates remains a pivotal factor. While the provided data doesn't include specific Fed meeting minutes or future guidance, the general market sentiment, as reflected in the DXY's strength and the risk-off sentiment in equities, suggests that interest rate expectations might still be a concern for risk assets. If the market anticipates a prolonged period of higher rates, or even further hikes (though less likely now), this would typically dampen demand for speculative assets like ETHUSD. Conversely, any indication from Fed officials or economic data that supports an earlier-than-expected pivot towards rate cuts could provide a significant tailwind for cryptocurrencies.
Geopolitical tensions, particularly in the Middle East, are also casting a long shadow. The surge in oil prices (Brent at $112.79, WTI at $98.50) is a direct consequence of these heightened risks. Rising energy costs can fuel inflation concerns, potentially complicating central banks' efforts to manage price stability and thus influencing interest rate decisions. For cryptocurrencies, this environment can be a double-edged sword. On one hand, they are often viewed as a hedge against inflation or geopolitical uncertainty, potentially driving demand. On the other hand, they are still largely treated as risk assets, meaning that a broad flight to safety or a significant increase in global risk aversion could lead to sell-offs, as witnessed in gold and silver. The current market reaction, with risk assets like stocks and crypto showing weakness while oil soars and the dollar strengthens, suggests that the prevailing sentiment is one of caution and uncertainty, with inflation fears potentially outweighing the inflation-hedge narrative for now.
Trade Scenarios and Probability Assessments
Bearish Scenario: Consolidating Below Resistance
65% ProbabilityNeutral Scenario: Range-Bound Volatility
25% ProbabilityBullish Scenario: Breaking the Resistance Barrier
10% ProbabilityGiven the current technical indicators, particularly the bearish lean on the 4-hour chart and the prevailing risk-off sentiment in broader markets, the bearish scenario appears to be the most probable outcome in the short term. The ADX on the 4-hour chart at 23.43 suggests that if a breakdown occurs, it could gain moderate momentum. Invalidation of this bearish view would hinge on ETHUSD holding its ground and reclaiming the $2,156.50 resistance level, which would then open up possibilities for testing higher targets. The neutral scenario acknowledges the possibility of continued choppiness, especially if upcoming economic data fails to provide a clear directional catalyst. This could lead to ETHUSD oscillating within the defined support and resistance levels, offering trading opportunities for range-bound strategies.
The bullish scenario, while having the lowest probability at this juncture, cannot be entirely dismissed, especially considering the daily chart's bullish undertones. A strong catalyst, such as unexpectedly dovish commentary from the Federal Reserve or a significant de-escalation in geopolitical tensions, could spark a rally. However, for this scenario to materialize, ETHUSD would need to decisively break and hold above the $2,156.50 resistance on the 4-hour chart, followed by a push past $2,162.20. The confirmation would likely require a shift in broader market sentiment and a weakening of the US Dollar. Until then, the path of least resistance appears to be downwards in the very short term, with cautious optimism reserved for a confirmed break of key resistance levels.
Frequently Asked Questions: ETHUSD Analysis
What happens if ETHUSD breaks below the $2,144.51 support level?
If ETHUSD closes decisively below the $2,144.51 support on the 4-hour chart, it invalidates the immediate bullish outlook. This could trigger a sell-off targeting the next support at $2,138.22, with the potential to extend towards $2,132.52 as bearish momentum increases.
Should I consider buying ETHUSD at current levels around $2,157.24 given the mixed signals?
Caution is advised at current levels. While the daily chart shows a bullish trend, the 4-hour chart presents bearish momentum. A prudent approach would be to wait for a clear break above $2,156.50 resistance for a bullish entry, or a confirmed break below $2,144.51 support for a bearish trade, rather than attempting to catch a falling knife or fading a weak bounce.
Is the RSI at 44.85 on the 4-hour chart a sell signal for ETHUSD?
An RSI of 44.85 on the 4-hour chart indicates that momentum is leaning bearish but is not yet in oversold territory. While not an immediate sell signal on its own, it aligns with the negative MACD momentum and suggests that upside potential is currently limited, supporting the bearish scenario if key support levels fail.
How will the rising DXY at 99.39 affect ETHUSD's price action this week?
A rising US Dollar Index (DXY) to 99.39 typically acts as a headwind for risk assets like ETHUSD. This could increase selling pressure, making it harder for ETHUSD to break through resistance levels like $2,156.50 and potentially contributing to a test of support around $2,144.51.
The Road Ahead: What to Watch Next Week
Looking ahead, the ETHUSD price action will likely remain sensitive to shifts in broader market sentiment, macroeconomic data releases, and geopolitical developments. Key levels to watch will be the immediate 4-hour support at $2,144.51 and resistance at $2,156.50. A decisive break from this range will be crucial. Traders should monitor the DXY for any signs of reversal, as a weakening dollar could provide a much-needed boost to ETHUSD. Furthermore, any major news regarding central bank policy shifts or de-escalation in geopolitical hotspots could significantly alter the risk appetite and, consequently, the price trajectory of Ethereum.
The technical indicators, particularly the divergence between the daily and 4-hour timeframes, suggest that volatility is likely to continue. Confirmation of a sustained trend will be paramount. For a bullish outlook, holding above $2,156.50 and pushing towards $2,162.20 would be the primary objective. Conversely, a failure to hold $2,144.51 could lead to a retest of lower support levels, with $2,138.22 being the next significant zone. Patience and risk management will be key for traders navigating this uncertain environment. The market is currently at a crossroads, and the decisions made by price action at these critical levels in the coming days will set the tone for the near future.
Technical Outlook Summary
| Indicator | Value | Signal | Interpretation |
|---|---|---|---|
| RSI (14) | 44.85 | Bearish | Leaning bearish, not oversold. Suggests limited upside. |
| MACD Histogram | -0.75 | Bearish | Negative momentum confirmed. |
| Stochastic (%K/%D) | 65.56 / 45.23 | Bullish Crossover | Conflicting signal, but bearish MACD takes precedence. |
| ADX | 23.43 | Moderate Trend | Trend strength is present but not extreme. Breakouts could be valid. |
| Bollinger Bands | Mid-Band Break | Bearish Bias | Price is below the middle band, indicating downward pressure. |
Key Levels
Support Levels
Resistance Levels
Track markets in real-time
AI-powered analysis, technical indicators and real-time price data.
Join Our Telegram Channel
Breaking market news, AI analysis and trading signals instantly.
Join Channel