NZDUSD Dips to $0.5835: Analyzing the Bearish Week and Chart Signals
NZDUSD struggles at $0.5835 after a bearish week. Explore key levels, indicators, and the outlook for next week in this in-depth technical analysis.
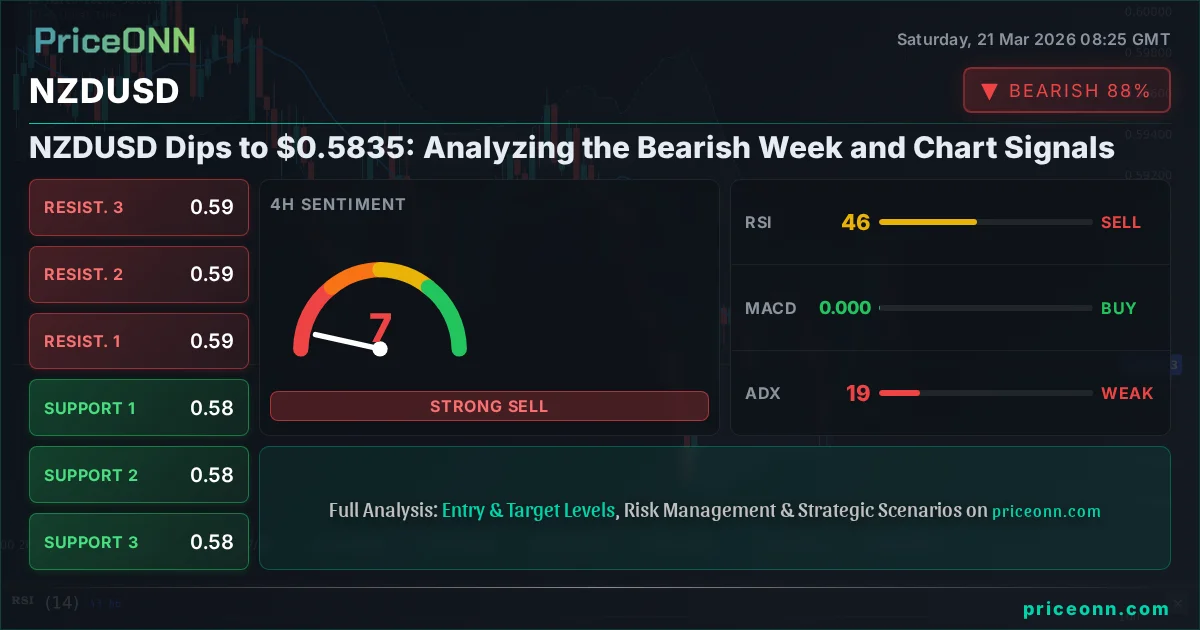
The New Zealand Dollar has faced significant headwinds, pushing NZDUSD down to $0.58350 by the close of last Friday. This marks the end of a predominantly bearish week for the pair, characterized by falling commodity prices and a strengthening US Dollar, as indicated by the DXY's rise to 99.39. The question on many traders' minds is whether this downward momentum will persist or if current levels present an opportunity for a bounce. This analysis dives deep into the technicals, exploring the signals from multiple timeframes and indicators to paint a picture of what lies ahead for NZDUSD.
- NZDUSD closed the week at $0.58350, marking a bearish trend with ADX at 28.29 on the daily chart.
- Key support sits at $0.58055, tested multiple times this week, with a break below potentially targeting $0.57411.
- RSI at 42.89 on the daily chart signals a bearish inclination, while the 1H RSI at 37.58 shows continued downward pressure.
- The DXY's climb to 99.39 indicates a strengthening dollar, adding to NZDUSD's woes, while Brent crude's surge to $112.79 highlights inflationary pressures that could influence central bank policy.
- A break below $0.58055 has a higher probability (60%) of occurring, targeting $0.57411, with potential for further downside if the $0.57411 level fails.
Navigating the Week's Sell-off: What Drove NZDUSD Lower?
Last week was unequivocally a challenging one for the New Zealand Dollar, with NZDUSD succumbing to a broad-based strengthening of the US Dollar. The Dollar Index (DXY) climbed to 99.39, reflecting a risk-off sentiment that often favors the greenback. This move put immediate pressure on risk-sensitive currencies like the Kiwi. Compounding this, the sharp decline in commodity prices, particularly gold and silver, which tumbled significantly, also weighed on the commodity-linked NZD. XAUUSD fell 3.28% to $4497.65, and XAGUSD dropped 6.67% to $67.90, signaling a potential shift in market appetite away from risk assets.
The geopolitical landscape, particularly escalating tensions in the Middle East, added another layer of uncertainty. While such events often boost safe-haven assets like gold, the broader market reaction saw a flight to the dollar and a sell-off in riskier commodities. This complex interplay of factors created a challenging environment for the NZDUSD. The pair's decline was not a gentle slide; it was a decisive move lower, breaking through key intraday levels and setting a bearish tone for the week. The question now is whether the technical indicators are flashing signals for a continuation of this trend or if a period of consolidation or even a reversal is on the cards.
On the economic front, while some data points offered glimmers of hope, they were not enough to counteract the dominant bearish forces. News regarding a narrower trade deficit for New Zealand, which typically supports the Kiwi, seemed to be overshadowed by the larger macroeconomic picture. Traders were more focused on the global inflation narrative, fueled by rising energy prices like Brent crude hitting $112.79, and the implications for central bank policies, particularly the US Federal Reserve. The market's reaction to these broader themes suggests that localized positive data might struggle to provide sustained support for NZDUSD in the current climate.
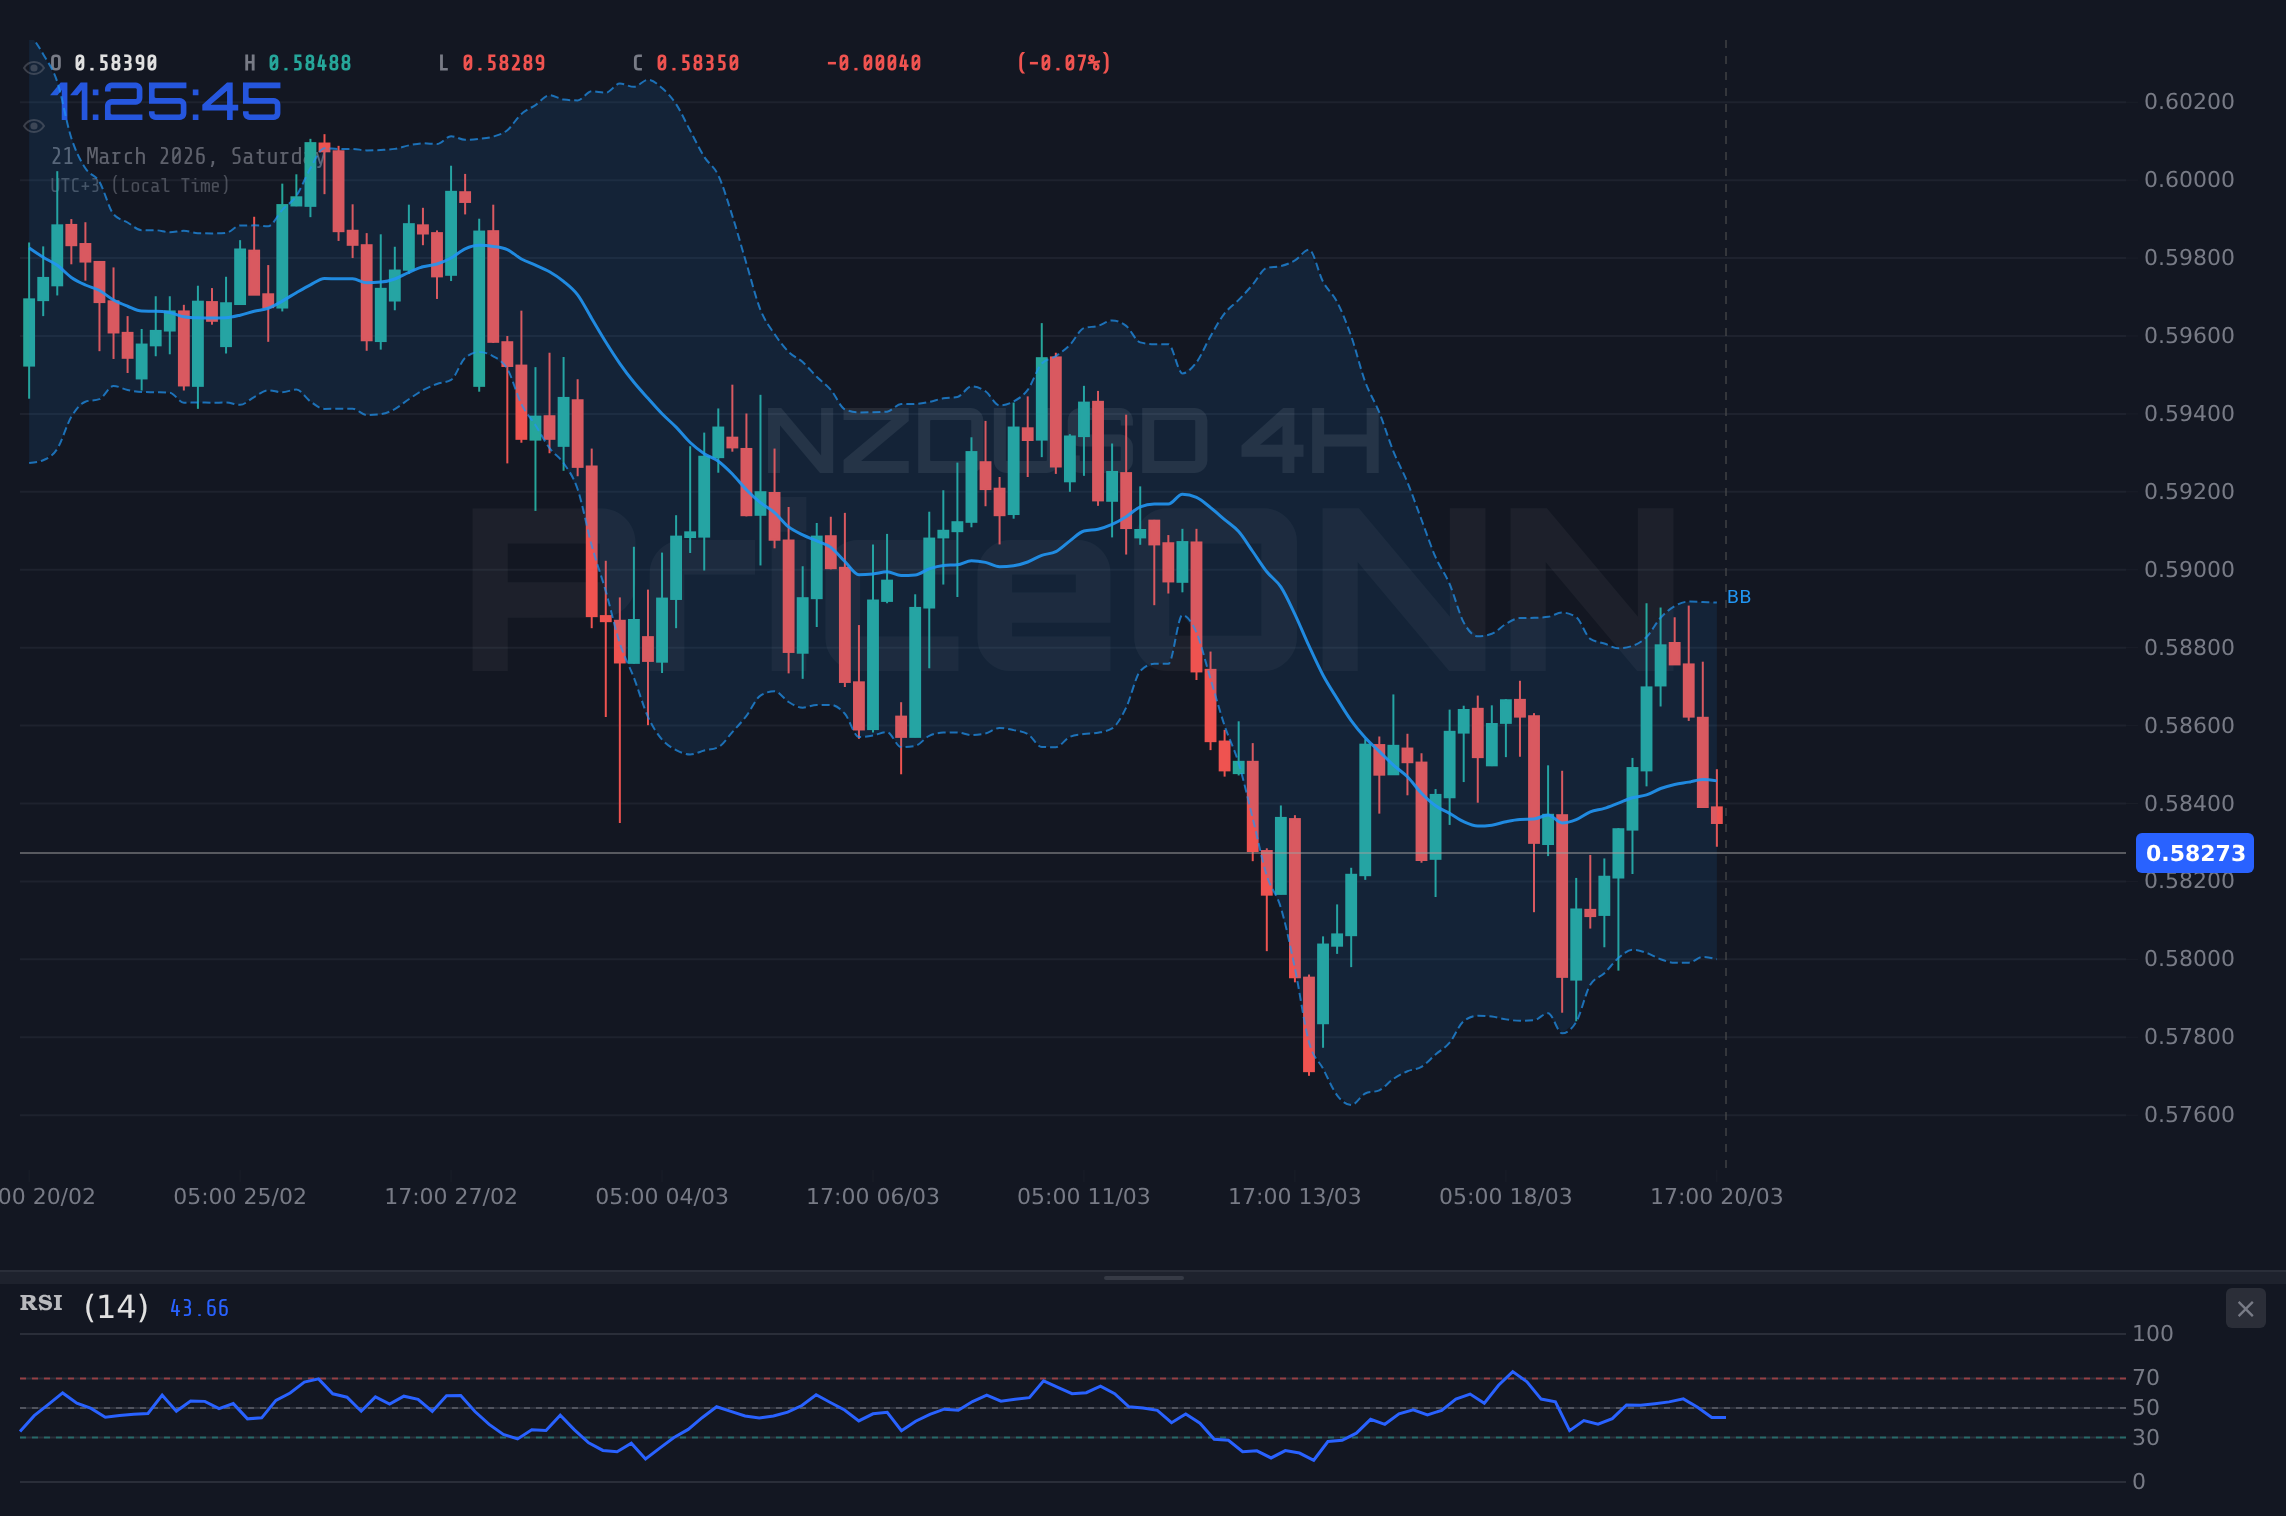
The price action itself tells a story. The daily chart for NZDUSD shows a clear downtrend with an ADX reading of 28.29, indicating a trend of moderate to strong conviction. The 4-hour chart, however, presents a slightly more nuanced picture with an ADX of 18.55, suggesting a weaker trend on that timeframe, potentially hinting at consolidation or choppiness within the larger downtrend. This divergence in trend strength across timeframes is crucial for understanding potential trading setups and the immediate directionality.
Examining the Technical Landscape: Indicators and Price Action
Delving into the technical indicators, the picture for NZDUSD remains largely bearish, especially when looking at the daily timeframe. The Relative Strength Index (RSI) on the daily chart stands at 42.89, firmly in neutral territory but leaning towards a bearish inclination, suggesting more room for downside before reaching oversold conditions. On the 1-hour chart, the RSI is at 37.58, indicating continued selling pressure in the short term. This consistent bearish lean across different timeframes reinforces the narrative of downward momentum.
The Moving Average Convergence Divergence (MACD) also paints a bearish outlook. On the 4-hour and daily charts, the MACD histogram is negative and the MACD line is below its signal line, confirming bearish momentum. While the 1-hour MACD shows positive momentum, this often represents a short-term counter-trend move within a larger bearish structure, and its divergence from the longer timeframes warrants caution. The Bollinger Bands on the daily chart show the price trading below the middle band, and on the 1-hour chart, the price is also below the middle band, with the lower band being tested. This suggests that the downside is being favored.
Stochastic oscillators offer mixed signals but lean towards oversold conditions on shorter timeframes, which could hint at a potential pause or bounce. On the 1-hour chart, K=9.76 and D=12.46, firmly in oversold territory, suggesting that the selling might be overextended in the very short term. The 4-hour Stochastic shows K=43.72 and D=61.32, a bearish signal with %K below %D, indicating further downside potential. The daily Stochastic has K=35.85 and D=44.21, also favoring a bearish move, though it's not yet in extreme oversold territory. This mixed signal from Stochastics highlights the need for confirmation from other indicators and price action before expecting a significant reversal.
The Average Directional Index (ADX) provides a clearer picture of trend strength. On the daily chart, the ADX is at 28.29, indicating a reasonably strong downtrend. However, on the 4-hour chart, the ADX drops to 18.55, suggesting a weaker trend or a period of consolidation. This discrepancy is important; while the daily trend is established, the intraday action might be more range-bound or prone to pullbacks. The 1-hour ADX at 24.55 suggests a moderate downtrend. The overall trend strength, particularly on the daily, supports the bearish bias, but the weaker ADX on the 4-hour chart warns against expecting a runaway trend without any consolidation.
Key Price Levels and Support/Resistance Dynamics
Examining the key levels for NZDUSD reveals a critical zone of support that has been under pressure. On the daily chart, the immediate support is identified at $0.58055. This level has been tested multiple times and represents a significant psychological and technical barrier. A decisive break below $0.58055 would likely open the door for further downside, with the next key support levels at $0.57411 and then $0.56982. The proximity of these levels suggests that a breakdown could lead to a rapid decline as liquidity is potentially 'raked' below the initial support.
On the resistance side, the immediate hurdle for any potential bounce lies at $0.58325. This level, representing the current price, acted as a point of contention throughout the week. Above this, we find resistance at $0.58640 on the 4-hour chart and $0.58908 on the daily chart. For the bearish thesis to be invalidated, NZDUSD would need to convincingly break and hold above these resistance levels, particularly the $0.58908 mark, which would then target higher levels like $0.59128 and potentially $0.59557.
The intraday levels also provide context. On the 1-hour chart, support is seen at $0.58148, $0.58086, and $0.57971. Resistance is located at $0.58325, $0.58440, and $0.58502. The interplay between these levels and the broader daily and 4-hour structures will dictate the short-term price action. If the pair fails to hold the $0.58055 daily support, the move towards the $0.57411 target becomes increasingly probable, especially if the DXY continues its upward trajectory or risk sentiment deteriorates further.
The current price of $0.58350 sits precariously close to the daily support at $0.58055. This proximity means that any significant market event or shift in sentiment could trigger a decisive move. Traders will be watching closely to see if the bears can push through this support or if buyers will step in to defend it, potentially leading to a short-covering rally or a period of consolidation. The failure of the previous week's positive news, such as the narrower trade deficit, to provide sustained support for the Kiwi further underscores the strength of the prevailing bearish sentiment.
Market Context and Correlation Analysis
The correlation between NZDUSD and the US Dollar Index (DXY) remains a critical factor. With the DXY currently at 99.39 and showing a strong upward trend on the daily chart (ADX 34.64), it exerts significant downward pressure on pairs like NZDUSD. A strengthening dollar typically makes it more expensive for holders of other currencies to buy US dollar-denominated assets, and vice versa. This inverse relationship is a cornerstone of forex trading, and the current DXY strength provides a clear macroeconomic backdrop for NZDUSD's weakness.
The performance of major equity indices also provides valuable insight into market sentiment. The S&P 500 (SP500) closed at 6536.05, down 1.21%, and the Nasdaq 100 (Nasdaq100) fell 1.65% to 23992.13. This broad sell-off in US equities suggests a decline in risk appetite. When investors become fearful, they tend to move capital away from riskier assets and into perceived safe havens, often the US Dollar. This risk-off environment further supports the bearish case for NZDUSD, which is generally considered a higher-risk currency.
Energy prices, particularly Brent crude oil at $112.79 and WTI at $98.50, are crucial indicators of inflationary pressures and geopolitical risks. The surge in oil prices, driven by Middle East tensions, contributes to global inflation concerns. This can lead central banks, including the Federal Reserve, to maintain or even increase interest rates to combat inflation. Higher interest rates in the US tend to strengthen the dollar, further exacerbating the weakness seen in NZDUSD. Conversely, if inflation fears subside or geopolitical risks de-escalate, it could lead to a reversal in oil prices and a potential shift in Fed policy expectations, which would be supportive of NZDUSD.
The cryptocurrency market, while often seen as a separate asset class, can also offer clues about risk sentiment. Bitcoin (BTCUSD) is trading around $70597, and Ethereum (ETHUSD) near $2152.93. While BTCUSD shows a mixed technical picture with a bearish 4H signal and a bullish 1D signal, the overall volatility in crypto markets can sometimes spill over into traditional markets, influencing risk appetite. Currently, the dominant narrative is one of caution, driven by traditional risk assets and the dollar's strength.
Connecting the Dots: Macro Drivers and Technical Signals
The current technical setup for NZDUSD, with its daily chart showing a downtrend and key indicators leaning bearish, aligns well with the prevailing macro environment. The strengthening DXY, falling equities, and rising oil prices all contribute to a narrative that is unfavorable for the New Zealand Dollar. The fact that NZDUSD failed to hold onto gains even when positive domestic data like the narrower trade deficit was released indicates that global factors are currently outweighing local economic specifics.
The divergence in trend strength between the daily (strong downtrend, ADX 28.29) and 4-hour (weaker trend, ADX 18.55) charts is a key point of observation. This suggests that while the overall direction is down, the intraday action might become more choppy. Traders looking for short-term opportunities might find the 1-hour chart more relevant, but they must be aware that it is operating within the confines of the larger bearish trend. Confirmation of a sustained move higher would require a break above significant resistance levels and a shift in the longer-term indicators.
The RSI readings across timeframes (Daily: 42.89, 1H: 37.58) suggest that there is still room for the downside before extreme oversold conditions are met, particularly on the daily chart. This implies that the bearish trend could have further legs. However, the oversold readings on the 1-hour Stochastic (K=9.76, D=12.46) could signal a short-term pause or a minor bounce, which could be an opportunity for a tactical short entry if the price fails to rally significantly. This highlights the importance of risk management and waiting for clear confirmation.
From a trader's perspective, the current environment demands caution. The confluence of bearish technical signals and a risk-averse macro backdrop makes a bearish outlook the most probable scenario. However, the weaker ADX on the 4-hour chart and the oversold conditions on the 1-hour Stochastic suggest that a sharp, continuous decline might not be immediate. Instead, we might see periods of consolidation or small rallies before the next leg down, if it occurs. The key will be watching how price action interacts with the critical support level at $0.58055.
Bearish Scenario: Downside Momentum Continues
60% ProbabilityNeutral Scenario: Consolidation Around $0.58350
25% ProbabilityBullish Scenario: Short-Term Rebound Potential
15% ProbabilityLooking Ahead: Key Events and Levels to Watch Next Week
As we head into the new trading week, the focus for NZDUSD will remain on the confluence of global macroeconomic factors and its own technical structure. The key support level at $0.58055 is paramount. A failure to hold this level would likely trigger further selling, especially if the DXY continues its ascent and risk sentiment remains subdued. The market will be keenly watching upcoming economic data from both New Zealand and the United States, particularly inflation figures and employment reports, which could influence central bank policy expectations.
The strengthening US Dollar, driven by the DXY's current level of 99.39 and a hawkish outlook from the Federal Reserve, is likely to remain a dominant theme. Any signs of continued dollar strength or further escalation of geopolitical tensions in the Middle East could put additional pressure on NZDUSD. Conversely, a significant shift in risk sentiment, a dovish turn from the Fed, or surprisingly strong domestic data from New Zealand could provide a much-needed catalyst for a bullish reversal. However, based on current technicals and macro conditions, the path of least resistance appears to be to the downside.
Traders should pay close attention to the $0.58055 support. A break below this level could signal a move towards $0.57411, especially if accompanied by a surge in volume and a continuation of the bearish trend indicated by the daily ADX at 28.29. On the upside, a convincing break and hold above $0.58908 would be required to invalidate the bearish outlook and suggest a potential move towards higher resistance levels. The 4-hour chart's weaker trend strength (ADX 18.55) suggests that any rallies might be met with selling pressure, making short opportunities more attractive if they align with the overall bearish bias.
Ultimately, the NZDUSD's trajectory will likely be dictated by the interplay between global risk sentiment, US dollar strength, and the evolving inflation and interest rate outlook. The technicals provide a roadmap of potential price levels and scenarios, but the fundamental drivers will be the ultimate arbiter of direction. Patience and disciplined risk management will be key for navigating the potential volatility ahead, waiting for clear signals and setups rather than chasing moves.
Frequently Asked Questions: NZDUSD Analysis
What happens if NZDUSD breaks below the $0.58055 support level?
A break below the critical daily support at $0.58055 would likely invalidate any immediate bullish hopes and trigger further selling pressure. The next significant downside targets would be $0.57411 and potentially $0.56982, especially if the broader market sentiment remains risk-off and the DXY continues to strengthen.
Should I consider a short position at current levels around $0.58350 given the bearish trend?
Given the prevailing bearish sentiment and technical indicators like the daily RSI at 42.89, a short position could be considered, but with caution. A trigger would be a confirmed break below $0.58055. Invalidation would occur if price decisively breaks above $0.58908. The risk/reward ratio should be carefully assessed, and stop-loss orders are essential.
Is the 1-hour RSI at 37.58 a sell signal for NZDUSD right now?
An RSI of 37.58 on the 1-hour chart indicates downward momentum, supporting a bearish outlook in the short term. However, it's not yet in extreme oversold territory, suggesting there might be room for further downside or a brief pause before any significant move. It's best used in conjunction with other indicators and price action confirmation.
How will the DXY's rise to 99.39 and oil prices above $112 impact NZDUSD next week?
The strengthening DXY to 99.39 typically exerts downward pressure on NZDUSD due to the inverse correlation. Rising oil prices ($112.79 for Brent) contribute to inflation fears, potentially reinforcing a hawkish stance from central banks like the Fed, which further supports the dollar. This combination suggests continued headwinds for NZDUSD unless major geopolitical or policy shifts occur.
| Indicator | Value | Signal | Interpretation |
|---|---|---|---|
| RSI (14) | 42.89 | Bearish | Leaning bearish, room for downside |
| MACD Histogram | -0.00348 | Bearish | Negative momentum confirmed |
| Stochastic %K | 35.85 | Bearish | Favoring downside, not extreme oversold |
| ADX | 28.29 | Bullish | Strong downtrend confirmed |
| Bollinger Bands | Below Middle Band | Bearish | Price pressure observed |
Track markets in real-time
AI-powered analysis, technical indicators and real-time price data.
Join Our Telegram Channel
Breaking market news, AI analysis and trading signals instantly.
Join Channel