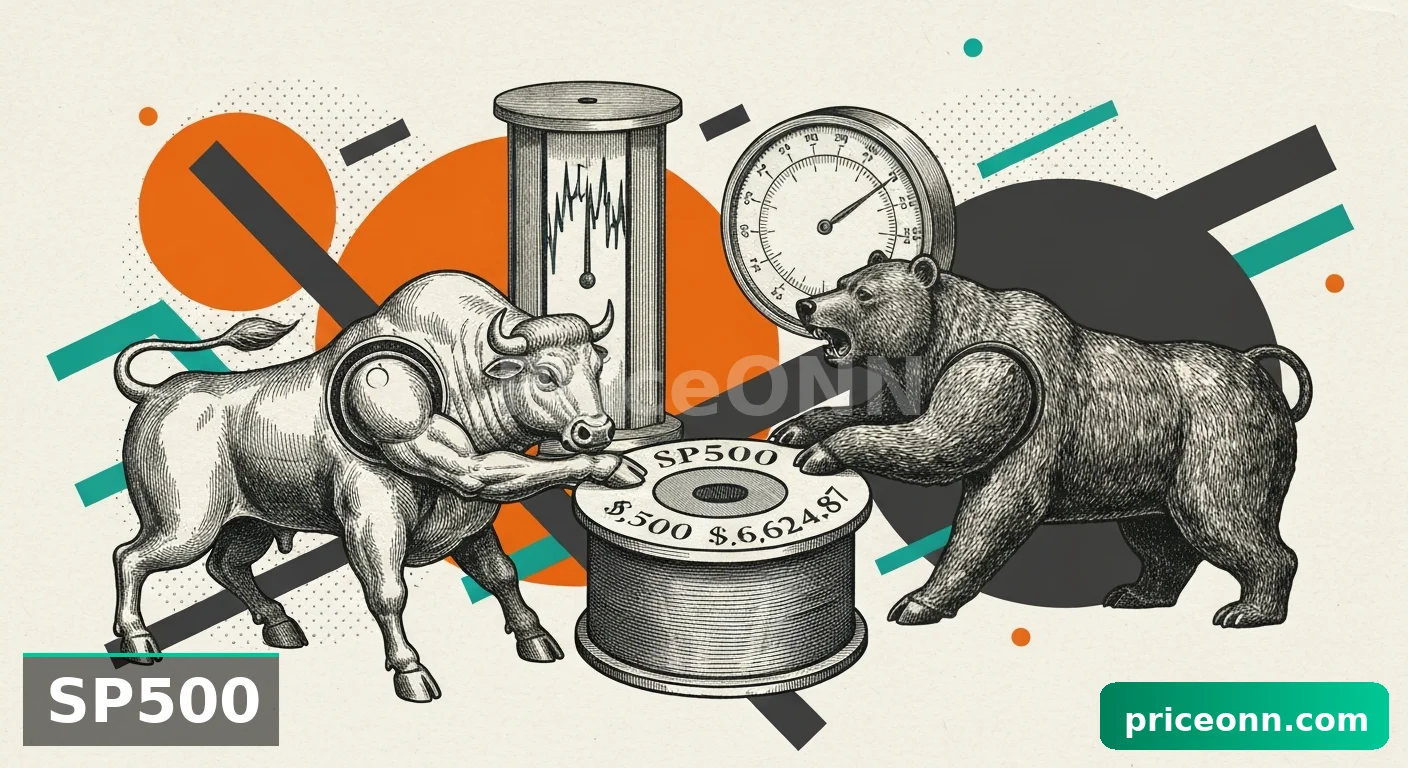
SP500 Tests $6,536.05 Support Amidst Broad Market Selloff
The S&P 500 index is trading at $6,536.05, facing strong selling pressure as geopolitical tensions escalate and risk appetite wanes. Key support levels are being tested.
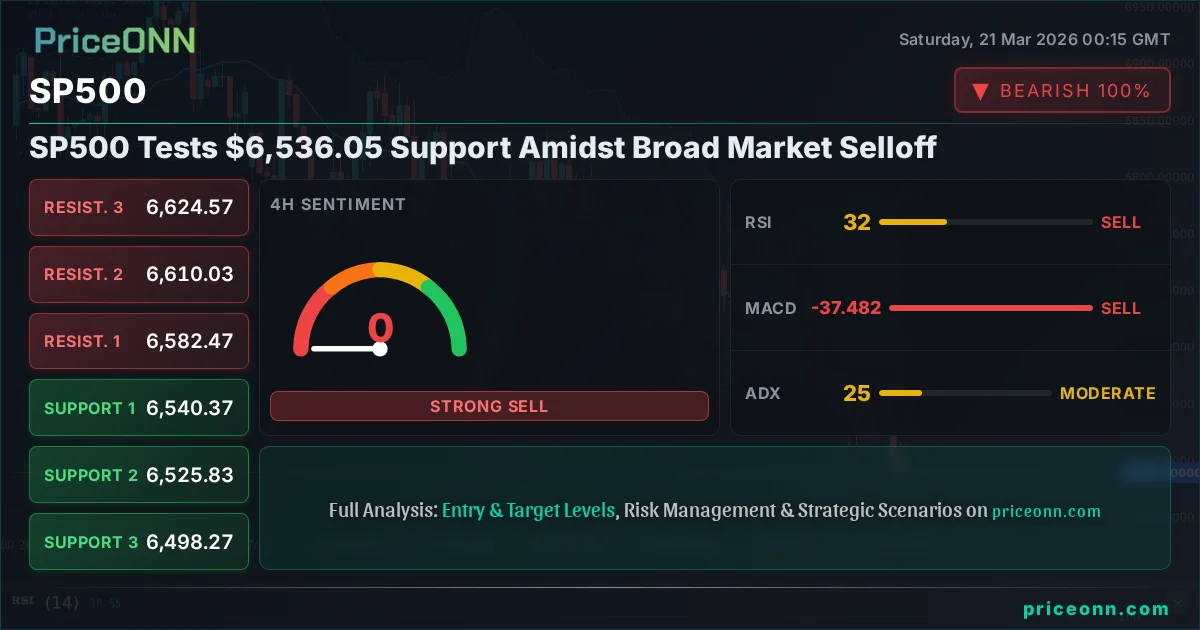
The S&P 500 index experienced a significant downturn last week, closing at $6,536.05, reflecting a broad-based retreat across major U.S. equity markets. This sharp decline, marked by an -80.15 point drop (-1.21%) on Friday alone, signals a growing risk-off sentiment as geopolitical uncertainties intensify. With the index now trading near its year-to-date lows, the question on every trader's mind is whether this represents a temporary pause or the beginning of a more substantial correction. The technical indicators are flashing mixed signals, but the prevailing trend on the daily chart is undeniably bearish, demanding a cautious approach from investors.
- The S&P 500 closed Friday at $6,536.05, marking a year-to-date low amidst escalating geopolitical tensions.
- Key support for the SP500 sits at $6,491.30 on the 1-hour chart, with significant levels at $6,476.40 and $6,450.90.
- The RSI(14) on the 1-hour chart is at 37.5, indicating bearish momentum is building but not yet in oversold territory.
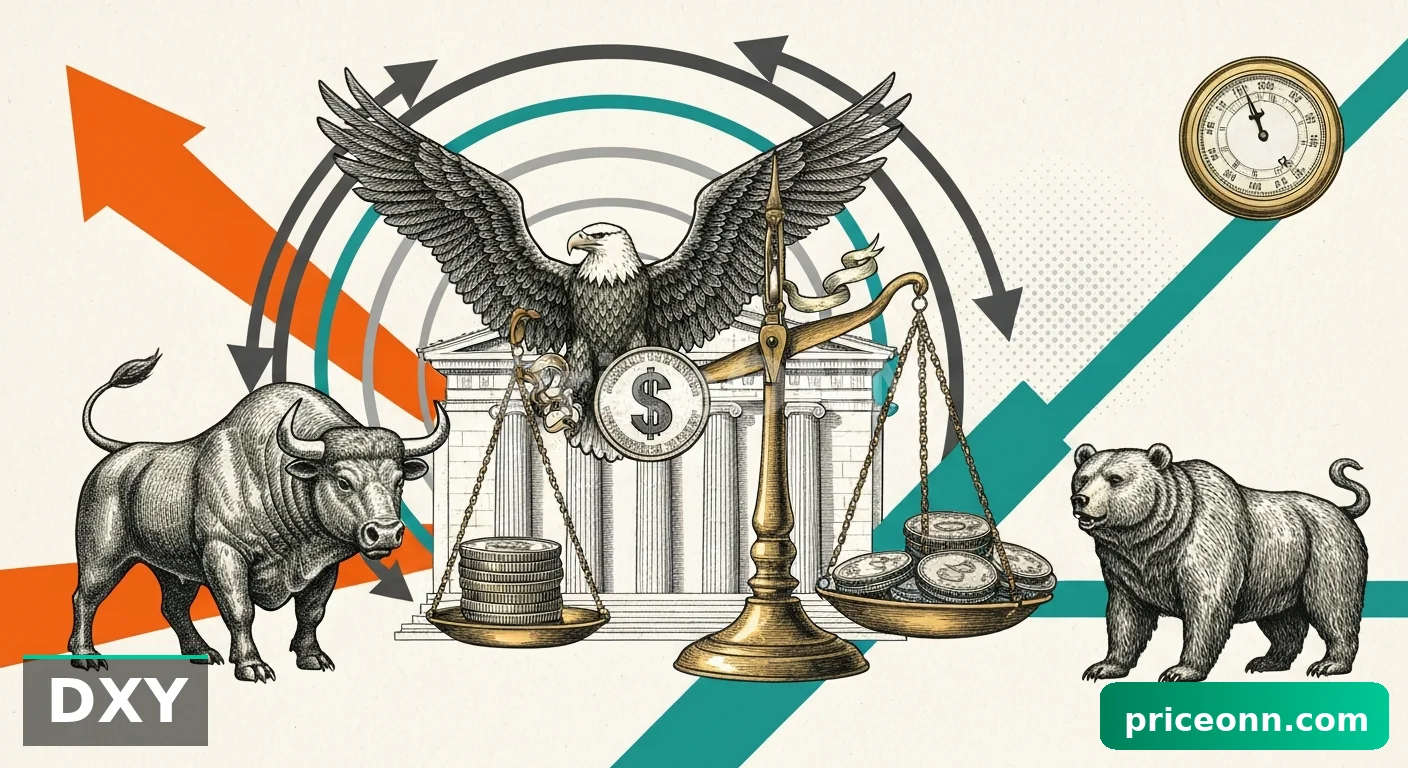
- The correlation with a strengthening DXY (currently at 99.39) suggests continued pressure on equities as investors seek safe-haven assets.
Last week was characterized by a palpable sense of unease in the financial markets, with the S&P 500 bearing the brunt of the selling pressure. The index's failure to hold above the $6,600 mark proved to be a critical turning point, triggering a cascade of sell orders that pushed prices down towards the $6,500 psychological level. This downward momentum was not isolated; the Nasdaq 100 also saw a substantial decline, falling 1.65% to 23,992.13, while the Dow Jones Industrial Average shed 0.62% to close at 45,801. This synchronized selloff across major U.S. indices underscores a widespread aversion to risk, likely fueled by escalating geopolitical developments and persistent inflation concerns that continue to challenge central bank policies. The market sentiment has clearly shifted from cautious optimism to outright fear, and the price action reflects this dramatic change.
Navigating the Storm: Technical Indicators Sounding the Alarm
The Daily Chart's Bearish Bias
On the daily timeframe, the S&P 500's technical picture is increasingly bearish. The index has decisively broken below the mid-Bollinger Band, a signal that often precedes further downside. The current price of $6,536.05 is trading precariously close to the lower Bollinger Band, currently situated around $6,486.83 on the daily chart. This proximity suggests that the market is entering oversold territory on this longer timeframe, but historical patterns indicate that such levels can still be breached in strong downtrends. The ADX on the daily chart stands at 44.59, confirming a strong downtrend is firmly in place. This is not a market for the faint of heart; the trend strength suggests that any bounces are likely to be short-lived and met with renewed selling pressure.
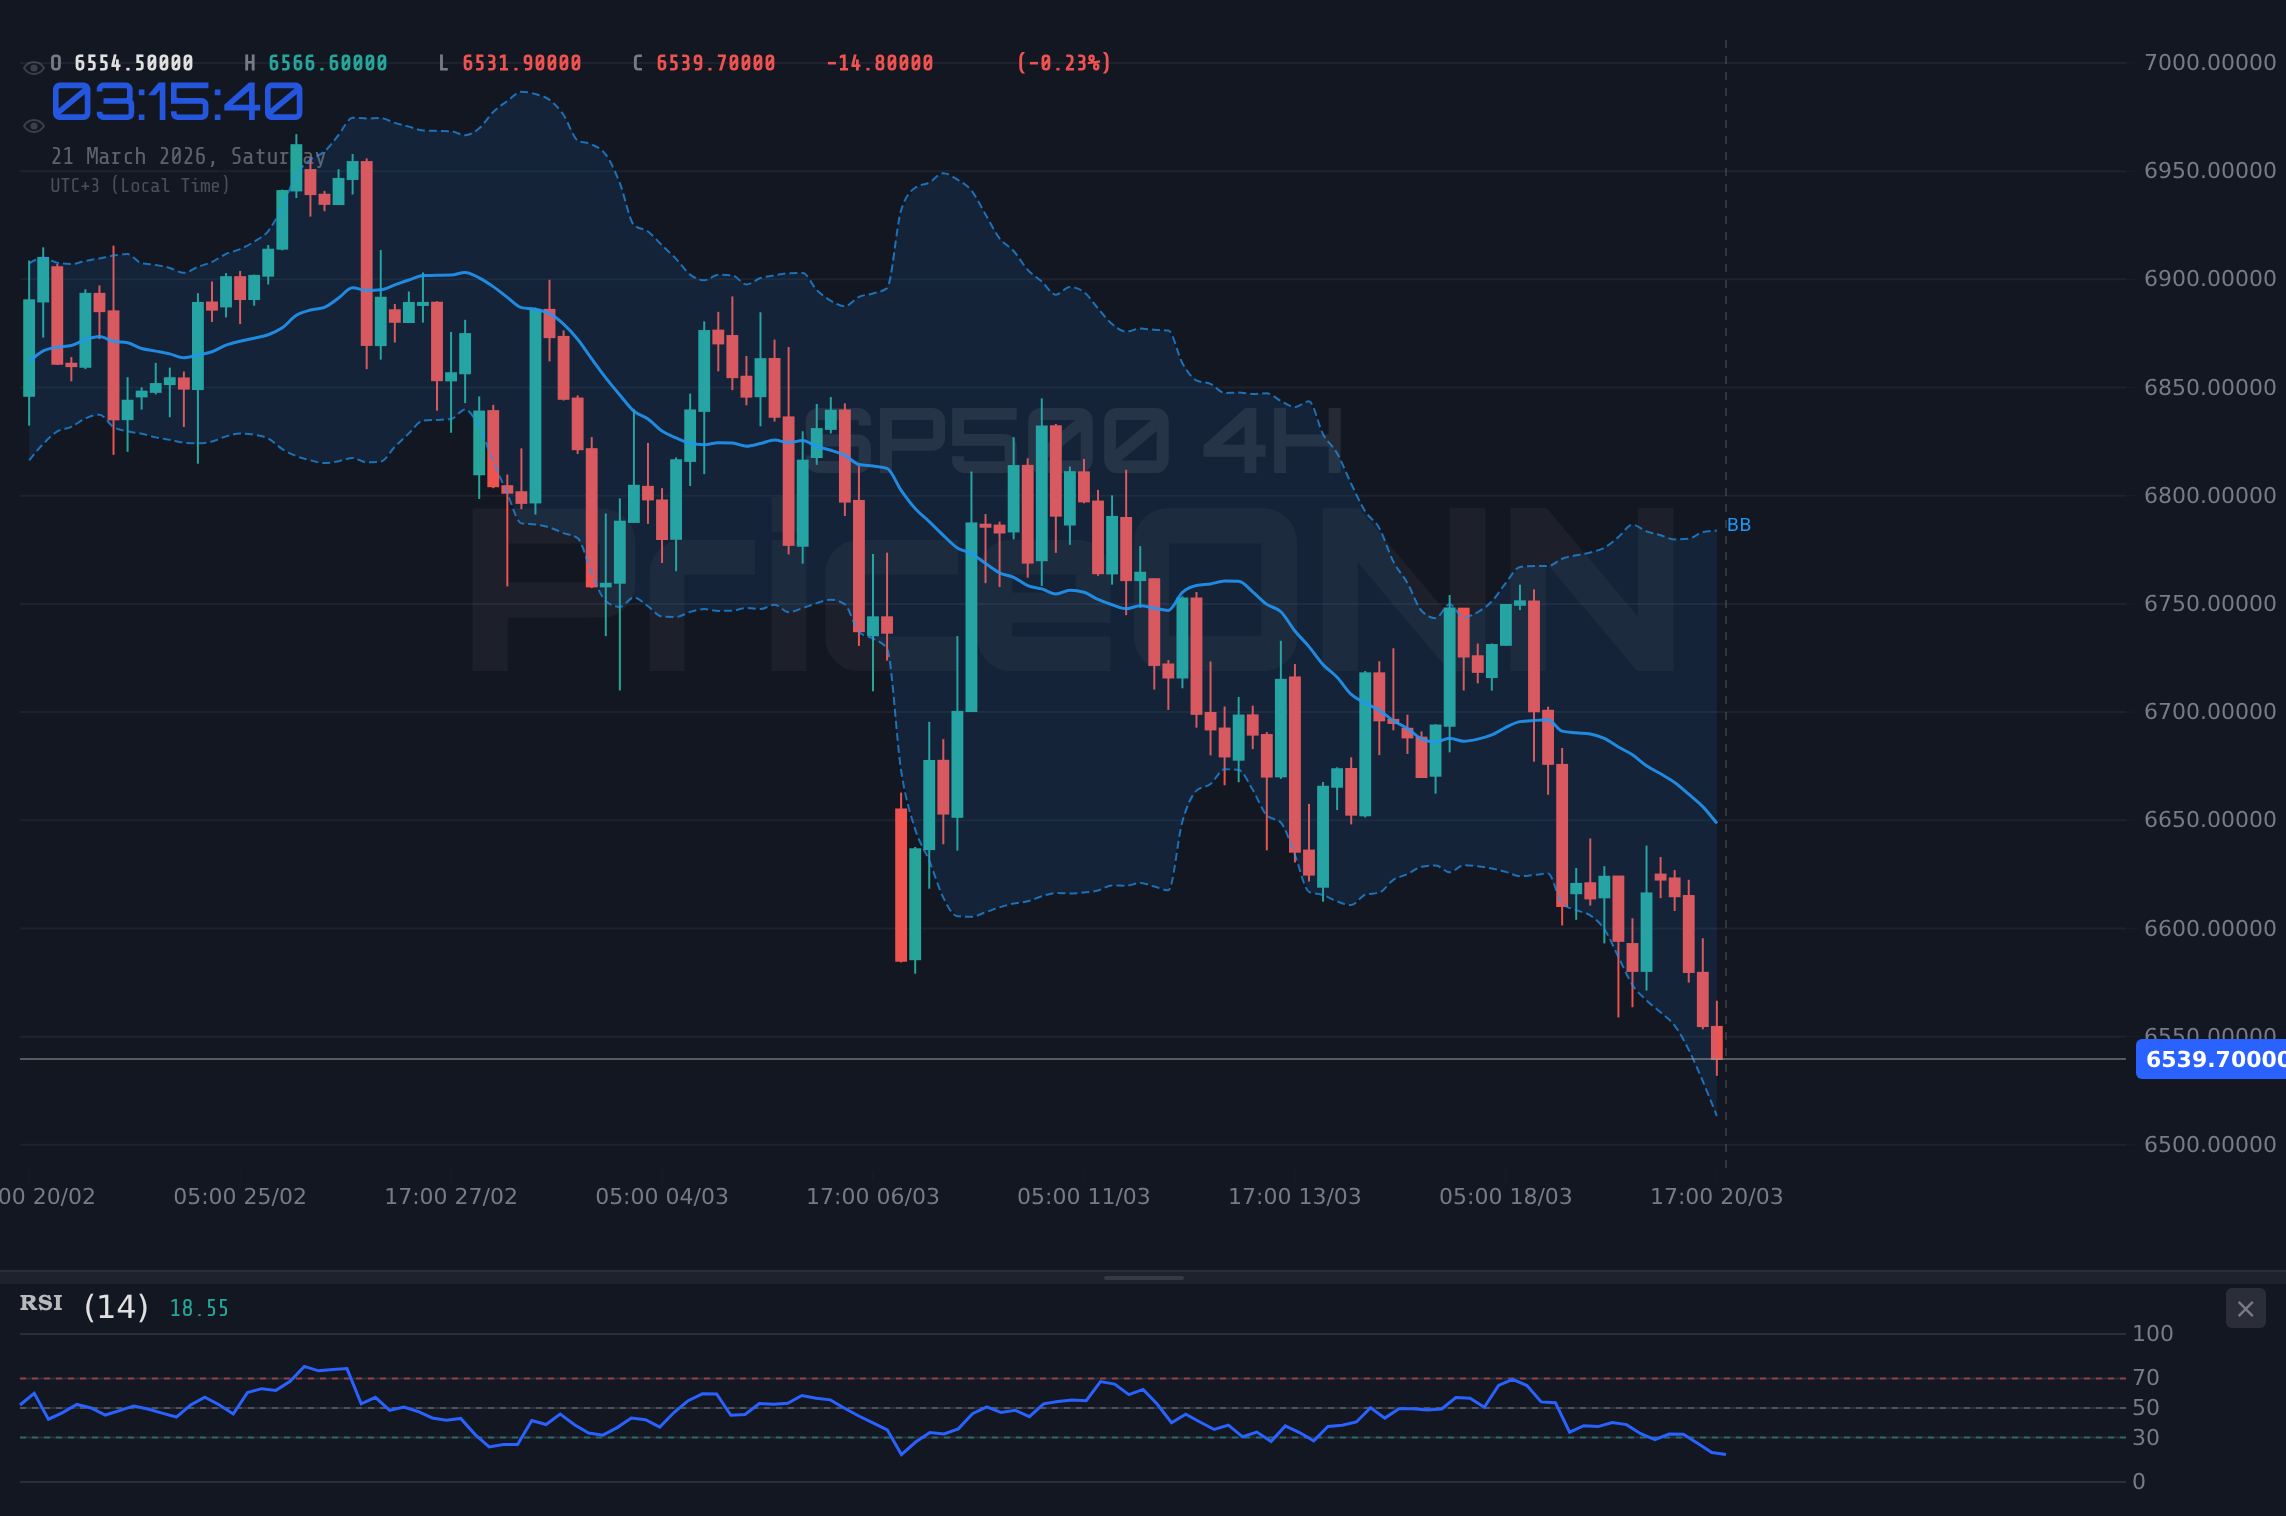
The Relative Strength Index (RSI) on the daily chart is currently at 32.5. While this is approaching the oversold threshold of 30, it has plenty of room to fall further, as evidenced by previous capitulation events. The MACD histogram remains negative and is still below its signal line, reinforcing the bearish momentum. Similarly, the Stochastic Oscillator shows %K at 16.23 and %D at 27.82, firmly in oversold territory and indicating a potential for a short-term oversold bounce, but the overall trend remains firmly down. The confluence of these indicators on the daily chart paints a clear picture: the bears are in control, and any signs of weakness should be treated with extreme caution. The trend strength indicated by the ADX at 44.59 is particularly concerning, suggesting that this downward move has significant legs.
Intraday Action: A Battle for Levels
Looking at the 1-hour and 4-hour charts offers a more granular view of the intraday dynamics. On the 1-hour chart, the SP500 is trading at $6,536.05, with immediate support identified at $6,491.30. This level is critical; a break below it could accelerate the decline towards the next support at $6,476.40 and then $6,450.90. The RSI(14) on this timeframe is 37.5, reflecting bearish momentum but not yet extreme oversold conditions, leaving room for further downside. The MACD histogram is negative, and the Stochastic Oscillator (%K at 21.76, %D at 17.19) is showing a slight upward turn from oversold levels, suggesting a potential for a minor bounce, but the ADX at 37.97 still indicates a strong downtrend is in play on this short timeframe. This suggests that any intraday rallies might be short-lived opportunities for profit-taking rather than the start of a sustained recovery.
The 4-hour chart provides a slightly different perspective, showing the trend as bearish with 92% strength. Support levels are marked at $6,540.37, $6,525.83, and $6,498.27. Resistance looms overhead, with the closest level at $6,582.47, followed by $6,610.03 and $6,624.57. The RSI(14) at 32.29 is deeply oversold on this timeframe, hinting at a potential for a more significant bounce. However, the MACD remains negative, and the Stochastic Oscillator (%K at 10.33, %D at 26.53) is also oversold, reinforcing the idea that a short-term reversal could be brewing. The ADX at 24.88 suggests a moderate downtrend, less aggressive than the daily chart but still indicating downward pressure. This conflicting signal between the daily's strong downtrend and the 4-hour's oversold conditions presents a challenge for traders, highlighting the need for careful risk management and clear entry/exit strategies.
Correlation Analysis: DXY Strength and Equity Weakness
The Dollar's Dominance
The U.S. Dollar Index (DXY) has been on a tear, currently trading at 99.39 and showing a strong upward trend on the daily timeframe with 92% strength. This strength in the dollar is a significant headwind for equities, including the S&P 500. Historically, a rising DXY often correlates with falling stock prices, as it makes U.S. exports more expensive and can signal capital flowing into safer dollar-denominated assets. The DXY's current upward trajectory, supported by positive momentum on the MACD and a daily ADX of 34.64 indicating a strong uptrend, suggests that this trend is likely to continue in the short to medium term. This persistent dollar strength is likely exacerbating the selling pressure on the S&P 500, as investors reallocate capital away from riskier assets and towards the perceived safety of the greenback.
Risk Appetite and Oil Prices
The correlation between risk appetite and oil prices is also a critical factor to monitor. Brent Crude is currently trading at $112.79, showing a strong upward move with 100% strength on the daily chart, while WTI is at $98.50, also exhibiting a strong daily uptrend. This surge in oil prices, driven by geopolitical tensions and supply concerns, directly impacts inflation expectations. Higher energy costs can squeeze corporate profit margins and reduce consumer spending power, further dampening sentiment towards equities like the S&P 500. The fact that both oil benchmarks are showing such robust upward momentum suggests that inflationary pressures remain a significant concern for the market, potentially forcing central banks to maintain a hawkish stance or even consider further tightening, which is typically bearish for stocks. This dynamic creates a challenging environment for the S&P 500, caught between rising inflation and the prospect of tighter monetary policy.
Fundamental Drivers: Geopolitics and Monetary Policy Fears
Geopolitical Tensions Take Center Stage
The recent escalation of geopolitical conflicts has undoubtedly been a major catalyst for the market's downturn. Reports from sources like Reuters and Bloomberg have highlighted increasing tensions in the Middle East and other regions, leading to a surge in safe-haven demand. Gold, for instance, has seen significant volatility, trading around $4,497.65, reflecting its role as a traditional safe haven during times of uncertainty. This heightened geopolitical risk directly impacts investor confidence, leading to a withdrawal from riskier assets like equities. The uncertainty surrounding the duration and potential escalation of these conflicts creates a volatile environment, making it difficult for businesses to plan and invest, which in turn weighs on stock market performance. The market's reaction suggests that investors are pricing in a prolonged period of elevated geopolitical risk, which is unlikely to abate anytime soon.
Monetary Policy Uncertainty Looms Large
Compounding the geopolitical concerns are persistent fears surrounding monetary policy. While inflation data has shown some signs of cooling, central banks, particularly the Federal Reserve, remain vigilant. The market is keenly watching for any signals that might indicate a shift in policy direction, but the current data does not yet provide a clear mandate for significant easing. Fed Fund Futures and OIS pricing, while not explicitly provided here, are constantly being repriced based on incoming economic data and central bank commentary. If inflation proves more stubborn than anticipated, or if geopolitical events disrupt supply chains further, central banks might be forced to maintain higher interest rates for longer, or even consider further hikes. This prospect of prolonged higher rates is a significant overhang for the stock market, as it increases borrowing costs for companies and reduces the present value of future earnings, thereby putting downward pressure on stock valuations. The current price action in the S&P 500 suggests that the market is increasingly factoring in a scenario of higher-for-longer interest rates, which is a bearish outlook.
Trade Scenarios for SP500
Bearish Scenario: Downside Momentum Continues
65% ProbabilityNeutral Scenario: Consolidation Around $6,536
25% ProbabilityBullish Scenario: Short-Term Reversal Attempt
10% ProbabilityKey Levels to Watch
Market Outlook and Trader's Strategy
The Path Forward
The immediate outlook for the S&P 500 remains decidedly bearish. The confluence of strong downtrend signals across multiple timeframes, coupled with escalating geopolitical risks and persistent inflation worries, creates a challenging environment. The $6,536.05 level represents a critical juncture; a failure to hold this support could trigger further significant declines. Traders should exercise extreme caution and prioritize risk management. Any short-term rallies should be viewed as potential opportunities for profit-taking or re-entry at better levels on the short side, rather than the start of a sustainable recovery. The ADX readings across all timeframes, particularly the daily's 44.59, underscore the strength of the current bearish trend, suggesting that betting against the trend is a high-risk strategy.
For those considering trades, the strategy should revolve around the key support and resistance levels identified. A break below $6,491.30 is likely to accelerate the decline, offering a clear entry point for short positions targeting $6,476.40 and potentially $6,450.90. Conversely, a sustained move above $6,582.47, confirmed by strong volume and positive momentum divergence across indicators, could signal a temporary bottom. However, given the current market sentiment and the strength of the bearish trend, such a bullish scenario appears less probable in the immediate short term. Investors should look for confirmation signals and avoid trying to catch a falling knife. Patience and discipline will be key in navigating this volatile market landscape.
What to Watch Next Week
Looking ahead to the coming week, market participants will be closely monitoring geopolitical developments for any signs of de-escalation or further escalation. Economic data releases, particularly any inflation or employment figures that might influence central bank policy expectations, will also be crucial. Any unexpected hawkish commentary from the Federal Reserve or other major central banks could further pressure equity markets. From a technical standpoint, the $6,536.05 level remains the immediate focus. A decisive break below this point will likely confirm the bearish scenario, while a strong rebound from current levels could signal a temporary reprieve. Traders should remain vigilant, adhere to their risk management strategies, and wait for clear setups before committing capital. The market is currently driven by fear, and only clear shifts in fundamental drivers or technical structures will likely alter the current bearish trajectory.
| Indicator | Value | Signal | Interpretation |
|---|---|---|---|
| RSI (14) | 32.5 | Bearish | Daily oversold, but trend strength suggests further downside possible. |
| MACD Histogram | -15.20 | Bearish | Negative momentum continues, below signal line. |
| Stochastic | K: 16.23, D: 27.82 | Bearish | Daily oversold, but trend remains dominant. |
| ADX | 44.59 | Strong Trend | Confirms a strong and persistent downtrend on daily chart. |
| Bollinger Bands | Lower Band Breach | Bearish | Price trading below lower band, indicating extreme selling pressure. |
Frequently Asked Questions: SP500 Analysis
What happens if SP500 breaks below the $6,491.30 support level?
A break below $6,491.30 on the 1-hour chart would likely accelerate selling pressure, potentially triggering a move towards the next significant support at $6,476.40. The ADX at 37.97 on this timeframe indicates strong downtrend momentum, making a further decline probable.
Should I consider buying SP500 at current levels of $6,536.05 given the oversold RSI on the 4-hour chart?
While the 4-hour RSI at 32.29 is oversold, the daily chart's strong bearish trend (ADX 44.59) and price action below the daily lower Bollinger Band suggest caution. Buying here without confirmation of a trend reversal or a strong bounce signal carries significant risk, with a 65% probability favoring further downside according to our analysis.
Is the Stochastic Oscillator reading of K:16.23, D:27.82 a reliable sell signal for SP500 right now?
The Stochastic Oscillator being in oversold territory on the daily chart (K:16.23, D:27.82) typically signals potential for a bounce, not a sell signal. However, in the context of a strong downtrend confirmed by ADX 44.59, this reading suggests that the selling pressure might be temporarily exhausted, but does not confirm a trend reversal. It's more of an oversold condition awaiting confirmation.
How will ongoing geopolitical tensions and potential Fed policy shifts impact SP500 this week?
Heightened geopolitical risks are currently fueling risk aversion, pushing investors away from equities like the SP500 and towards safe-haven assets like the DXY (currently 99.39). If these tensions escalate further, or if inflation data forces the Fed to signal a hawkish stance, the SP500 could face renewed pressure, potentially breaking below the $6,450 support level.
Track markets in real-time
AI-powered analysis, technical indicators and real-time price data.
Join Our Telegram Channel
Breaking market news, AI analysis and trading signals instantly.
Join Channel