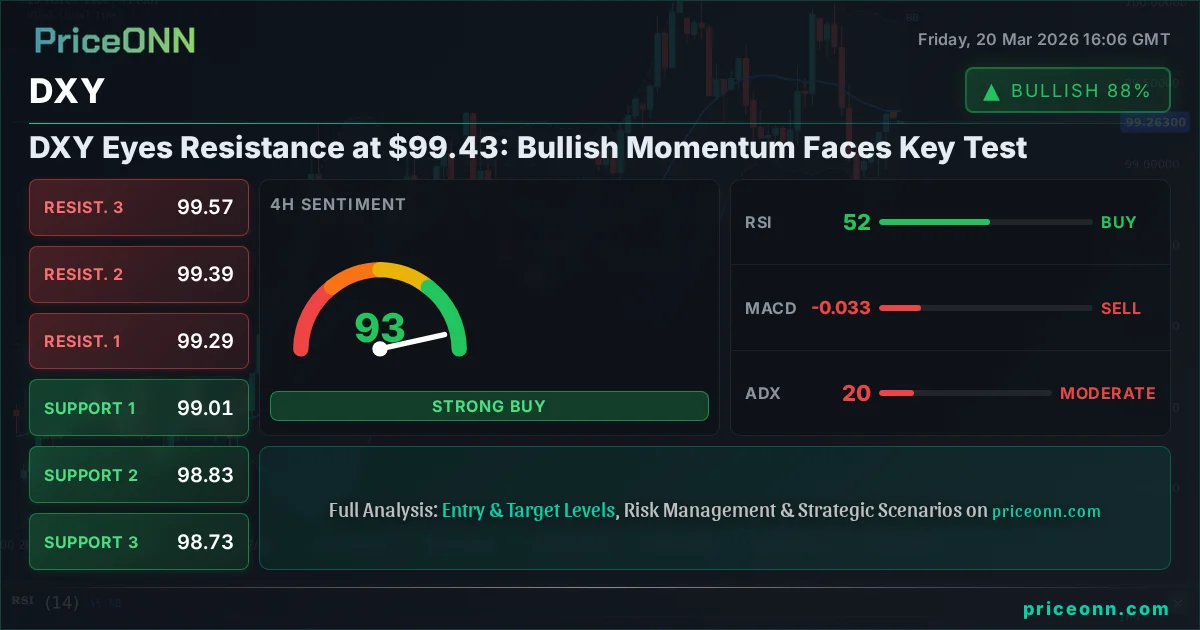
DXY Eyes Resistance at $99.43: Bullish Momentum Faces Key Test
The US Dollar Index (DXY) is testing critical resistance near $99.43. Technical indicators suggest a strong bullish trend, but a key level must break for further upside.
The US Dollar Index (DXY) is currently hovering around the $99.43 mark, presenting a pivotal moment for currency markets. With a strong upward trajectory observed across multiple timeframes, traders are closely watching to see if this bullish momentum can overcome the immediate resistance. This analysis delves into the intricate technical landscape, exploring the confluence of indicators, key support and resistance levels, and the potential scenarios that could unfold for the DXY in the coming sessions. We'll examine how factors like the S&P 500's performance and oil price movements correlate with the dollar's strength, painting a comprehensive picture for informed trading decisions.
- The DXY is currently trading at $99.43, approaching a significant resistance zone.
- On the 1H chart, ADX at 27.38 indicates a strong uptrend, while RSI at 59.38 suggests room for further gains.
- The 4H chart shows a divergence with Stochastic nearing overbought territory, while the 1D chart has ADX at 34.64, confirming a strong trend.
- A daily close above $99.47 is crucial for sustaining the bullish momentum and targeting higher resistance levels.
Navigating the Dollar's Ascent: A Technical Deep Dive
The 1H Chart: Momentum and Caution
On the one-hour timeframe, the DXY exhibits a compelling bullish picture, albeit with nuances that demand attention. The trend is currently neutral with a 50% strength, a testament to the intraday fluctuations, yet the underlying momentum is undeniably positive. The current price of $99.43 is pushing against immediate resistance at $99.47. The RSI(14) stands at 59.38, comfortably within the neutral zone but indicating a leaning towards bullish sentiment and suggesting there's still capacity for upward movement before hitting overbought conditions. More notably, the ADX at 27.38 signals a strong uptrend, reinforcing the bullish narrative on this shorter timeframe. However, the Stochastic oscillator is flashing a warning. With K at 90.96 and D at 65.97, the pair is deep in overbought territory, hinting at a potential for a short-term pullback or consolidation as traders might look to lock in profits. The Bollinger Bands are trading above the middle band, further supporting the bullish bias, but the elevated Stochastic readings suggest caution is warranted for aggressive long entries without confirmation.
The 4H Perspective: Mixed Signals and Trend Strength
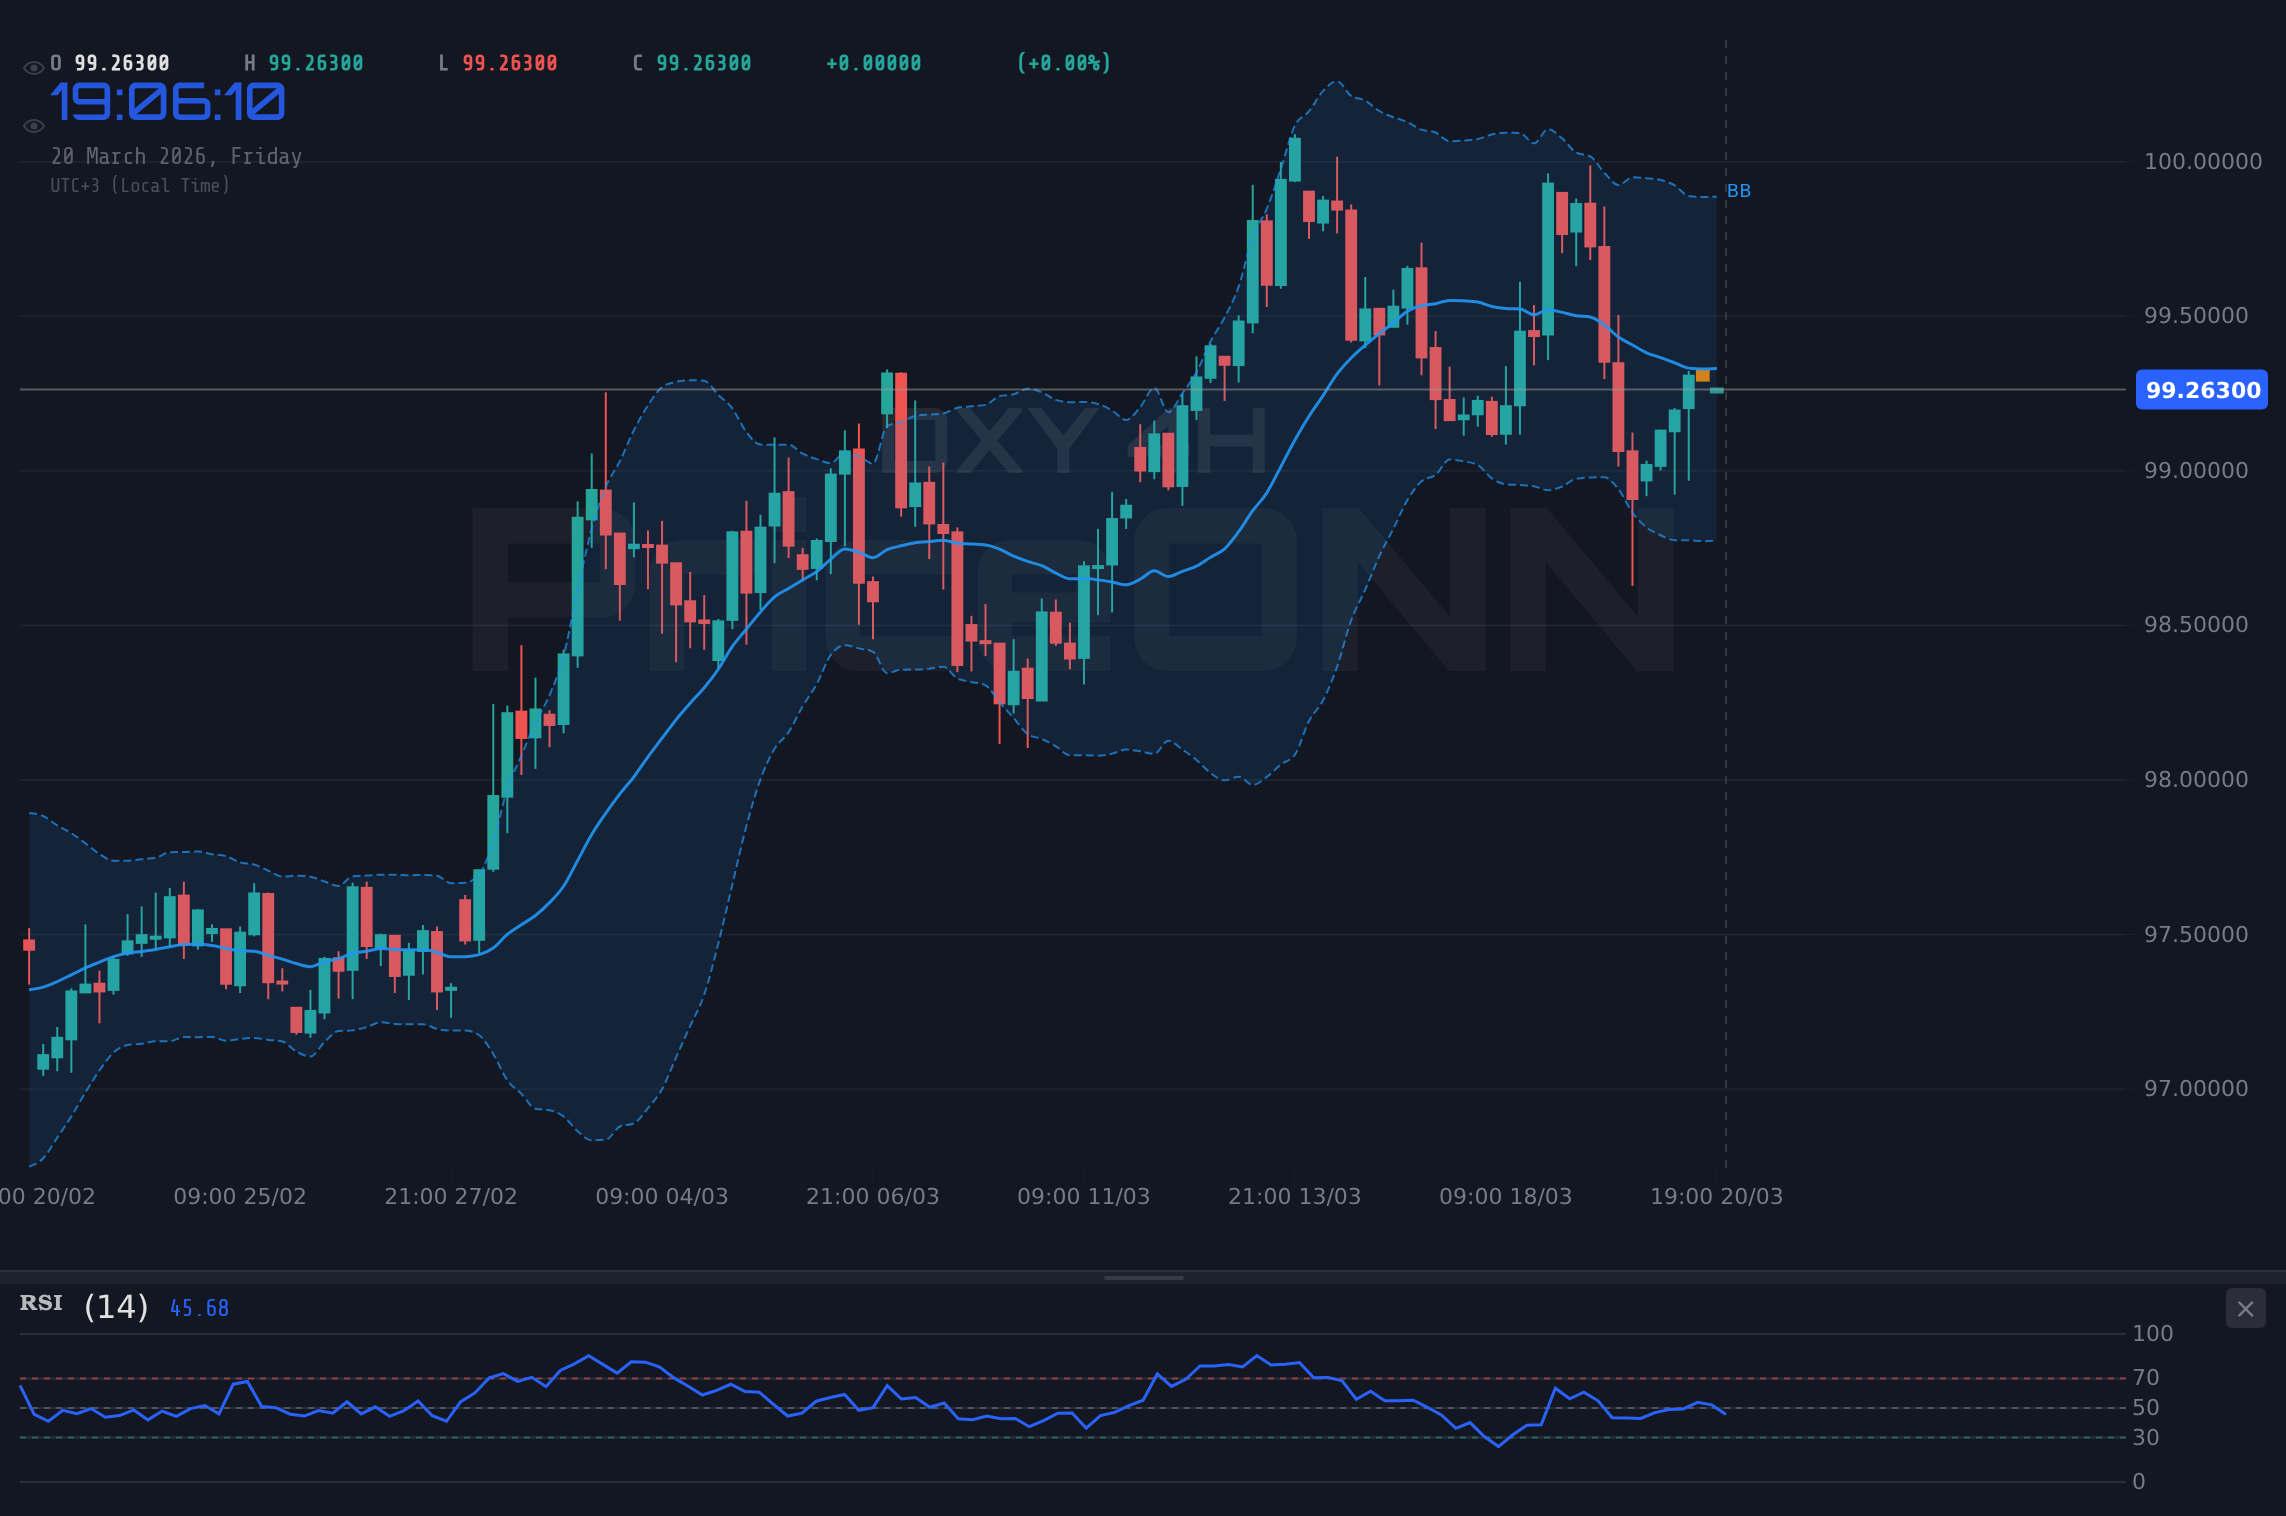
Shifting to the four-hour chart, the DXY's trend is still categorized as neutral (50% strength), but the technical indicators present a more complex scenario. The price action is hovering near the $99.43 level, with key support identified at $99.01, $98.83, and $98.73, while resistance lies at $99.29, $99.39, and $99.57. The RSI(14) is positioned at 52.36, continuing the neutral-to-slightly-bullish sentiment observed on the hourly chart. MACD, however, shows negative momentum with the MACD line below its signal line, a divergence from the hourly's positive momentum. This could indicate that the short-term bullish push might be losing steam. The Bollinger Bands remain above the middle band, supporting an upward trend, but the Stochastic oscillator (K=45.93, D=30.4) shows a bullish signal with %K above %D, though it's not in extreme territory. The ADX at 20.18 indicates a moderately strong trend, a slight step down from the hourly's strength but still significant. This mix of signals suggests that while the overall trend might still be leaning bullish, the immediate path forward could involve some choppiness or a potential retest of lower levels before any significant upside continuation.
The Daily Chart: Established Uptrend and Key Levels
On the daily chart, the DXY's trend is firmly established as bullish, boasting a strength of 92%. This longer-term perspective provides a robust foundation for the current price action around $99.43. The key support levels to watch on a daily basis are $98.36, $97.82, and $97.00, while significant resistance barriers are located at $99.72, $100.54, and $101.08. The RSI(14) is at 58.48, indicating a healthy upward trend without being excessively overbought, leaving ample room for further appreciation. The MACD indicator supports this bullish view, displaying positive momentum with the MACD line firmly above its signal line. The Bollinger Bands are trading above the middle band, a classic sign of an ongoing uptrend. The Stochastic oscillator (K=66.5, D=75.81) is showing a bearish divergence, with %K below %D, and is nearing the overbought threshold. This is the most significant conflicting signal across the timeframes. However, the ADX at 34.64 confirms a strong uptrend, suggesting that despite the Stochastic's overbought reading, the underlying trend strength is substantial. This daily outlook suggests that dips may be opportunities to buy, provided the key support levels hold.
Correlation Analysis: The Dollar's Dance with Global Markets
The DXY and Risk Appetite
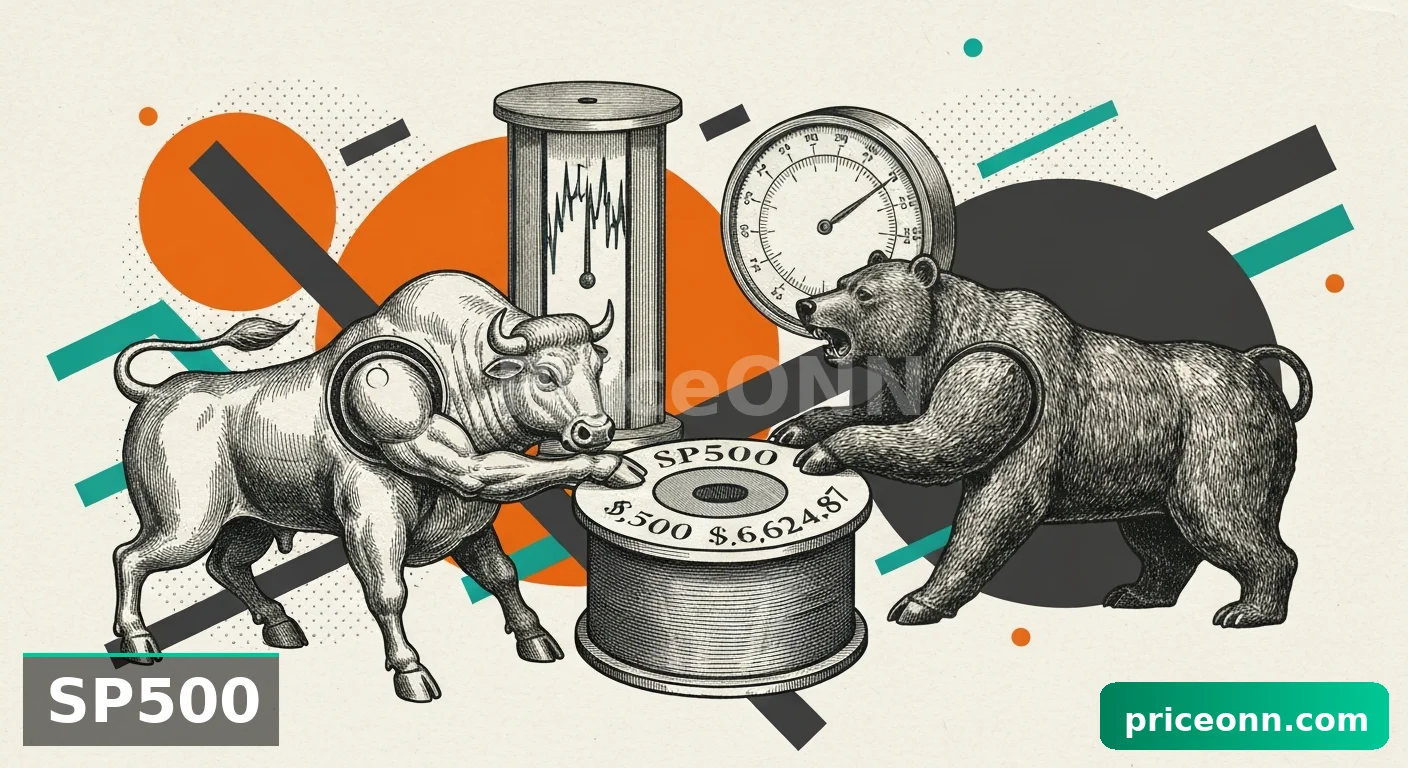
The US Dollar Index (DXY) often moves inversely to global risk appetite, and current market conditions highlight this relationship. The S&P 500 is currently trading at $6559.75, down 0.85% on the day, indicating a risk-off sentiment. This decline in major equity indices like the S&P 500 and Nasdaq, which is down 1.14% at $24115.91, typically fuels demand for the dollar as a safe-haven asset. When risk aversion takes hold, investors tend to move capital out of riskier assets and into perceived safer havens like the USD. The DXY's current strength, approaching resistance at $99.43, aligns with this pattern. The fact that the DXY is showing resilience and even attempting to push higher while equities are declining reinforces its safe-haven status in the current environment. This inverse correlation suggests that any further significant drops in the stock market could provide additional impetus for the DXY to break through its current resistance levels, assuming other factors remain constant.
Oil Prices and Inflationary Pressures
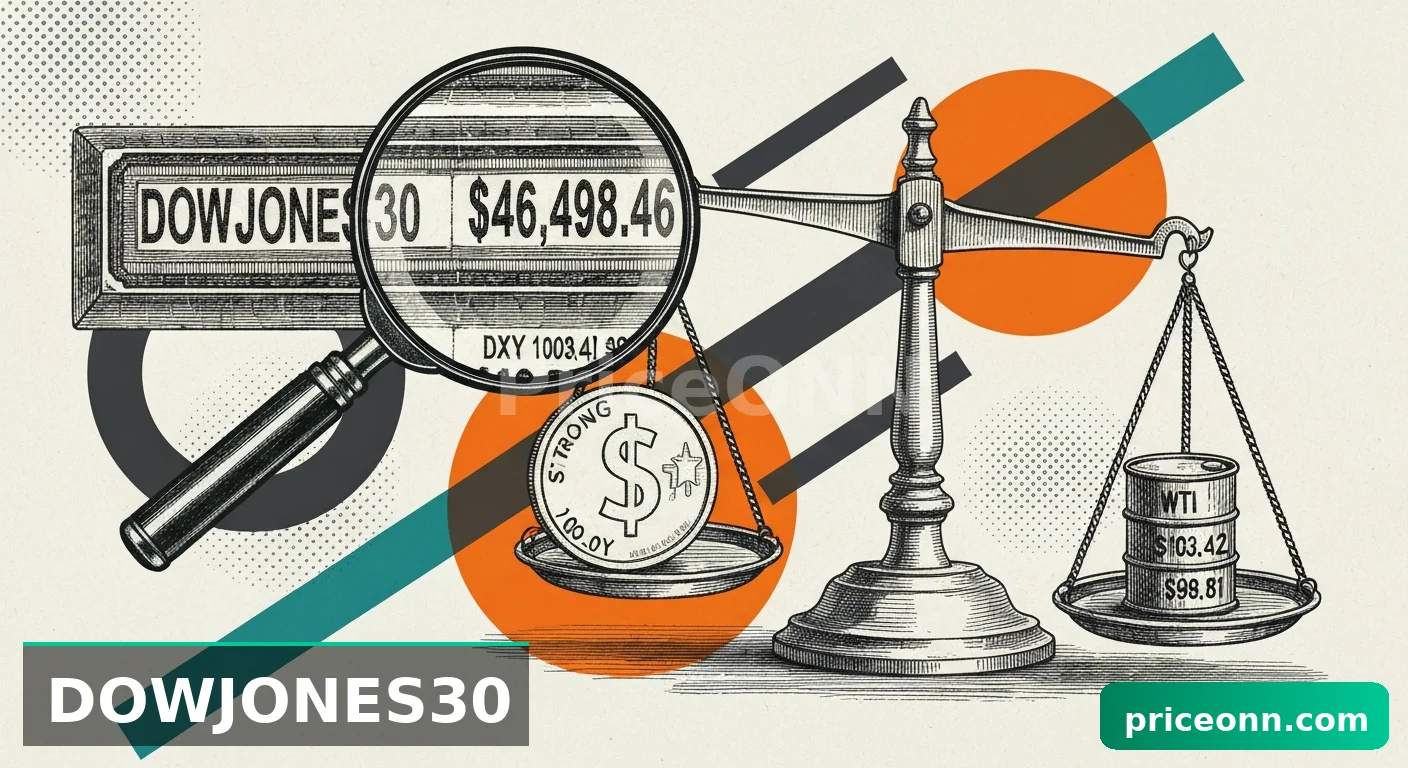
The energy market, particularly Brent crude oil trading at $109.38 and WTI at $96.98, plays a crucial role in the broader economic narrative that influences the DXY. Rising oil prices, as seen today with Brent up 1.64% and WTI up 2.27%, often signal increasing inflation expectations. Higher inflation can prompt central banks, particularly the Federal Reserve, to consider tighter monetary policy, such as raising interest rates. Such a prospect typically strengthens the dollar, as higher interest rates make dollar-denominated assets more attractive to investors seeking yield. The current upward movement in oil prices, despite some geopolitical de-escalation efforts mentioned in recent news regarding falling WTI below $94 amid such efforts, suggests that inflationary pressures might still be a concern. This dynamic could indirectly support the DXY, creating a scenario where rising energy costs contribute to a stronger dollar as markets anticipate a more hawkish stance from the Fed. The news regarding the Strait of Hormuz disruption sparking energy crisis fears further complicates this, potentially adding geopolitical risk premium to oil prices and reinforcing the dollar's safe-haven appeal.
Forex Correlations: EUR/USD and USD/JPY
The DXY's movement has direct implications for major currency pairs. For EUR/USD, currently trading at 1.15497 and showing a bearish trend on the daily chart (94% strength), a stronger DXY typically exerts downward pressure. The daily chart shows a clear downtrend with resistance at 1.16499. The 1H chart for EUR/USD shows a neutral trend with a bearish bias (RSI 47.83), while the 4H chart is more mixed. However, the dominant daily downtrend suggests that if the DXY breaks through its resistance, EUR/USD is likely to face further selling pressure. Conversely, USD/JPY, trading at 159.204 with a strong daily bullish trend (92% strength), is experiencing a significant upward move. The DXY's strength at $99.43 provides a tailwind for USD/JPY, as the pair often moves in tandem with the dollar index. The news of Yen underperforming despite a sharp sell-off on Thursday further supports USD/JPY's rise. The divergence in monetary policy expectations between the US and Japan, with the Fed potentially maintaining a hawkish stance while the Bank of Japan grapples with its own economic conditions, is a fundamental driver underpinning this pair's strength, amplified by a strong DXY.
Trade Scenarios: Charting the DXY's Path Forward
Bearish Scenario: The Dollar Falters at Resistance
25% ProbabilityNeutral Scenario: Consolidation Around Resistance
35% ProbabilityBullish Scenario: Breaking Through to New Highs
40% ProbabilityWhy I'm Watching the $99.47 Level Closely
The current technical setup for the DXY presents a classic battleground scenario around the $99.43 price point. While the daily trend remains robustly bullish with an ADX of 34.64, the immediate hourly and 4-hour charts show conflicting signals that warrant a cautious approach. The Stochastic oscillator on the 1H chart is deep in overbought territory (K=90.96, D=65.97), suggesting a potential for a pullback. Simultaneously, the 4H chart shows a neutral MACD momentum, contrasting with the hourly's positive readings. This divergence highlights the critical nature of the $99.47 resistance level. A decisive breach and sustained close above this level on the daily chart would be a powerful signal, validating the bullish trend and potentially triggering further upside towards $99.72 and beyond. Conversely, a failure to break this resistance, coupled with a close below the $99.30 hourly support, could signal a short-term reversal or at least a deeper consolidation phase. The market sentiment, influenced by equity performance and oil prices, will likely play a significant role in dictating which scenario plays out.
The Role of Economic Data and Fed Expectations
Looking ahead, upcoming economic data releases and evolving Federal Reserve policy expectations will be crucial catalysts for the DXY. While specific calendar events weren't provided in the live data, market participants are constantly digesting signals regarding inflation and employment. Stronger-than-expected inflation or employment figures could bolster the case for a continued hawkish stance from the Fed, potentially leading to higher interest rates. Such a scenario would typically be bullish for the DXY, as higher yields attract capital. Conversely, signs of economic cooling or a shift towards a more dovish tone from Fed officials could weigh on the dollar. The market is highly sensitive to Fed commentary, and any indication of a pivot or pause in monetary tightening could see the DXY retreat from its current levels. Traders should monitor any news related to Fed speeches, interest rate futures (like CME FedWatch), and upcoming key economic reports (such as employment change or inflation data) for clues on the future direction of monetary policy and its impact on the dollar.
What the Indicators Are Telling Us
The confluence of indicators paints a picture of a strong underlying trend facing immediate resistance. On the daily chart, the ADX at 34.64 is a clear signal of a powerful uptrend, suggesting that any pullbacks might be temporary corrections within a larger bullish move. The RSI at 58.48 provides further confirmation of positive momentum without being excessively overbought. However, the Stochastic oscillator on the daily timeframe (K=66.5, D=75.81) is showing a bearish divergence, and on the hourly chart, it is deep in overbought territory. This highlights the potential for a short-term correction or consolidation. The MACD on the hourly chart shows positive momentum, but it's negative on the 4-hour chart, adding another layer of complexity. The key takeaway from the indicators is that while the long-term trend is strongly bullish, the short-to-medium term could see volatility as the DXY battles resistance at $99.47. Confirmation of a break above this level is needed to negate the overbought signals and sustain further upside.
Frequently Asked Questions: DXY Analysis
What happens if DXY breaks above the $99.47 resistance level?
A decisive daily close above $99.47 would invalidate the bearish divergence seen in the Stochastic oscillator and confirm the continuation of the bullish trend. This would likely target the next significant resistance at $99.72, with potential for a move towards $100.54 if momentum sustains.
Should I buy DXY at current levels of $99.43 given the Stochastic is overbought on the 1H chart?
Aggressive buying at current levels carries risk due to the overbought Stochastic on the 1H chart. A more prudent approach would be to wait for confirmation of a break above $99.47, or for a pullback to test support levels like $99.30 or $99.01, where risk-reward might be more favorable.
Is the RSI at 58.48 a sell signal for DXY on the daily chart?
No, an RSI of 58.48 on the daily chart is not a sell signal; it indicates a healthy ongoing uptrend without being excessively overbought. It suggests there is still room for the DXY to appreciate before entering overbought territory.
How will the current risk-off sentiment in equities affect DXY this week?
The current risk-off sentiment, as seen with the S&P 500 down at $6559.75, typically supports the DXY as a safe-haven asset. This could provide the necessary impetus for the DXY to break through its current resistance at $99.43, especially if equity markets continue to decline.
Track markets in real-time
AI-powered analysis, technical indicators and real-time price data.
Join Our Telegram Channel
Breaking market news, AI analysis and trading signals instantly.
Join Channel