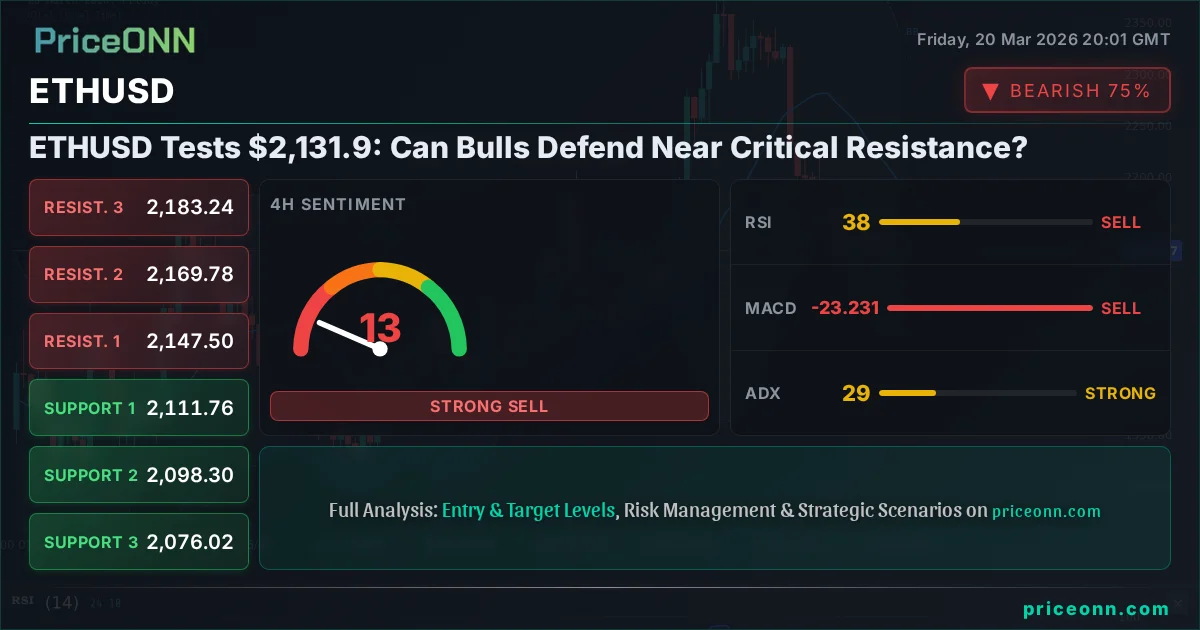
ETHUSD Tests $2,131.9: Can Bulls Defend Near Critical Resistance?
ETHUSD hovers near $2,132.37 amid strong downtrends on multiple timeframes. With RSI at 45.25 and MACD showing negative momentum, the path of least resistance appears downwards, but key levels are being watched.
The crypto market is holding its breath as ETHUSD teeters precariously near $2,132.37. After a sharp sell-off, the question on every trader's mind is whether the bulls can muster a defense, or if this is just a brief pause before further declines. Having tracked ETHUSD through its recent volatility, it's clear that current price action demands close attention, especially with significant resistance looming overhead and a bearish technical picture across shorter timeframes.
- ETHUSD is currently trading at $2,132.37, showing signs of bearish momentum across 1H and 4H charts.
- Critical support for ETHUSD is identified at $2,112.31, while resistance looms at $2,132.74 and $2,144.25.
- The 4H chart shows a strong downtrend with ADX at 29.3, suggesting significant selling pressure.
- While the 1D chart shows a bullish trend, current short-term weakness indicates potential for further downside before any major recovery.
Let's dive into the nitty-gritty. The ETHUSD pair has seen a significant pullback, currently trading at $2,132.37, down 0.7% on the day. This move comes amidst broader market jitters, potentially influenced by the strengthening US Dollar Index (DXY), which is currently at 99.39, and the sharp decline in major US indices like the S&P 500 and Nasdaq. When risk appetite wanes, as it appears to be doing, digital assets often feel the heat. The fact that crude oil prices are surging past $112, a classic inflation hedge, adds another layer of complexity, suggesting that market participants are bracing for persistent inflationary pressures, which could keep interest rates higher for longer and dampen speculative asset demand.
Looking at the immediate 1-hour chart, the trend is decisively bearish with a strength of 77%. The ADX at 14.8, while indicating a weaker trend, is still within a range that suggests caution against aggressive long positions. The RSI(14) is sitting at 45.25, firmly in neutral territory but with a slight downward inclination, indicating that momentum isn't strongly favoring buyers just yet. The MACD is showing positive momentum, which is somewhat contradictory to the overall bearish trend signal, but it's currently below the signal line, suggesting that any upward pressure might be fleeting. The Stochastic Oscillator, with %K at 32.82 and %D at 27.41, is showing a bullish crossover in oversold territory, which could hint at a potential short-term bounce, but this needs to be viewed with extreme caution given the prevailing bearish sentiment.
Navigating the Short-Term Sell-off
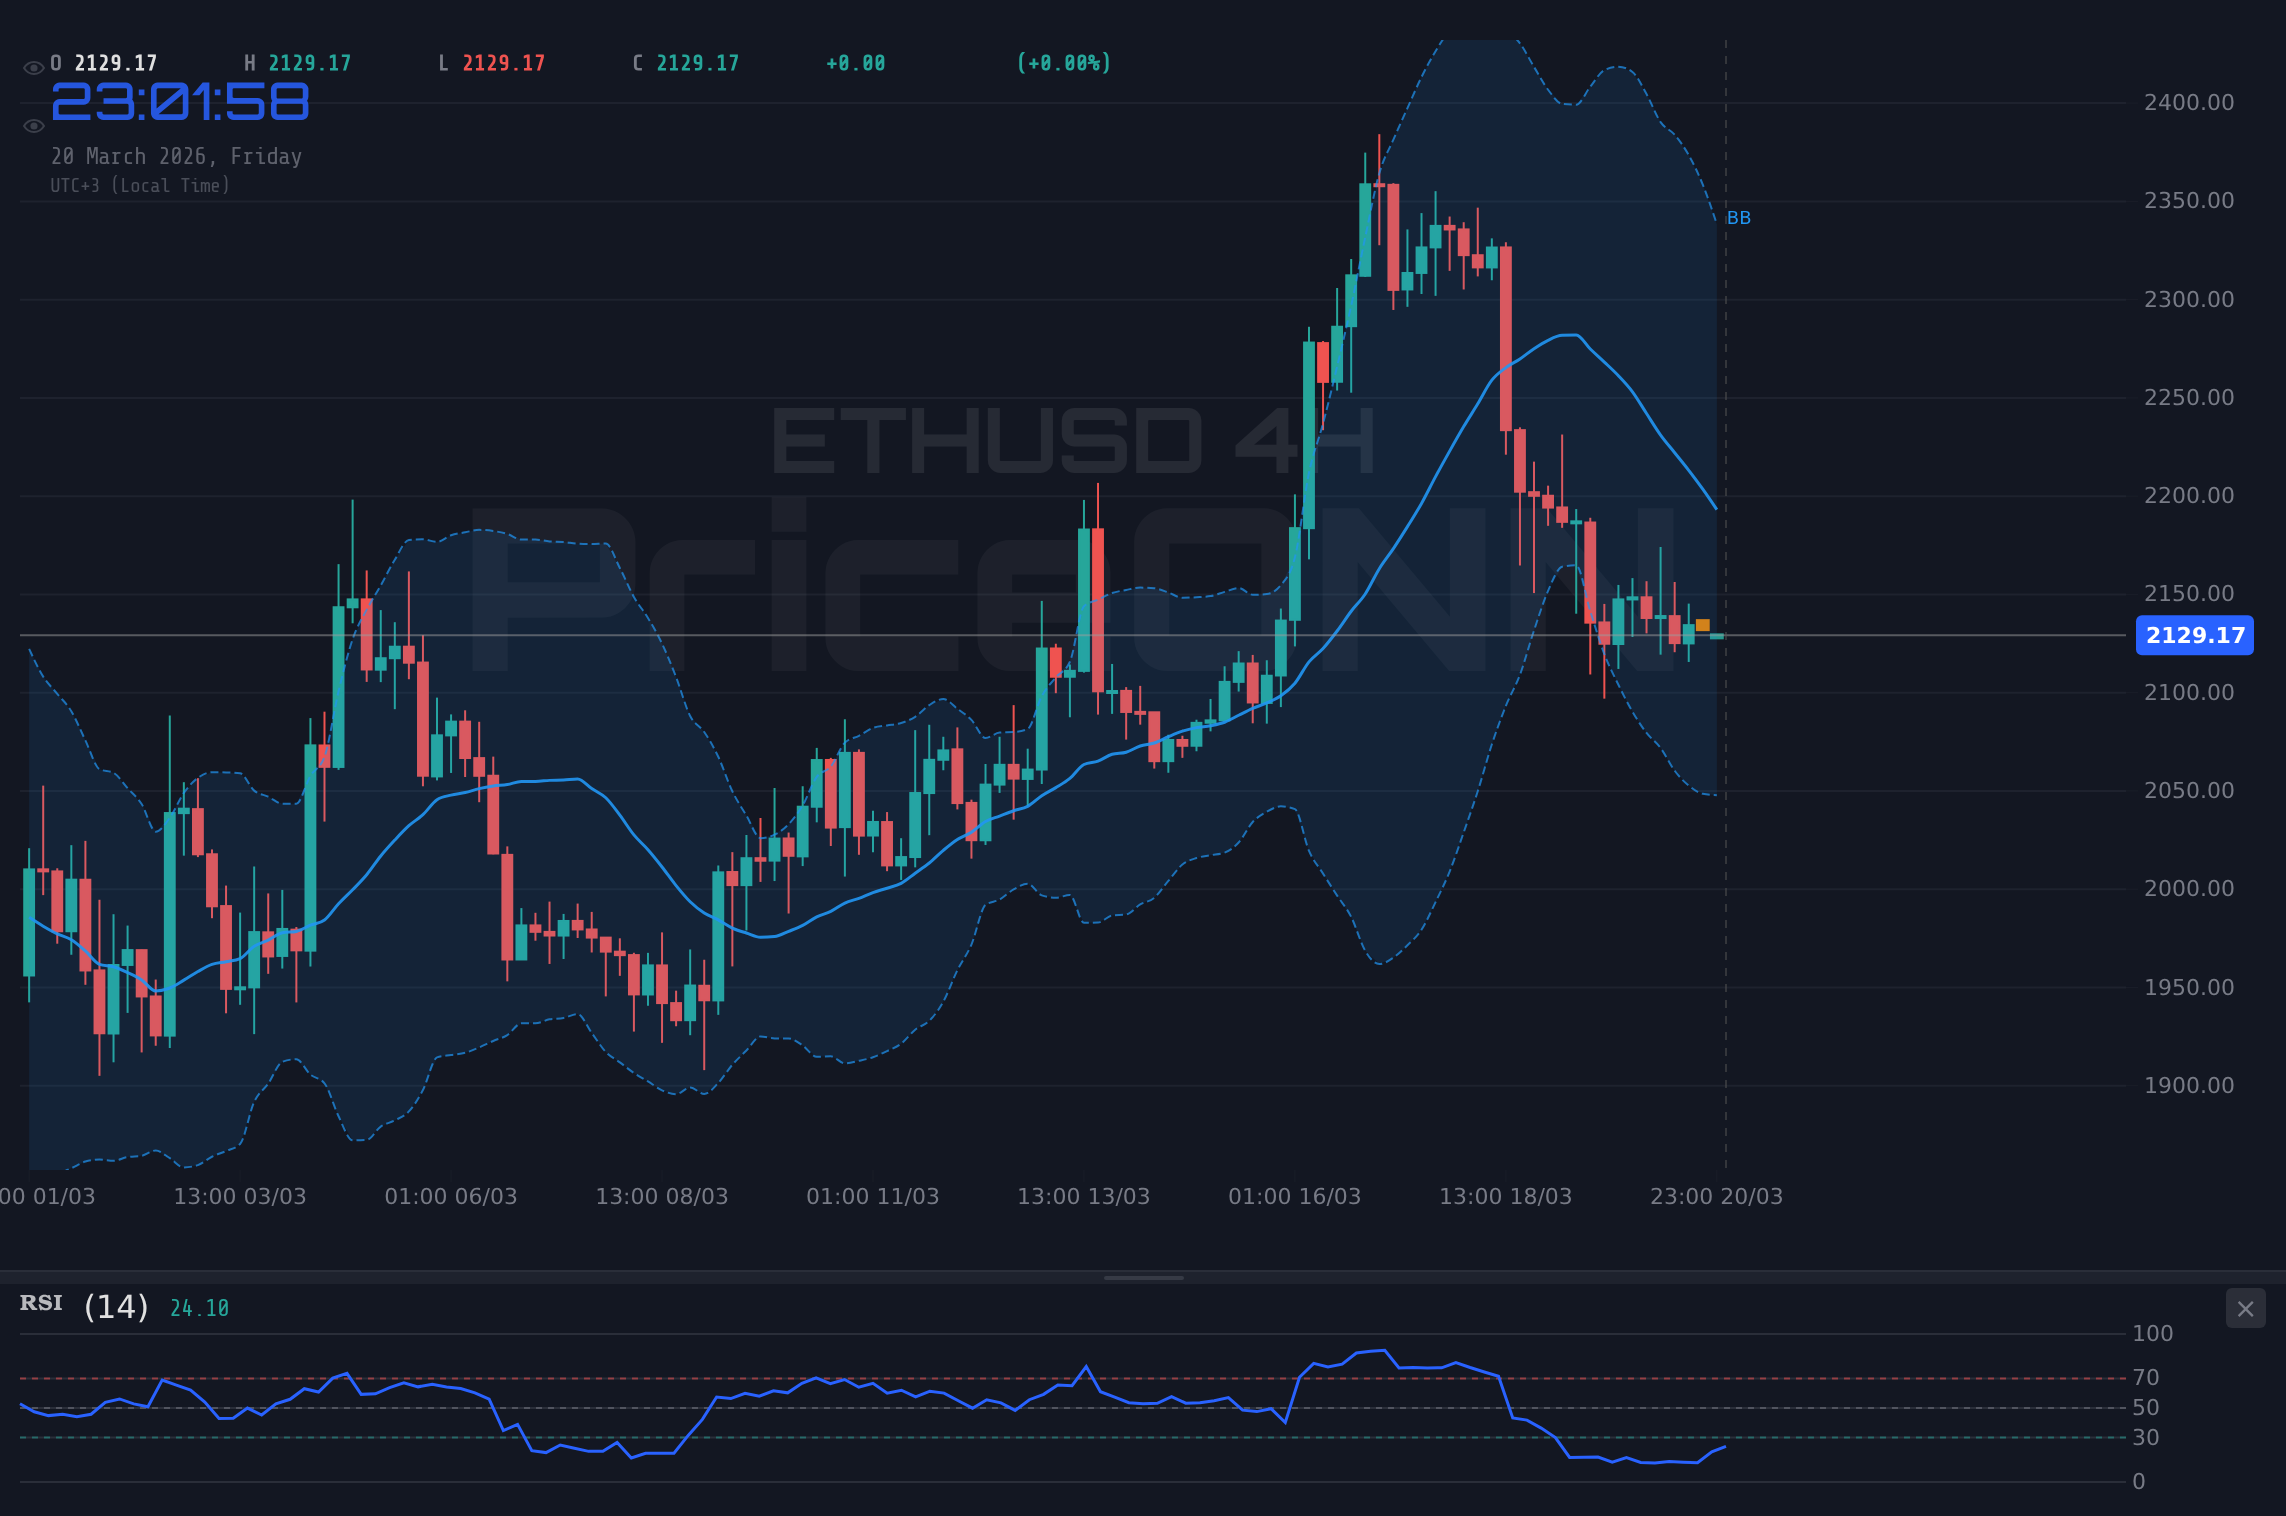
The 4-hour timeframe paints an even clearer picture of the prevailing weakness. Here, the trend is confirmed as bearish with 92% strength. The ADX at 29.3 is significantly higher, signaling a strong downtrend is in play. This is a critical reading for short-term traders. The RSI(14) at 38.42 reinforces the bearish sentiment, indicating room for further downside before reaching oversold conditions. The MACD continues its negative momentum, staying below the signal line, which is a classic bearish sign. Bollinger Bands are showing the price below the middle band, confirming the downward pressure. The Stochastic Oscillator's %K (50.95) is above %D (42.81), suggesting a potential upward movement, but this occurs in a strong bearish trend environment, meaning it could be a brief retracement or a 'death cross' setup.
This short-term technical picture is concerning for ETH bulls. The confluence of bearish signals on the 1H and 4H charts suggests that the immediate pressure is downwards. The primary support level to watch on the 1-hour chart is $2,112.31. A break below this could trigger further selling, potentially targeting the next support at $2,103.39. On the resistance side, the immediate hurdle is at $2,132.74, followed by $2,144.25. The fact that the current price is hovering just below this initial resistance zone is a major point of concern for any potential upside continuation. If ETHUSD fails to decisively break and hold above $2,132.74, the probability of a move lower increases significantly.
The correlation with the broader market cannot be overstated. The S&P 500 tumbling to 6509.65 and the Nasdaq dropping to 23890.3 are stark reminders of the current risk-off sentiment. Historically, such sharp declines in equities often spill over into riskier assets like cryptocurrencies. The DXY's rise to 99.39 further amplifies this pressure, making dollar-denominated assets less attractive. This inverse relationship between the dollar and risk assets is a well-established market dynamic, and its current manifestation suggests that ETHUSD may continue to struggle for upside traction as long as these conditions persist.
The Daily Chart: A Glimmer of Hope or False Signal?
However, not all signals are bearish. When we zoom out to the daily chart, the picture becomes more nuanced. The trend is technically classified as bullish, albeit with a strength of 87%, indicating substantial underlying buying interest despite recent weakness. The RSI(14) is at 50.83, sitting right at the neutral line, which suggests a balance between buyers and sellers. This is a far cry from the oversold conditions seen on shorter timeframes. The MACD is showing positive momentum and is above its signal line, a constructive sign for the longer term. Bollinger Bands are currently above the middle band, which is generally supportive of an uptrend.
The Stochastic Oscillator on the daily chart presents a mixed signal: %K at 40.97 and %D at 68.85 shows a bearish crossover, but these levels are not yet in extreme overbought territory. The ADX at 24.56 indicates a moderate uptrend, which is a positive sign. The daily support levels are quite distant at $2,085.82, $2,024.19, and $2,000. The resistance levels are more relevant in the near term, with the first major hurdle at $2,220.22, followed by $2,292.99 and $2,354.62. This divergence between the short-term bearish technicals and the longer-term bullish structure is what creates the current trading tension.
This divergence highlights a critical trading environment. While the daily chart suggests underlying strength, the immediate price action on the 1H and 4H charts indicates significant selling pressure. This often leads to choppy price action and requires a disciplined approach. For swing traders, waiting for confirmation on the daily chart might be prudent. For shorter-term traders, the key is to respect the bearish signals on the lower timeframes while keeping an eye on the critical support levels. The current price of $2,132.37 finds itself in a precarious position, caught between these conflicting timeframes.
The ETHUSD's current technical setup presents a high degree of short-term risk. While the daily chart shows underlying bullishness, the immediate 1H and 4H bearish signals, coupled with a risk-off global market sentiment, suggest a potential for further downside. Traders should exercise extreme caution and employ strict risk management. The surge in crude oil prices and strengthening DXY are macro headwinds that cannot be ignored.
Scenario Analysis: Where Does ETHUSD Go Next?
Bearish Scenario: The Downside Targets Beckon
65% ProbabilityNeutral Scenario: Consolidation Around Key Levels
25% ProbabilityBullish Scenario: A Rebound Fueled by Daily Strength
10% ProbabilityThe current market environment, characterized by rising oil prices and a hawkish Fed narrative, puts a premium on risk management. While the daily chart offers a more optimistic outlook for ETHUSD, the short-term technical indicators are flashing caution. The ADX reading of 29.3 on the 4H chart is particularly noteworthy, indicating a strong trend is in force, and currently, that trend is downwards. This means that any buying pressure needs to be substantial and sustained to overcome the prevailing bearish momentum.
The lack of strong positive catalysts in the crypto space, coupled with macroeconomic headwinds, makes a significant bullish reversal less probable in the immediate term. The strength of the DXY at 99.39 is a constant drag. Furthermore, the sharp declines in the S&P 500 (down 1.61% to 6509.65) and Nasdaq (down 2.06% to 23890.3) suggest a broader deleveraging event is underway. This sentiment typically weighs heavily on speculative assets like cryptocurrencies. Therefore, the bearish scenario, with a 65% probability, appears to be the most likely outcome in the short term, especially if the critical support level at $2,112.31 gives way.
However, it's crucial to remember the underlying strength indicated by the daily chart. If external factors shift, or if ETHUSD manages to hold the $2,112.31 support and shows signs of stabilization, a move towards the $2,144.25 resistance is possible. The 10% probability assigned to the bullish scenario reflects this possibility, contingent on a clear break of short-term resistance and a shift in market sentiment. The neutral scenario, with a 25% probability, acknowledges the current indecision and the potential for range-bound trading as the market digests conflicting signals.
The Trader's Perspective: What Now for ETHUSD?
From a trader's perspective, the current setup for ETHUSD at $2,132.37 is one that demands patience and precision. Aggressively betting on a bounce here, given the bearish signals on the 1H and 4H charts and the broader risk-off environment, would be ill-advised. The strong ADX readings on shorter timeframes signal that the trend is dominant, and fighting it without clear confirmation is a losing game. The RSI at 45.25 on the 1H chart still has room to fall before hitting oversold territory, reinforcing the idea that further downside is possible.
The most prudent approach right now would be to watch the $2,112.31 support level. A decisive break and close below this level on a 4-hour chart would likely trigger further downside, validating the bearish scenario. Conversely, if ETHUSD can hold above this crucial support and begin to reclaim higher ground, breaking convincingly above the $2,132.74 and $2,144.25 resistance levels, then a more optimistic outlook could be warranted. Confirmation would likely come from a daily close above these levels and a shift in short-term indicators towards bullish momentum.
The influence of macroeconomic factors cannot be ignored. With oil prices continuing to climb and the DXY showing strength, the narrative of 'higher for longer' interest rates from the Fed remains potent. This environment is generally not conducive to speculative assets like cryptocurrencies. Therefore, any bullish case for ETHUSD would likely require a significant shift in either the Fed's stance, a de-escalation of geopolitical tensions, or a clear catalyst within the crypto market itself. Until then, traders should remain vigilant and prioritize capital preservation.
Frequently Asked Questions: ETHUSD Analysis
What happens if ETHUSD breaks below the $2,112.31 support level?
A break below $2,112.31 on the 1-hour chart would likely trigger further selling pressure, validating the bearish scenario. The immediate downside target would be $2,103.39, with a secondary target at $2,091.88, as indicated by our analysis.
Should I buy ETHUSD at current levels around $2,132.37 given the mixed signals?
Buying at current levels around $2,132.37 is not recommended without further confirmation. While the daily chart shows bullish potential, the short-term 1H and 4H bearish signals and risk-off market sentiment suggest caution. A more prudent approach would be to wait for a clear break above $2,144.25 resistance or a confirmed hold of $2,112.31 support.
Is the RSI at 45.25 on the 1H chart a buy signal for ETHUSD?
An RSI of 45.25 is in neutral territory and does not, by itself, constitute a buy signal. While it's not yet oversold, the overall bearish momentum on the 1H and 4H charts suggests that this level doesn't offer strong conviction for a bullish entry. We'd need to see it move into oversold territory (below 30) coupled with other bullish confirmations.
How will the rising DXY and oil prices affect ETHUSD this week?
The rising DXY (currently 99.39) exerts downward pressure on ETHUSD by strengthening the US dollar. Simultaneously, surging oil prices (Brent near $114) can signal inflationary fears, potentially leading to tighter monetary policy expectations from the Fed, which also weighs on risk assets like ETHUSD.
| Indicator | Value | Signal | Interpretation |
|---|---|---|---|
| RSI (14) - 1H | 45.25 | Neutral | Slight downward pressure, room to fall. |
| MACD - 1H | -15.08 | Bearish | Negative momentum, below signal line. |
| Stochastic - 1H | K:32.82, D:27.41 | Bullish Crossover | Oversold zone, potential bounce but needs confirmation. |
| ADX - 4H | 29.3 | Strong Trend | Confirms a strong downward trend. |
| Trend - 4H | Bearish (92%) | Bearish | Dominant trend on this timeframe. |
Track markets in real-time
AI-powered analysis, technical indicators and real-time price data.
Join Our Telegram Channel
Breaking market news, AI analysis and trading signals instantly.
Join Channel