BRENT Crude Oil Surges to $112.79: A Bullish Run Continues Amidst Geopolitical Tensions
BRENT Crude oil is trading at $112.79, extending its bullish run. Technical indicators suggest further upside potential, but geopolitical risks loom.
The oil market is ablaze, and BRENT Crude is leading the charge, soaring to an impressive $112.79. This isn't just a fleeting spike; it's a sustained bullish momentum that has captured the attention of traders and analysts worldwide. As geopolitical tensions simmer and supply concerns remain at the forefront, the question on everyone's mind is: how much further can this rally extend, and what are the critical levels to watch? Having observed the intricate dance between supply, demand, and global instability that dictates crude oil prices for years, I can tell you that the current setup is particularly compelling, yet fraught with the kind of volatility that demands respect and meticulous risk management.
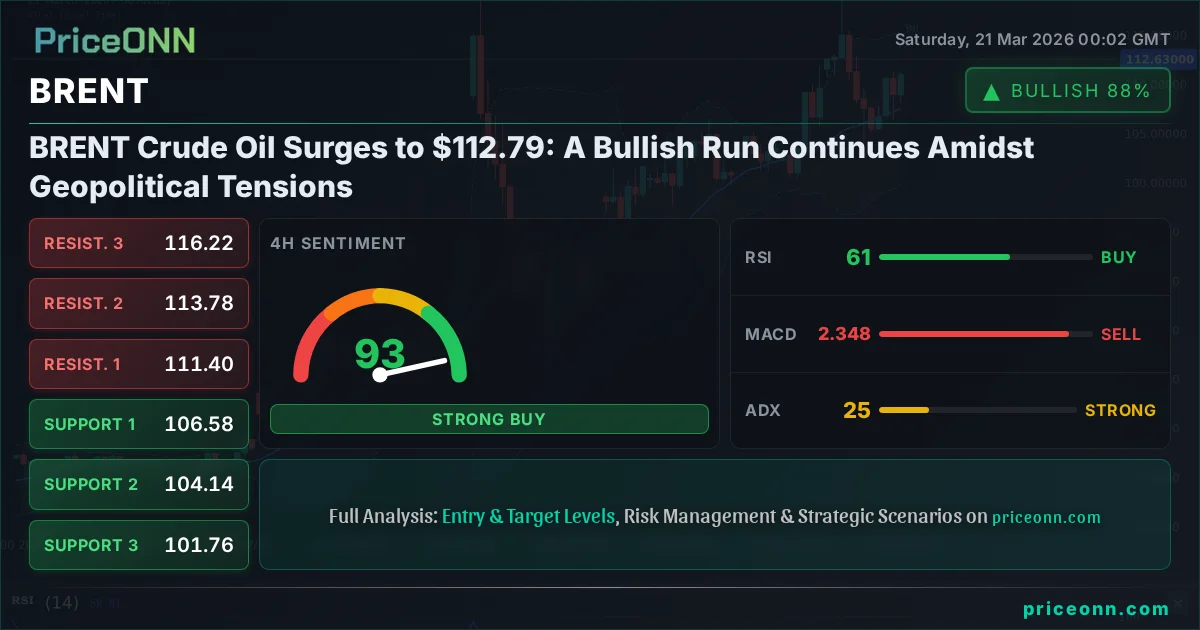
- BRENT Crude oil is trading at $112.79, showing a strong upward trend with 100% strength on the daily timeframe.
- The RSI(14) on the daily chart is at 82.55, indicating a significantly overbought condition that could signal a potential pullback.
- Key resistance is identified at $116.63, with a secondary target at $125.65, while support is holding firmly at $101.24.
- Geopolitical events in the Middle East continue to be a primary driver, impacting supply expectations and contributing to the price surge.
This past week has been a testament to the power of supply-side disruptions and escalating geopolitical risks. The news cycle has been dominated by reports of heightened tensions in the Middle East, which invariably casts a long shadow over global energy markets. We saw Brent Crude jump 4.81% to $112.79, a significant move that underscores the market's sensitivity to any potential threat to oil supply routes. This surge is not happening in a vacuum; it's a direct response to fears that conflicts could disrupt production or transit, particularly from key producing regions. The market's reaction has been swift and decisive, pushing prices into territory not seen in quite some time. The narrative is clear: any perceived risk to supply acts as a powerful catalyst for upward price movement, and currently, those risks are elevated.
Looking at the technical picture, the daily chart for BRENT presents a picture of robust bullish momentum. The trend is classified as strong, with 100% strength, indicating a clear directionality. The price action has been impressive, pushing past previous resistance levels and establishing new highs. The ADX, a measure of trend strength, stands at a very strong 65.23, confirming that the current move is not a mere fluctuation but a powerful trend. Such readings typically suggest that the prevailing direction is well-established and likely to continue, at least in the short to medium term. However, the RSI(14) is currently sitting at a very high 82.55, firmly in overbought territory. This divergence between a strong trend and an overbought oscillator is a classic signal that a correction or consolidation phase could be on the horizon. It's a sign that the market might be getting ahead of itself, and a pause, or even a pullback, is becoming increasingly probable.
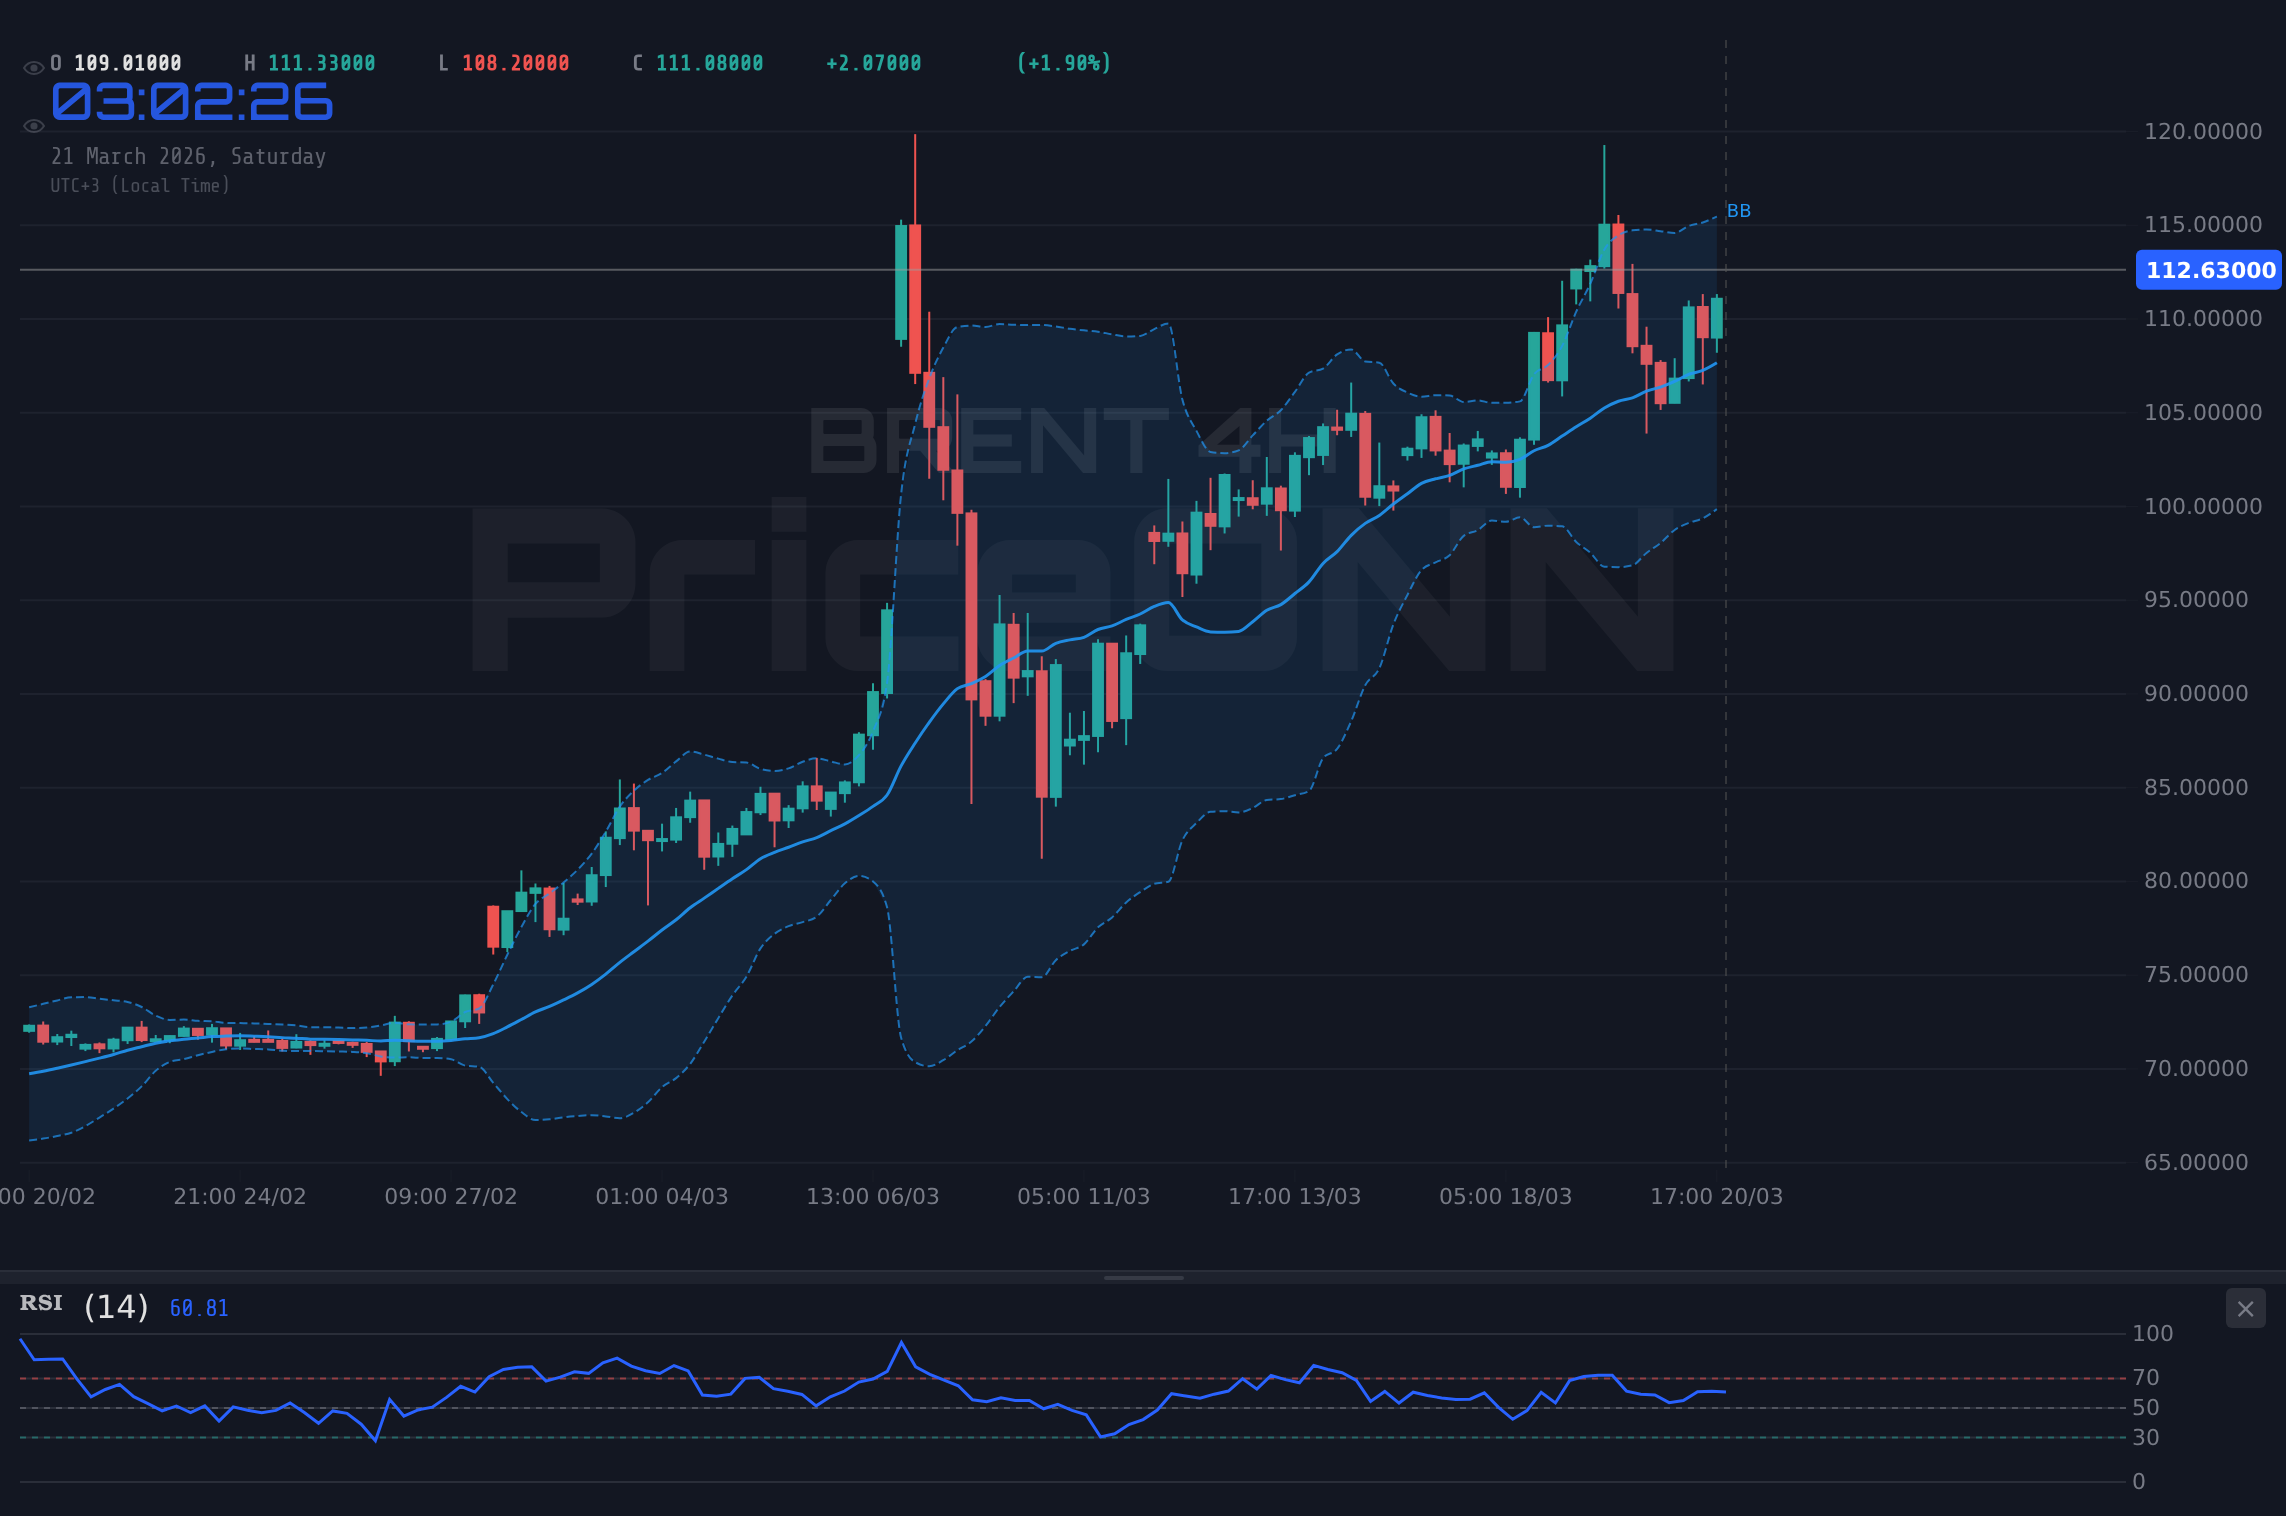
On the 4-hour timeframe, the picture remains largely bullish, though with slightly less conviction than the daily chart. The trend is still classified as neutral but with 50% strength, and the ADX at 25.01 suggests a moderately strong trend is in play. This is a crucial observation because it implies that while the daily trend is overwhelmingly bullish, the shorter-term momentum might be consolidating or preparing for a shift. The Stochastic indicator, with %K at 44.99 and %D at 31.64, shows a bullish signal as %K is above %D, but it's not in extreme territory. This suggests there might still be room for prices to move higher on this timeframe, but the lack of extreme readings also hints that the explosive upward momentum seen on the daily chart might not be fully reflected here. It's a sign that the intraday and intra-week moves could be more measured.
The 1-hour chart offers an even more nuanced view. Here, the trend is neutral with 50% strength, and the ADX at a mere 17.96 indicates a weak trend. This is where we see the market taking a breather. The RSI at 62.15 is in neutral territory, not signaling overbought conditions on this very short timeframe, and the MACD is showing positive momentum. The Stochastic indicator, however, is in the extreme overbought zone (%K: 94.74, %D: 72.65), flashing a warning sign for short-term traders. This confluence of signals - a weak trend, neutral RSI, positive MACD, but an extremely overbought Stochastic - suggests that while the broader upward bias remains, the immediate path higher might be constrained. It highlights the importance of not chasing the market blindly and waiting for clearer signals or pullbacks for entry. The market is essentially telling us that the energy to push significantly higher in the very short term might be waning, even as the larger trend remains intact.
Let's talk about the key levels that are defining this BRENT rally. On the daily chart, the immediate resistance is clearly marked at $116.63. This is the level that traders will be watching closely. A decisive break above this point, especially on increasing volume, could signal the continuation of the bullish trend with further upside targets at $125.65 and potentially $132.02. Conversely, failure to break through $116.63 could lead to a consolidation phase or a pullback. The support side is robust. The first level of support is at $101.24. This level has proven to be a significant floor, and a break below it would likely signal a more substantial correction, potentially targeting the next support at $94.87 and then $85.85. These levels are not arbitrary; they represent areas where significant buying or selling interest has historically emerged, shaping the price action.
The correlation between oil prices, particularly BRENT, and geopolitical events cannot be overstated. The current surge is intrinsically linked to the escalating tensions in the Middle East. News reports indicating potential supply disruptions, such as those concerning Iraq and Kurdistan restarting oil exports (though this specific event might have a moderating effect if it increases supply), or more significantly, any flare-up in conflicts involving major oil producers, immediately impact market sentiment. The market is pricing in a risk premium, anticipating that geopolitical instability could lead to a shortfall in global oil supply. This is compounded by the fact that global oil demand, while perhaps showing signs of softening in some regions due to inflation and higher interest rates, remains fundamentally strong enough to be sensitive to supply shocks. The interplay between these factors creates a volatile but ultimately bullish environment for crude oil prices, as long as the geopolitical risks persist.
Central bank policies also play a crucial, albeit often indirect, role. While BRENT's price is primarily driven by supply-demand fundamentals and geopolitics, the broader macroeconomic environment, shaped by monetary policy, influences overall market liquidity and risk appetite. For instance, if central banks, like the Fed or ECB, signal a more aggressive stance on inflation, it could lead to higher interest rates. Higher rates generally dampen economic growth and, consequently, oil demand. Furthermore, a strengthening US dollar, often a byproduct of tighter monetary policy, can make dollar-denominated commodities like oil more expensive for holders of other currencies, potentially capping price gains. However, in the current environment, the supply-side fears seem to be overpowering these demand-side concerns, suggesting that even aggressive central bank tightening might not immediately derail the bullish trend in oil, although it could moderate the pace of ascent.
The DXY, or Dollar Index, provides another important layer of analysis. A rising DXY typically correlates inversely with commodities priced in dollars, including BRENT Crude. Currently, the DXY is showing mixed signals across timeframes. On the 1-hour chart, it's showing a falling trend, which would theoretically be supportive of BRENT. However, on the 4-hour and daily charts, the DXY is trending upwards, albeit with some conflicting signals from oscillators. If the DXY continues its upward trajectory, particularly on the daily timeframe where it shows a strong upward trend with ADX at 34.64, it could act as a headwind for BRENT, making oil more expensive for international buyers. This inverse correlation is a critical factor to monitor, as a strong dollar can dampen demand and put a ceiling on oil price increases, even amidst supply fears. Traders must watch for confluence or divergence between BRENT's price action and the DXY's movement.
Equities, represented by the S&P 500 and Nasdaq, offer insights into broader risk sentiment. This past week, we've seen a notable downturn in major US equity indices. The S&P 500 tumbled, and the Nasdaq experienced a significant drop. This risk-off sentiment typically favors safe-haven assets like gold and can sometimes pressure riskier assets, including commodities, if it signals a severe economic slowdown. However, in the case of oil, the geopolitical risk premium currently outweighs the risk-off sentiment stemming from equities. While a major stock market crash could eventually spill over and negatively impact oil demand, the immediate focus remains on supply disruptions. The fact that BRENT is rallying strongly despite a falling stock market highlights the dominant influence of supply-side factors and geopolitical risk in the current energy market narrative.
Considering the technical indicators, the picture is somewhat mixed, requiring careful interpretation. On the daily chart, the RSI at 82.55 is a stark warning of an overbought market. This suggests that the recent rally might be due for a correction. The Stochastic indicator is also showing extreme readings, with %K at 74.96 and %D at 61.89, further reinforcing the overbought narrative. However, the MACD is still showing positive momentum, and the ADX at 65.23 indicates a very strong trend. This creates a scenario where the trend is powerfully bullish, but the oscillators are signaling exhaustion. This is a common situation where a market can continue to rally higher even when appearing overbought, but the probability of a sharp pullback or a period of consolidation increases significantly. For traders, this means caution is warranted; chasing the rally here could be risky.
The 4-hour chart adds another layer. While the daily RSI is extremely high, the 4-hour RSI is at 60.64, which is still in bullish territory but not yet overbought. The Stochastic on this timeframe is showing a bullish signal (%K > %D) but is not in extreme territory. The MACD is showing negative momentum here, which contradicts the daily positive momentum. This discrepancy between timeframes is crucial. It suggests that the immediate upward push might be losing steam, even as the broader daily trend remains strong. The ADX at 25.01 confirms a reasonably strong trend, but the conflicting MACD signal indicates that shorter-term traders should be wary of sharp reversals or consolidations.
On the 1-hour chart, the situation is even more nuanced. The RSI is at 62.15, again, not overbought. However, the Stochastic is flashing extreme overbought conditions (%K: 94.74, %D: 72.65). This is a classic short-term warning sign. The MACD shows positive momentum, and the ADX is weak at 17.96, indicating a lack of strong short-term directional conviction. This suggests that while the overall trend is up, intraday trading might become choppy, with potential for sharp, short-lived reversals. It implies that entries on pullbacks, rather than chasing the price higher, might be a more prudent strategy on this timeframe, especially for swing traders looking to capture the next leg up.
The interplay between BRENT and WTI (West Texas Intermediate) is also worth noting. The spread between BRENT and WTI has been widening, with recent news highlighting this divergence. Typically, BRENT trades at a premium to WTI, but the gap has been widening due to specific supply-side factors, including geopolitical risks affecting BRENT's supply routes more directly. For instance, the Middle East tensions are impacting BRENT's supply more significantly than WTI's. This widening spread means that while both benchmarks are rising, BRENT's upward move is being amplified by these specific regional factors. Understanding this spread dynamic is crucial for a comprehensive view of the oil market, as it reflects distinct supply-side pressures affecting different crude grades.
Given the technical signals and the prevailing market sentiment, a cautious approach is warranted for new entries at these elevated levels. The daily chart screams overbought, suggesting that a pullback is not only possible but perhaps likely in the short term. However, the underlying trend strength, driven by geopolitical supply risks, remains formidable. This creates a complex trading environment. For those already long, trailing stop-losses would be advisable to protect profits. For new positions, waiting for a clear pullback to a key support level, such as $101.24 or even closer to $100, might offer a better risk-reward ratio. Chasing the price at $112.79, with the daily RSI at 82.55, presents a high risk of entering near a short-term top.
The recent surge in BRENT Crude oil prices, reaching $112.79, is primarily fueled by escalating geopolitical tensions in the Middle East and the persistent concerns over global oil supply. While the daily technical indicators, particularly the RSI at 82.55, signal an overbought condition, the underlying trend strength (ADX at 65.23) remains exceptionally high. This creates a dichotomy: a powerful trend potentially heading for a short-term correction. Key resistance sits at $116.63, with support holding at $101.24. The widening spread between BRENT and WTI, influenced by regional supply risks, adds another layer to the market's complexity. Investors and traders must navigate this environment with caution, focusing on risk management and waiting for clearer entry signals, possibly on pullbacks to established support levels, rather than chasing the current highs.
Bearish Scenario: Pullback and Consolidation
65% ProbabilityNeutral Scenario: Range-Bound Action
25% ProbabilityBullish Scenario: Trend Continuation
10% ProbabilityFrequently Asked Questions: BRENT Analysis
What happens if BRENT Crude breaks above the $116.63 resistance level?
A sustained break above $116.63, especially with increasing volume, would likely signal a continuation of the bullish trend. This could open the door for price targets at $125.65 and potentially extend towards $132.02 in the medium term, contingent on ongoing supply concerns and geopolitical stability.
Should I buy BRENT at current levels of $112.79 given the overbought RSI?
Buying at $112.79 with the daily RSI at 82.55 presents a high risk, as the market is significantly overbought. While the trend is strong, chasing the price could lead to entering near a short-term peak. A more prudent approach might be to wait for a pullback to key support levels like $101.24 or $94.87 before considering new long positions.
Is the daily RSI at 82.55 a sell signal for BRENT Crude right now?
An RSI reading of 82.55 is a strong indicator of an overbought market on the daily chart, suggesting that the recent rally may be due for a correction or consolidation. While it doesn't automatically signal a sell, it warns against chasing further upside and increases the probability of a price reversal or pullback in the near future.
How will Middle East tensions affect BRENT Crude prices this week?
Escalating tensions in the Middle East are a primary driver for BRENT's bullish momentum, as they heighten fears of supply disruptions. Any news indicating a worsening conflict or a direct impact on oil-producing regions could push prices higher, potentially testing resistance levels like $116.63. Conversely, de-escalation could trigger profit-taking and a price decline.
Track markets in real-time
AI-powered analysis, technical indicators and real-time price data.
Join Our Telegram Channel
Breaking market news, AI analysis and trading signals instantly.
Join Channel