Nasdaq100 Weekly Outlook: Bears Grip at $23,992.13 - What's Next?
Nasdaq100 struggles below $23,992.13. Bears tighten grip as key support levels are tested. What does the technical picture reveal for the week ahead?
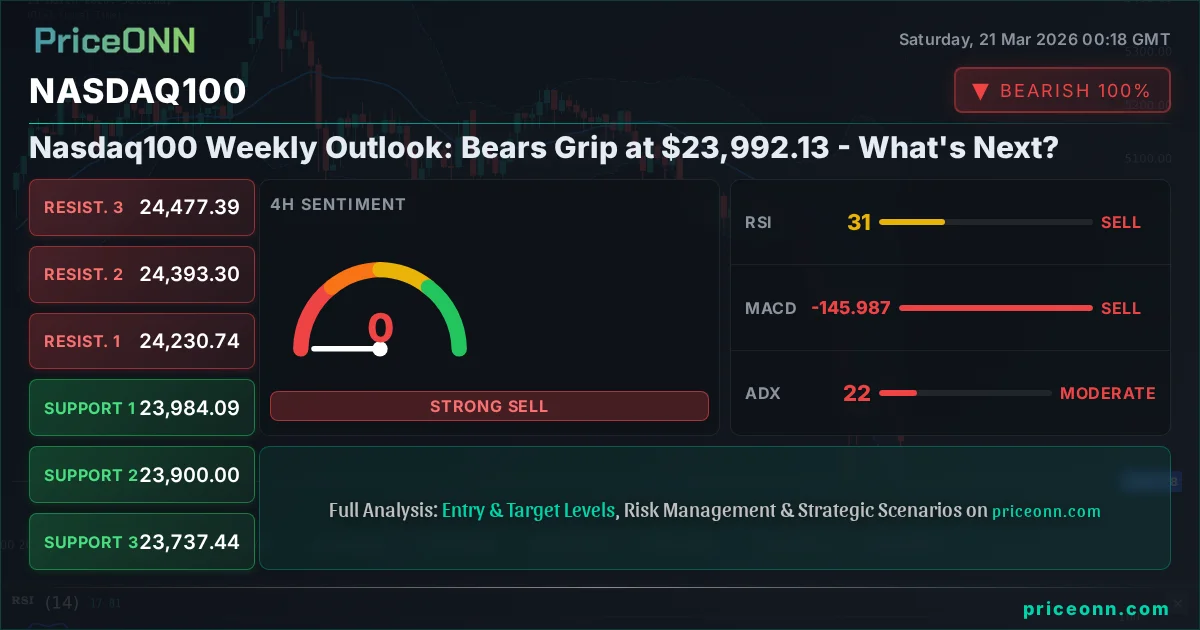
The Nasdaq100 index finds itself at a critical juncture, trading at $23,992.13 as the market grapples with mounting bearish sentiment. Last week saw a significant downturn, with the index closing down 1.65% at $23,992.13, its lowest point in weeks. This sharp decline, part of a broader equity selloff, has put major support levels under intense scrutiny. The bears appear to have gained the upper hand, but the technical indicators offer a mixed picture, suggesting that a clear direction may not be immediately apparent. Understanding the interplay between macroeconomic pressures, technical signals, and key price levels is crucial for navigating the upcoming trading week.
- RSI at 37.26 signals bearish momentum, but not yet in oversold territory on the daily chart.
- Critical support sits at $23,770.36, tested multiple times during the past week's decline.
- MACD histogram shows negative momentum, aligning with the bearish trend but awaiting confirmation for further downside.
- The Nasdaq100's correlation with the rising DXY (currently 99.39) suggests continued pressure from a strengthening dollar.
Navigating the Bearish Tide: Last Week's Action
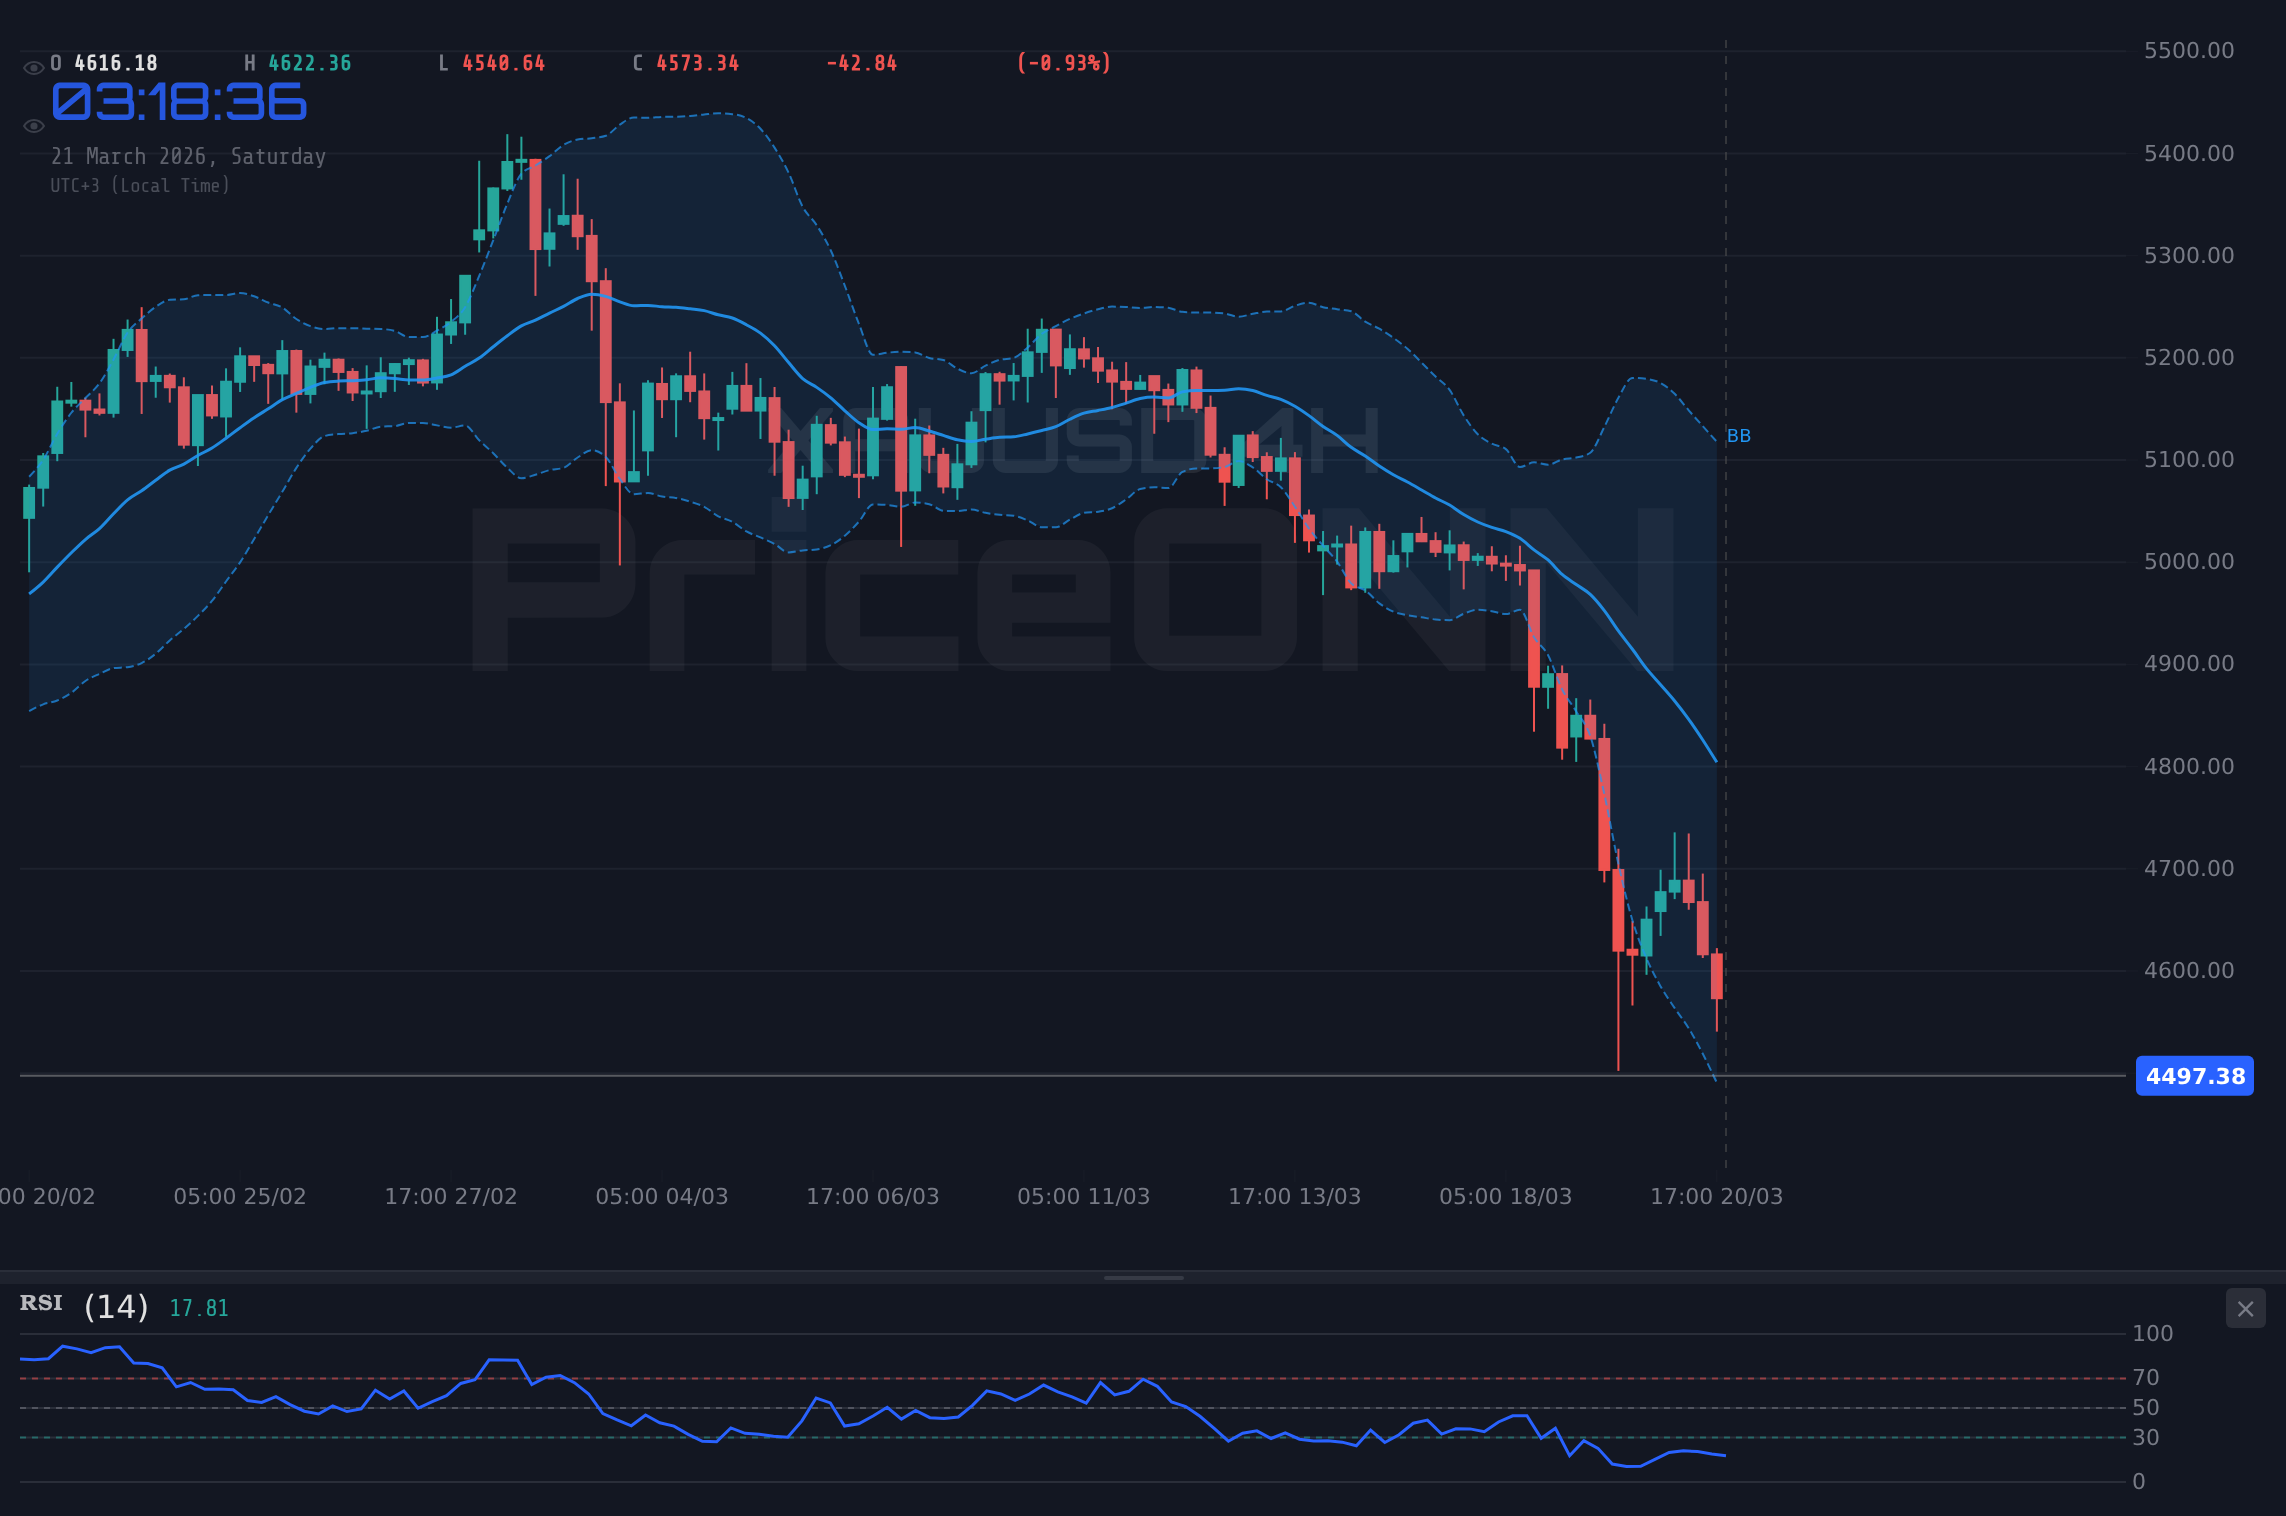
Last week was undeniably challenging for the Nasdaq100. The index shed a significant 1.65%, closing at $23,992.13, and reflecting a broader risk-off sentiment across global markets. This downturn wasn't an isolated event; the S&P 500 also saw a 1.21% decline, ending at $6,536.05, while the Dow Jones Industrial Average fell 0.62% to $45,801. The correlated weakness across major US indices underscores a palpable shift away from risk assets, driven by a confluence of factors including escalating geopolitical tensions and persistent inflation concerns that continue to fuel higher interest rate expectations. The precious metals market also experienced significant volatility, with Gold (XAUUSD) tumbling below $4,500, trading at $4,497.65, as the strengthening dollar and rising yields sapped its appeal as a safe-haven asset. This broad-based deleveraging paints a clear picture of market participants prioritizing capital preservation over aggressive risk-taking.
The strength in the Dollar Index (DXY), which climbed to 99.39, acted as a significant headwind for risk assets. A stronger dollar typically makes US assets more expensive for foreign investors and can signal tighter global liquidity conditions. This was evident in the performance of other forex pairs; EURUSD dipped to 1.15728, GBPUSD fell to 1.33435, AUDUSD to 0.70241, and NZDUSD to 0.5835, all reflecting the dollar's broad-based strength. This macro backdrop creates a challenging environment for growth-oriented assets like the Nasdaq100, which are often sensitive to changes in interest rate expectations and global risk appetite. The ongoing narrative surrounding central bank policies, particularly the Federal Reserve's stance on inflation and future rate hikes, remains a dominant theme influencing market sentiment and asset valuations. Investors are keenly watching for any signals that might suggest a pivot or a prolonged period of higher rates, both of which could further dampen enthusiasm for tech-heavy indices.
Technical Breakdown: What the Charts Are Saying
From a technical standpoint, the Nasdaq100's chart paints a predominantly bearish picture, especially when examining the shorter timeframes. On the 1-hour chart, the trend is clearly defined as bearish with a strength of 99%, indicating strong downward momentum. The RSI(14) at 35.56, while not yet in deeply oversold territory, suggests that sellers are in control and there is room for further downside before any significant buying pressure might emerge. The MACD is firmly below its signal line, reinforcing the negative momentum. Bollinger Bands on this timeframe are trading below the middle band, a classic sign of bearish pressure. Stochastic indicators are also showing weakness, hovering in the oversold region, hinting at potential for a short-term bounce but not a sustained reversal. The ADX at 38.15 further confirms a strong downtrend, suggesting that the current market conditions are conducive to further price declines.
The 4-hour timeframe offers a slightly less severe, but still bearish, outlook. The trend is identified as bearish with 91% strength. The RSI(14) at 31.45 is approaching oversold conditions, indicating that the selling pressure is becoming more intense. MACD remains negative, and the Stochastic indicators are showing a potential for a bounce but are still in a downward trajectory. The ADX at 24.88 suggests a moderately strong downtrend, indicating that the prevailing trend has some conviction behind it. However, it's the daily chart that provides crucial context for the longer-term perspective. Here, the trend is also bearish with 100% strength. The RSI(14) at 32.5 is firmly in the neutral-to-oversold zone, suggesting that while the selling has been intense, a potential buying opportunity might be on the horizon if certain conditions are met. The MACD is negative, and the Stochastic indicators are deeply oversold, pointing towards a potential bottoming process. The ADX at 44.59 signifies a very strong downtrend, indicating that the current market environment is heavily favoring sellers.
Despite the bearish signals across most timeframes, the confluence of indicators on the daily chart presents a nuanced picture. The extreme readings on Stochastic and the RSI hovering near oversold territory on the daily chart suggest that the market might be nearing a point of exhaustion for the current bearish move. However, the persistent strength of the downtrend indicated by the ADX (44.59) cannot be ignored. This suggests that any potential bounce might be a short-lived counter-trend move rather than a full-fledged reversal, at least until key resistance levels are decisively broken. The price action itself, closing below $23,992.13 and approaching critical support at $23,770.36, reinforces the bearish narrative in the short to medium term. The key question remains whether the current oversold conditions will lead to a meaningful bounce or if the strong downtrend will simply resume after a brief pause.
The Crucial Levels: Support and Resistance
The Nasdaq100's price action over the past week has brought key support and resistance levels into sharp focus. The immediate support level to watch is at $23,770.36. This level has been tested multiple times and represents a significant psychological and technical barrier. A decisive break below this point would likely trigger further sell-offs, potentially targeting the next support at $23,675.46 on the 1-hour chart, and further down to $23,675.46 as indicated by the 1-hour timeframe's lowest support. On the daily chart, the support structure is more pronounced, with the $23,675.46 level being a critical floor. A failure to hold this zone could open the door for a significant decline towards $23,450.90 (a derived level based on the 1H chart's structure and the 4H chart's context) and subsequently to $23,263.67 (a combination of 1D support and the 4H chart's lower bounds). The overall structure on the daily chart suggests that $23,770.36 is the most immediate level of concern for bulls.
On the resistance side, the 1-hour chart shows immediate resistance at $23,972.48, followed by $24,065.02 and $24,120.99. These levels represent the immediate hurdles that any potential bounce would need to overcome. The 4-hour chart presents resistance at $24,230.74 and $24,393.30. These are more significant barriers that would need to be breached to suggest a shift in momentum. However, the most critical resistance level, particularly from a daily perspective and considering the overall bearish trend, lies much higher. The daily chart resistance points are at $24,561.68, $24,729.70, and ultimately $24,957.34. For the bearish narrative to be invalidated, the index would need to convincingly break and hold above these higher resistance zones. Until then, any rallies are likely to be met with selling pressure, especially as the index approaches these key overhead levels.
The Macroeconomic Crosscurrents
The Nasdaq100's recent performance cannot be divorced from the broader macroeconomic landscape. The persistent strength of the US Dollar Index (DXY) at 99.39 is a significant headwind. As the dollar strengthens, it tends to put downward pressure on global risk assets, including equities, as well as commodities like gold. This is partly due to the increased cost for non-dollar holders to acquire US assets and the implication of potentially tighter global financial conditions. The recent tumble in Gold (XAUUSD) to $4,497.65, despite geopolitical tensions, highlights this dynamic. Investors seem to be favoring the perceived safety and yield of the dollar over traditional safe havens like gold, especially when accompanied by rising interest rate expectations.
Speaking of interest rates, the market is keenly focused on the Federal Reserve's next moves. While recent data has been mixed, the underlying inflation narrative remains a concern for policymakers. The Fed's commitment to price stability, even at the risk of slowing economic growth, continues to underpin a 'higher for longer' interest rate environment. This is reflected in the pricing of Fed Funds Futures, which suggest a persistent hawkish bias from the central bank. Such an environment is inherently challenging for growth stocks, which form the backbone of the Nasdaq100. Higher interest rates increase the discount rate applied to future earnings, thereby reducing the present value of these companies. Furthermore, the competition for capital intensifies as fixed-income instruments offer more attractive yields, potentially diverting investment away from equities.
Geopolitical risks also continue to cast a long shadow. Escalating tensions in the Middle East and ongoing global conflicts contribute to market uncertainty and can trigger flights to safety, often benefiting the US dollar and Treasury bonds at the expense of equities. While these events can sometimes create short-term volatility that might present trading opportunities, the overarching impact tends to be a dampening of risk appetite. This reduction in risk tolerance makes investors more hesitant to allocate capital to growth-oriented sectors and indices like the Nasdaq100. The interconnectedness of these factors – a strong dollar, high interest rate expectations, and geopolitical instability – creates a complex and challenging environment for equity markets. It underscores the need for a disciplined approach, focusing on risk management and a clear understanding of the levels that dictate potential market direction.
Scenario Analysis: Charting Potential Paths Forward
Bearish Scenario: The Bears Tighten Their Grip
65% ProbabilityNeutral Scenario: Consolidation Around Key Levels
25% ProbabilityBullish Scenario: A Potential Rebound?
10% ProbabilityThe current technical setup heavily favors the bearish scenario, given the sustained downtrend and the prevailing macroeconomic headwinds. The probability assigned reflects the strong bearish signals across multiple timeframes, particularly the ADX readings and the RSI's position relative to oversold territory on shorter timeframes, which suggest further downside potential before a meaningful correction. The neutral scenario accounts for the possibility of a temporary pause or consolidation as the market digests recent price action and awaits fresh catalysts. However, the bullish scenario, while having a lower probability, cannot be entirely dismissed. A significant shift in market sentiment, perhaps driven by unexpected dovish signals from the Fed or a de-escalation of geopolitical tensions, could trigger a sharp reversal. For now, the path of least resistance appears to be to the downside, making the bearish scenario the most likely outcome in the immediate short term. Traders should remain vigilant for the specific triggers and invalidation levels that define each of these potential paths.
What to Watch This Week: Key Triggers and Catalysts
Looking ahead, several factors will be critical in dictating the Nasdaq100's direction. Firstly, the price action around the key support level of $23,770.36 will be paramount. A failure to hold this level could quickly accelerate the bearish scenario, potentially leading to a test of the $23,675.46 and $23,450.90 zones. Conversely, any sustained bounce would need to overcome immediate resistance at $23,972.48 and, more importantly, the 4-hour resistance at $24,230.74. A decisive break above this latter level would start to question the dominant bearish narrative.
Secondly, macroeconomic data releases and central bank commentary will be closely monitored. Any signals from Federal Reserve officials regarding inflation and future monetary policy could significantly impact market sentiment. While no major high-impact data is scheduled for the Nasdaq100 itself, broader economic releases affecting the US dollar and interest rate expectations will have a direct correlation. For instance, any unexpected inflation data or hawkish commentary could reinforce the dollar's strength and put further pressure on the index. Conversely, signs of cooling inflation or dovish hints could provide a much-needed reprieve.
Thirdly, the performance of other major indices and correlated assets will provide valuable context. The continued weakness in the S&P 500 and Dow Jones, along with the downward pressure on Gold (XAUUSD) despite geopolitical risks, reinforces the prevailing risk-off environment. A sustained downtrend in these correlated assets would likely confirm the bearish outlook for the Nasdaq100. Conversely, any signs of stabilization or reversal in these broader markets could suggest that the current selloff is nearing exhaustion, potentially paving the way for a tactical bounce in the tech index. The interplay between these technical levels, macroeconomic drivers, and broader market sentiment will be key to navigating the Nasdaq100's path in the coming week.
| Indicator | Value | Signal | Interpretation |
|---|---|---|---|
| RSI (14) | 37.26 | Bearish | Suggests bearish momentum, but not deeply oversold on daily. |
| MACD Histogram | -1.65 | Bearish | Negative momentum confirms downtrend. |
| Stochastic %K | 28.13 | Bearish | Oversold on daily, potential for bounce, but trend is key. |
| ADX | 44.59 | Strong Trend | Indicates a very strong downtrend currently in play. |
| Bollinger Bands | Lower Band | Bearish | Price below middle band suggests bearish pressure. |
Frequently Asked Questions: Nasdaq100 Analysis
What happens if Nasdaq100 breaks below the critical support at $23,770.36?
A close below $23,770.36 on the daily chart would likely accelerate the bearish trend, invalidating the neutral scenario and increasing the probability of the bearish scenario. This could lead to a rapid test of the next support level at $23,675.46, and potentially further down towards $23,450.90.
Should I consider buying Nasdaq100 around current levels of $23,992.13 given the oversold RSI on the daily chart?
While the daily RSI at 32.5 is approaching oversold territory, the strong bearish ADX of 44.59 suggests the downtrend remains dominant. A contrarian buy here would be highly risky without confirmation. A more prudent approach would be to wait for a confirmed break of resistance or a clear bullish divergence pattern to form.
Is the RSI at 37.26 a sell signal for Nasdaq100 right now?
An RSI of 37.26 on the 1-hour chart indicates bearish momentum but is not yet considered a strong 'sell' signal in isolation. It suggests that sellers are in control, but the market isn't deeply oversold. Confirmation from MACD and price action breaking below key intraday support levels would be needed to validate a short entry.
How will the Federal Reserve's stance on interest rates affect Nasdaq100 this week?
Any hints of a hawkish stance from the Fed, suggesting prolonged higher rates to combat inflation, would likely continue to pressure the Nasdaq100. This is because higher rates diminish the present value of future tech earnings. Conversely, any dovish signals could provide a temporary boost, but the overall trend suggests skepticism towards sustained rate cuts in the near term.
The path forward for the Nasdaq100 remains clouded by uncertainty, with bearish technical signals and challenging macroeconomic conditions dominating the outlook. The index is teetering on critical support levels, and any breakdown could signal a deeper correction. However, markets are dynamic, and opportunities often arise from volatility. Vigilance around the key levels identified, coupled with a disciplined risk management strategy, will be essential for traders and investors navigating this complex landscape. The coming week's price action will be crucial in determining whether the bears solidify their grip or if a potential technical rebound can take hold.
Track markets in real-time
AI-powered analysis, technical indicators and real-time price data.
Join Our Telegram Channel
Breaking market news, AI analysis and trading signals instantly.
Join Channel