DowJones30 Weekly: $45,801.00 Under Pressure, Flat Outlook
The Dow Jones Industrial Average closed below $45,801.00 last week, facing a flat outlook amid mixed signals. Key levels to watch.
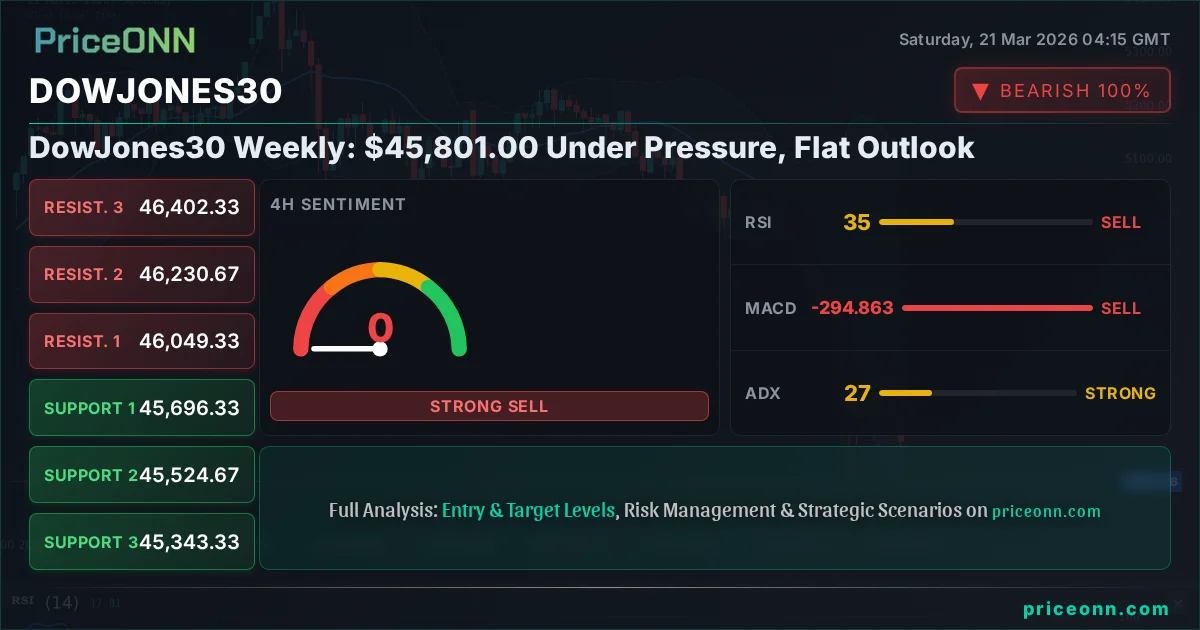
The Dow Jones Industrial Average (DJIA) concluded its trading week ending March 21, 2026, on a decidedly bearish note, closing at $45,801.00. This marked its fourth consecutive losing week, a somber streak that underscores a prevailing bearish sentiment and a flat, uncertain outlook heading into the next trading period. While the index experienced significant volatility, the overarching trend points towards consolidation rather than a clear directional move, leaving traders and investors on edge. The current price of $45,801.00 sits precariously, with key technical indicators flashing mixed signals and macroeconomic headwinds continuing to shape market sentiment. This analysis delves into the technicals, the fundamental drivers, and potential scenarios that will likely dictate the Dow's trajectory in the coming days and weeks.
- The DowJones30 closed at $45,801.00 last Friday, marking its fourth consecutive weekly loss.
- RSI at 27.02 on the daily chart signals extreme oversold conditions, potentially offering a short-term buying opportunity.
- Key support for the DowJones30 is identified at $45,771.67, with a break below potentially targeting $45,458.33.
- Resistance is firming around $46,351.67, a level that must be reclaimed for any bullish reversal to gain traction.
- Geopolitical tensions and hawkish Fed expectations are correlated with the broader equity selloff, impacting the DowJones30.
The past week was a challenging one for the Dow Jones Industrial Average. Following a period of persistent selling pressure, the index shed 284 points, or 0.62%, to settle at $45,801.00. This decline wasn't an isolated event; it was part of a broader market downturn that saw the S&P 500 fall 1.21% and the Nasdaq Composite plunge 1.65%. This correlated weakness across major US indices highlights a general risk-off sentiment gripping the markets. Several factors contributed to this downturn, including escalating geopolitical tensions in the Gulf region, which typically fuels demand for safe-haven assets and puts pressure on riskier equities, and the continued hawkish rhetoric from Federal Reserve officials, suggesting that interest rates may remain elevated for longer than anticipated. The market is grappling with the dual threat of geopolitical instability and a potentially restrictive monetary policy, creating a difficult environment for stock market bulls. The Dow's inability to hold onto gains, coupled with its fourth consecutive weekly decline, paints a picture of a market searching for a bottom, but finding little concrete support.
From a technical standpoint, the DowJones30's daily chart presents a stark picture. The Relative Strength Index (RSI) hovers at 27.02, firmly entrenched in oversold territory. Historically, such readings have often preceded temporary bounces or short-covering rallies. However, it's crucial to remember that oversold conditions can persist in strong downtrends. The Moving Average Convergence Divergence (MACD) histogram remains negative, indicating bearish momentum, and is positioned below its signal line, reinforcing the downward pressure. The Stochastic Oscillator is also deeply oversold, with %K at 10.33 and %D at 16.33, suggesting that the selling may be exhausted in the short term. The Average Directional Index (ADX) at 41.79 points to a strong downtrend, implying that the current price action is not merely a correction but a well-established bearish move. The Bollinger Bands are also showing the price action below the middle band, further confirming the bearish bias on the daily timeframe. This confluence of indicators suggests that while a short-term relief rally is possible, the underlying trend remains decidedly bearish, and any upward moves could be met with renewed selling pressure.
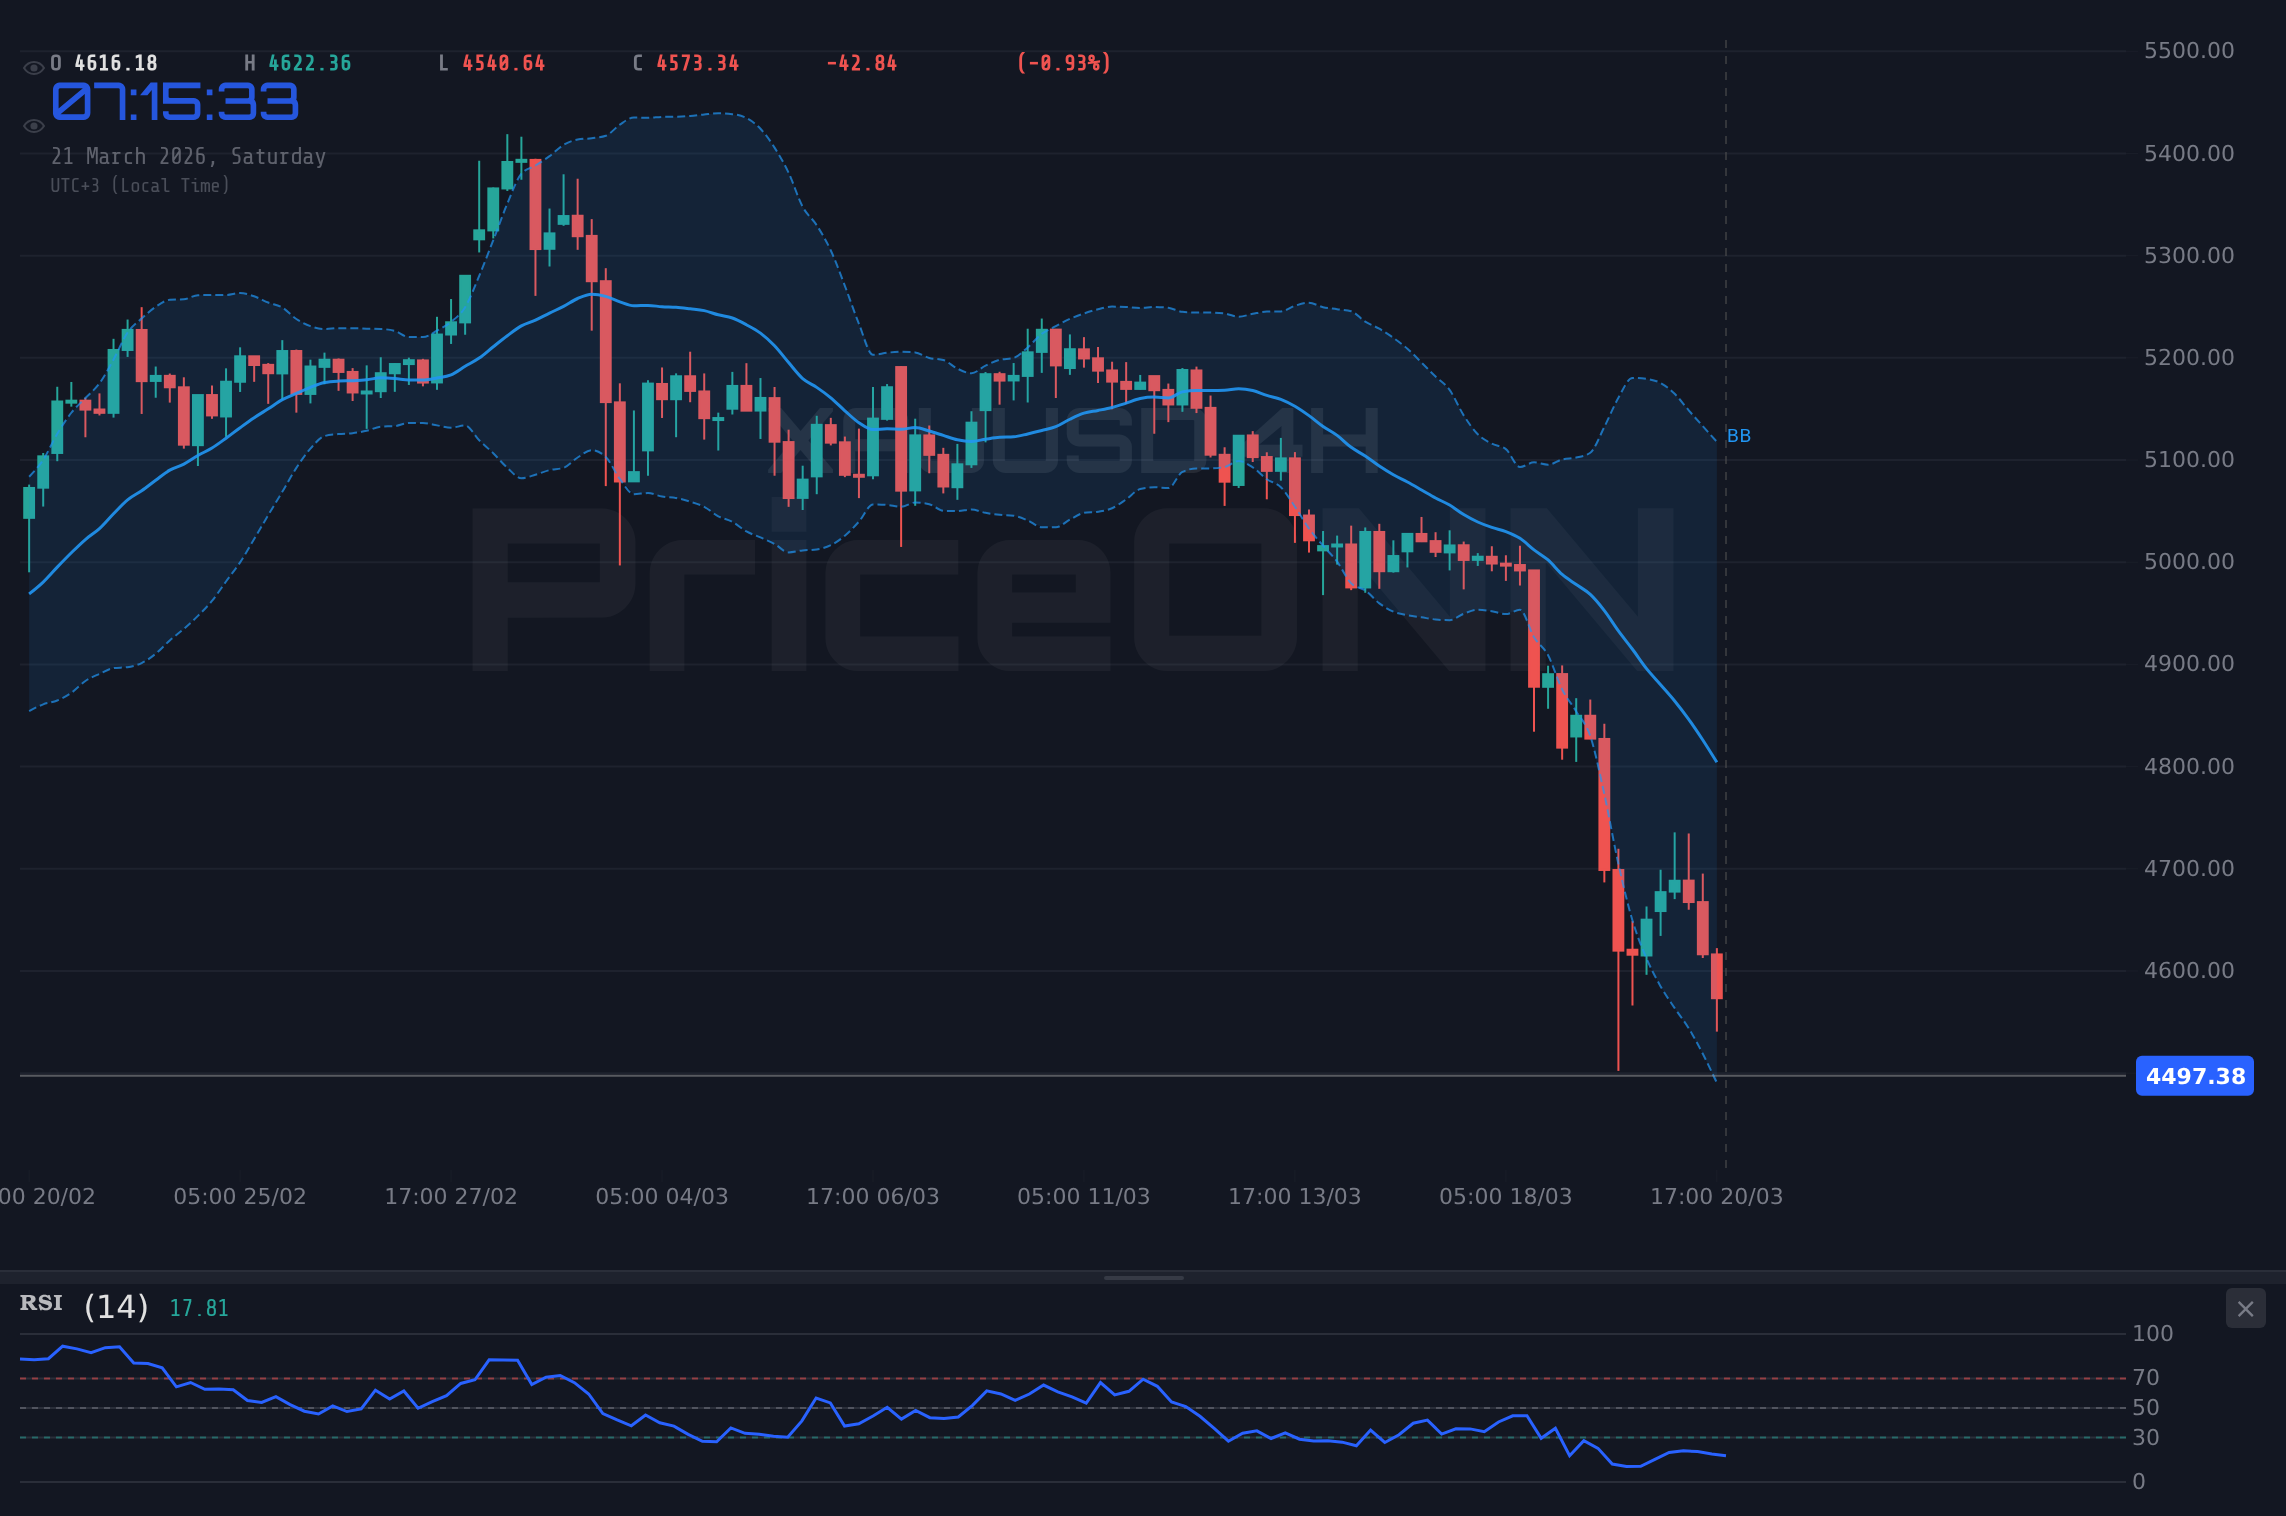
The 1-hour and 4-hour charts offer a slightly different, albeit still cautious, perspective. On the 1-hour chart, the trend is technically neutral with a 50% strength, suggesting a potential pause in the immediate selling. The RSI is at 44.09, indicating a neutral stance with a slight bearish lean. The MACD is negative, and the Stochastic Oscillator is showing a potential bullish signal with %K (30.97) above %D (25.19), but the ADX at 32.46 still points to a strong downtrend. On the 4-hour chart, the trend is clearly bearish with 94% strength. The RSI is at 35.25, still in neutral territory but leaning bearish. The MACD is negative, and the Stochastic Oscillator (%K at 24.03, %D at 27.81) is showing a bearish signal. The ADX at 27.11 confirms a strong downtrend. This multi-timeframe analysis reveals a battle between short-term oversold conditions potentially leading to a bounce and the dominant, strong bearish trend on the longer timeframes. The market is currently in a state of flux, with the potential for a short-term technical rebound overshadowed by the prevailing bearish sentiment.
The Bull's Roadmap: Reclaiming Key Levels
For the bulls to regain control, a decisive break and hold above critical resistance levels are paramount. The immediate resistance stands at $46,351.67, a level that acted as a pivot point earlier in the week. A sustained move above this threshold, ideally with increasing volume, would be the first sign of capitulation from the bears. Following this, the next significant hurdle lies at $46,618.33. If the price can decisively clear this level, it would signal a potential shift in momentum, possibly triggering short-covering rallies. The ultimate objective for the bulls in the short to medium term would be to reclaim the $47,000 psychological level and challenge the higher resistance at $49,310.00. Such a move would require a significant change in market sentiment, possibly driven by a dovish surprise from the Federal Reserve or a de-escalation of geopolitical tensions. The confluence of technical indicators would need to turn bullish, with RSI moving decisively above 50, MACD crossing bullishly, and ADX showing a weakening downtrend. Without these conditions, any rally is likely to be viewed with skepticism and could be a trap for unwary buyers.
Where Bears Take Control: Testing Deeper Support
The bearish scenario remains the dominant narrative, given the recent price action and the prevailing market conditions. The immediate support level to watch is $45,771.67. A close below this level on the daily chart would confirm the breakdown and likely trigger further selling pressure, targeting the next support at $45,458.33. If this level also gives way, the bears could push the price down to the significant support at $45,191.67. A break below this point would signal a more substantial trend continuation and could open the door for a much deeper correction, potentially towards the $44,000 region, although that remains a longer-term target. The technical indicators currently support this bearish outlook. The strong ADX reading of 41.79 on the daily chart indicates a robust downtrend, and the negative MACD further reinforces the bearish momentum. Geopolitical risks, such as escalating conflicts in the Middle East, and persistent inflation concerns that keep the Federal Reserve on a hawkish path, would further fuel this downside scenario. Should these factors intensify, the probability of the DowJones30 testing lower support levels would significantly increase.
The Waiting Game: Consolidation Amidst Uncertainty
While the dominant trend appears bearish, a period of consolidation or a neutral range-bound market cannot be entirely ruled out, especially given the oversold conditions on shorter timeframes and the prevailing uncertainty. This scenario would typically play out if key support levels hold, and resistance levels prove too strong for immediate breaches. In such a case, the DowJones30 could oscillate between the identified support at $45,771.67 and resistance at $46,351.67. This range-bound action would likely be characterized by lower trading volumes and a lack of conviction from either the bulls or the bears. Traders might engage in short-term scalping within this range, buying near support and selling near resistance. However, this scenario is inherently unstable; a range-bound market often precedes a significant breakout in either direction. The eventual resolution would depend on external catalysts, such as crucial economic data releases or geopolitical developments. Until then, the market might remain 'stuck in the mud,' offering limited opportunities for significant directional trades. This 'waiting game' could persist until a clear catalyst emerges to break the stalemate.
Market Sentiment Analysis: DXY Strength and Equity Weakness
The current market environment is characterized by a strengthening US Dollar Index (DXY) and a weakening equity market, a correlation that has significant implications for the Dow Jones Industrial Average. The DXY is currently trading at 99.39, showing a clear upward trend on the daily chart. This strength in the dollar is often attributed to a combination of factors, including safe-haven flows during times of geopolitical uncertainty and the prospect of higher-than-anticipated interest rates from the Federal Reserve. As the DXY strengthens, it typically puts downward pressure on dollar-denominated assets, including US equities. For the Dow Jones30, this means that a rising dollar can act as a headwind, making US exports more expensive and potentially dampening corporate earnings. The inverse relationship between the DXY and the stock market is a critical factor to monitor. The recent news highlighting escalating Gulf tensions and hawkish Fed commentary directly supports the dollar's strength and, consequently, contributes to the pressure on indices like the Dow Jones30. This dynamic suggests that until the DXY shows signs of reversal or the fundamental drivers behind its strength (geopolitics, Fed policy) change, the headwinds for the Dow are likely to persist.
The Federal Reserve's Tightening Grip
The Federal Reserve's monetary policy continues to be a dominant force shaping market sentiment and, by extension, the Dow Jones Industrial Average's performance. Recent statements from Fed officials have reinforced a hawkish stance, emphasizing the persistence of inflation and the need to maintain a restrictive policy until inflation is firmly on a downward trajectory towards the 2% target. This has led to a repricing of interest rate expectations, with many market participants now anticipating fewer rate cuts, or even the possibility of a rate hike, in the near future. The CME FedWatch Tool, if available, would likely reflect this shift in probabilities. This hawkish outlook has several implications for the stock market. Higher interest rates increase borrowing costs for corporations, potentially impacting earnings and valuations. They also make fixed-income investments more attractive relative to equities, drawing capital away from the stock market. Furthermore, a strong dollar, often a byproduct of hawkish Fed policy, can negatively affect multinational corporations within the Dow Jones, as their overseas earnings translate into fewer dollars. The market's sensitivity to every utterance from Fed officials underscores the central bank's significant influence on asset prices.
Geopolitical Tensions: A Constant Undercurrent
The ongoing geopolitical landscape remains a significant source of uncertainty and volatility for global markets, including the Dow Jones Industrial Average. Escalating tensions in regions like the Middle East, coupled with existing conflicts, create a backdrop of risk aversion. Such geopolitical flare-ups often lead to increased demand for safe-haven assets like gold and the US dollar, while simultaneously dampening investor appetite for riskier assets such as equities. The recent news regarding renewed attacks in the Gulf and the broader implications for global energy supply chains serves as a stark reminder of these risks. Higher oil prices, a direct consequence of such tensions, can contribute to inflationary pressures, further complicating the Federal Reserve's policy decisions and potentially leading to a more prolonged period of higher interest rates. This complex interplay between geopolitics, energy prices, inflation, and monetary policy creates a challenging environment for forecasting market direction. Investors must remain vigilant, as unexpected geopolitical events can quickly shift market sentiment and trigger significant price movements across all asset classes.
Correlation Analysis: DowJones30, DXY, and Equities
Understanding the correlation between the Dow Jones Industrial Average, the US Dollar Index (DXY), and broader equity markets is crucial for navigating the current trading landscape. As observed, the DXY is currently trading at 99.39 and exhibiting a strong daily uptrend. This strength in the dollar typically exerts downward pressure on US equities, including the Dow Jones30. When the dollar strengthens, it makes American goods more expensive for foreign buyers, potentially hurting the earnings of multinational corporations that are heavily represented in the Dow. Conversely, a weaker dollar often correlates with stronger equity markets. The S&P 500, currently at 6,536.05, and the Nasdaq Composite, at 23,992.13, are both experiencing significant downturns, mirroring the broader risk-off sentiment. This correlation suggests that a sustained rise in the DXY could continue to weigh on the Dow Jones30. Traders closely watch this inverse relationship; a reversal in the DXY's trend, perhaps driven by a shift in Fed policy expectations or a de-escalation of geopolitical risks, could be a precursor to a potential recovery in the Dow Jones. However, until such shifts occur, the strong dollar environment remains a significant headwind.
What to Watch This Week: Key Triggers
Looking ahead, several key events and technical levels will be critical in determining the Dow Jones Industrial Average's path. Firstly, the $45,771.67 support level is paramount. A decisive break below this on significant volume would invalidate any short-term bullish hopes and likely accelerate the downtrend. Conversely, reclaiming the $46,351.67 resistance is the primary bullish trigger. A sustained move above this level could signal a short-covering rally, but conviction will be needed. Secondly, market participants will be closely monitoring any new developments on the geopolitical front. A de-escalation of tensions could provide a much-needed boost to risk appetite, while further escalation would likely reinforce the bearish trend. Thirdly, commentary from Federal Reserve officials will remain in focus. Any hints of a pivot from their hawkish stance could provide a significant tailwind for equities, while continued hawkishness would likely maintain the pressure. Finally, key economic data releases, particularly those related to inflation and employment, will be crucial in shaping Fed policy expectations and, consequently, market direction. Traders should pay close attention to the interplay between these technical levels, geopolitical news, and monetary policy signals.
Bearish Scenario: Downside Acceleration
65% ProbabilityNeutral Scenario: Range-Bound Consolidation
25% ProbabilityBullish Scenario: Relief Rally Potential
10% Probability| Indicator | Value | Signal | Interpretation |
|---|---|---|---|
| RSI (14) | 27.02 | Bearish | Extreme oversold on daily, potential for bounce |
| MACD Histogram | -16.33 | Bearish | Negative momentum persists |
| Stochastic (%K/%D) | 10.33/16.33 | Bearish | Oversold, but trend remains down |
| ADX | 41.79 | Bearish | Strong downtrend confirmed |
| Bollinger Bands | Below Middle Band | Bearish | Price action below midline indicates weakness |
Frequently Asked Questions: DowJones30 Analysis
What happens if DowJones30 breaks below $45,771.67 support this week?
A daily close below $45,771.67 would confirm the bearish trend and likely trigger further downside, targeting $45,458.33. This level has acted as a crucial pivot, and its failure would signal a significant acceleration of selling pressure, potentially leading to tests of $45,191.67.
Should I consider buying DowJones30 at current levels around $45,801.00 given the oversold RSI?
While the RSI at 27.02 suggests oversold conditions, the strong daily ADX of 41.79 indicates a powerful downtrend. A contrarian buy here is high-risk; it's prudent to wait for confirmation, such as a close above $46,351.67, or a clear bullish divergence on shorter timeframes before committing capital.
Is the MACD histogram at -16.33 a strong sell signal for DowJones30?
The negative MACD histogram at -16.33 confirms persistent bearish momentum on the daily chart. While not a standalone buy signal, it reinforces the dominant downtrend. Traders should look for bullish MACD crossovers or divergence on shorter timeframes as potential early warnings of a trend change, but the current reading favors caution.
How will the ongoing geopolitical tensions and Fed policy impact DowJones30 next week?
Escalating geopolitical risks and hawkish Fed rhetoric are currently feeding a risk-off sentiment, pressuring the Dow Jones30. If these factors intensify, expect continued downside towards $45,191.67. Conversely, any de-escalation or dovish signals from the Fed could trigger a relief rally, testing resistance near $46,351.67.
Track markets in real-time
AI-powered analysis, technical indicators and real-time price data.
Join Our Telegram Channel
Breaking market news, AI analysis and trading signals instantly.
Join Channel