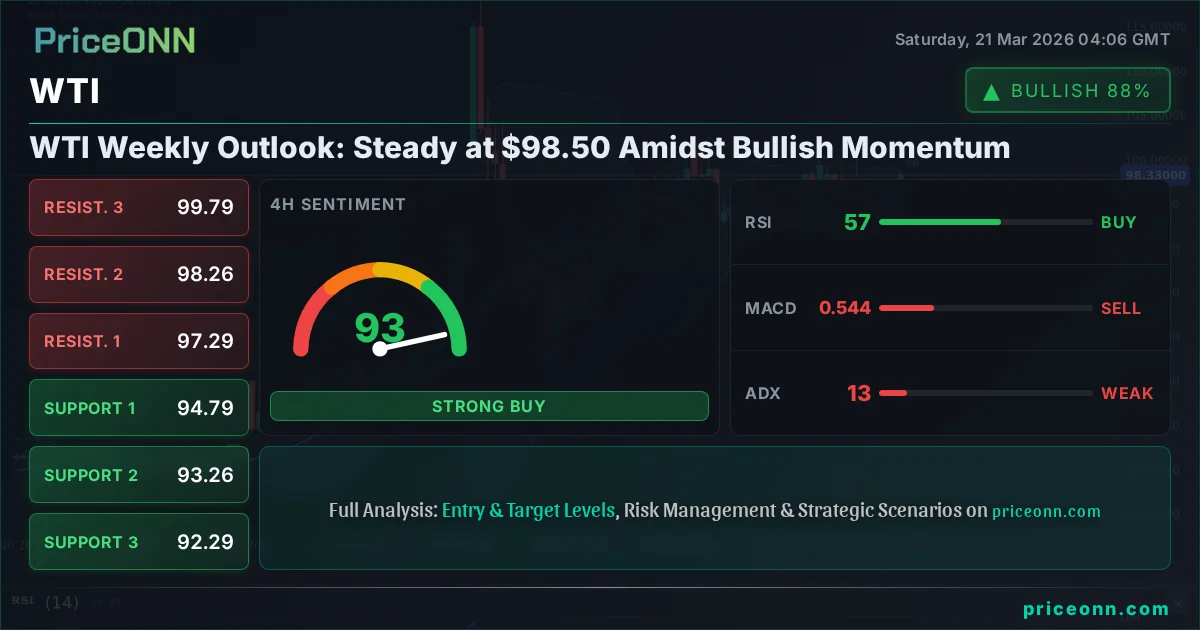
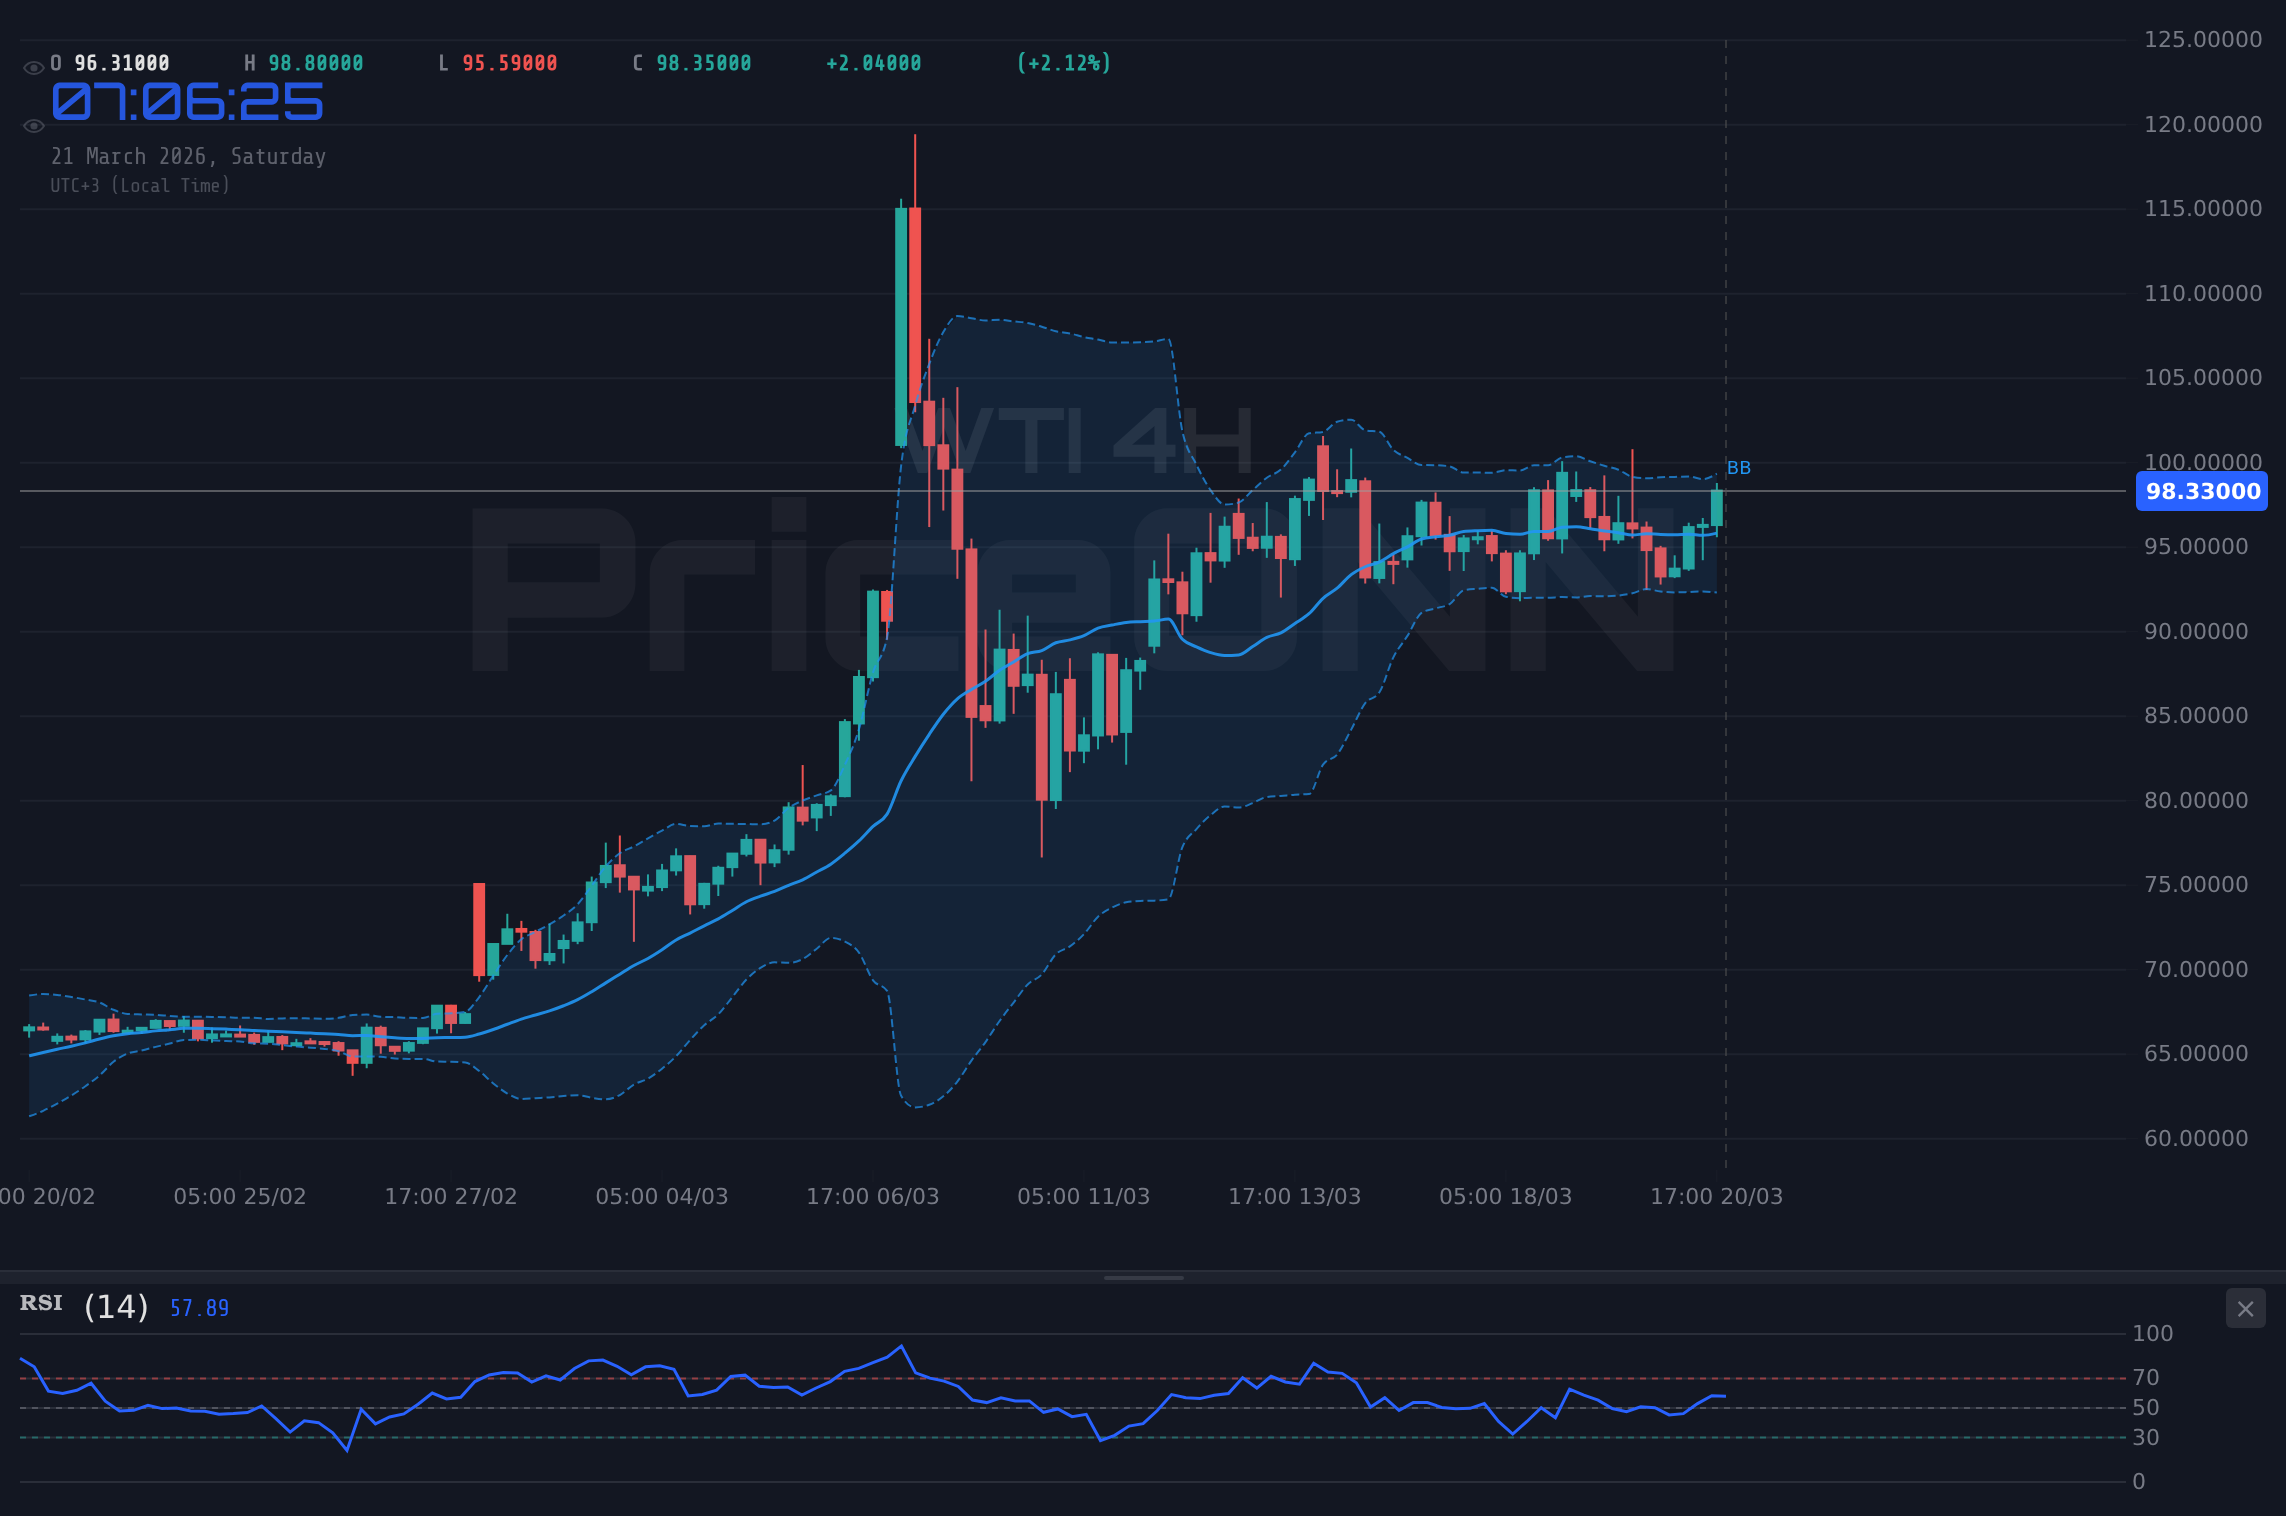
WTI Weekly Outlook: Steady at $98.50 Amidst Bullish Momentum
WTI crude oil holds steady at $98.50 as bullish momentum builds, with key resistance at $101.31 and support at $96.00. Technicals suggest a cautious but positive outlook for the week ahead.
WTI crude oil is navigating a pivotal moment, currently trading at $98.50 as the market digests a week of significant price action and geopolitical undercurrents. Last week saw WTI futures experience a notable surge, pushing past previous resistance levels and demonstrating robust bullish momentum. This upward trajectory, however, is met with cautious optimism as traders eye critical junctures that could determine the near-term direction. The interplay between escalating tensions in the Gulf, which typically supports oil prices, and the strengthening US Dollar presents a complex landscape. Understanding the confluence of these factors is paramount for deciphering WTI's path forward.
- WTI crude oil is trading at $98.50, showing strong bullish momentum driven by geopolitical tensions and a positive outlook on the 1H chart.
- Key resistance is identified at $101.31, with a break above this level potentially targeting $106.00, while immediate support lies at $96.00.
- The ADX reading of 13.05 on the 4H chart indicates a weak trend, suggesting potential choppiness despite the overall bullish signals from other indicators.
- The strengthening US Dollar Index (DXY), currently at 99.39, adds a layer of complexity, potentially capping gains for dollar-denominated commodities like WTI.
Navigating the Bulls' Charge: WTI's Ascent Above $98.50
The Technical Landscape: A Multi-Timeframe Perspective
The 1-hour chart for WTI paints a decidedly bullish picture. With the price currently hovering around $98.50, the trend is firmly established as bullish, boasting a strong conviction of 82%. This timeframe shows a clear upward trajectory, with the price comfortably trading above the middle Bollinger Band, a classic sign of sustained upward pressure. The RSI(14) at 62.14 reinforces this sentiment, indicating healthy momentum without yet entering overbought territory. Similarly, the Stochastic Oscillator, with %K at 92.01 and %D at 89.49, is deep in overbought territory, signaling strong bullish conviction, though it also hints at a potential for a short-term pullback or consolidation. The MACD is also in positive territory, with its histogram above the signal line, further confirming the prevailing bullish sentiment on this shorter timeframe. This suggests that on an intraday basis, buyers are in control.
However, delving into the 4-hour timeframe introduces a note of caution. While the trend is still classified as bullish with a power of 82%, the strength of this trend, as indicated by the ADX at 13.05, is notably weak. This low ADX value is a critical piece of information; it suggests that the current move, while directional, lacks the broad-based commitment needed for a sustained, powerful trend. It implies that the market might be experiencing a 'choppy' environment, where price can move up and down without a clear, committed direction, often leading to whipsaws for traders. The RSI(14) here sits at 57.26, still in bullish territory but showing less aggressive momentum than on the 1-hour chart. The Stochastic Oscillator is showing %K at 54.48 and %D at 33.93, indicating a bullish signal with %K above %D, but it's not in extreme zones. The MACD on this timeframe, however, shows negative momentum, with the MACD line below the signal line, creating a divergence with the overall bullish trend classification. This conflict between the trend direction and the MACD reading warrants attention, suggesting that the bullish conviction might not be as solid as it appears on the surface.
The daily chart introduces further nuance. Here, the trend is unequivocally bullish, with a perfect 100% power score. The price action is well above the middle Bollinger Band, and the RSI(14) at 70.65 is approaching the overbought threshold. This suggests significant upward momentum, but also raises the possibility of a near-term correction or consolidation phase as the market digests these gains. The Stochastic Oscillator, with %K at 61.11 and %D at 51.74, provides a bullish signal, though it's not in extreme overbought territory. Crucially, the ADX on the daily chart stands at a very strong 59.27. This indicates an extremely powerful trend, suggesting that once a direction is established, it tends to persist with significant force. The MACD is positive, with the histogram above the signal line, aligning with the bullish trend. The combination of a strong daily trend and an RSI nearing overbought levels presents a classic scenario: the trend is up, but the market is becoming extended, increasing the odds of a pause or pullback.
Key Levels and Price Action Dynamics
Examining the support and resistance levels provides concrete reference points for potential price action. On the 1-hour chart, immediate support is found at $97.77, followed by $96.64 and $96.00. These levels represent areas where buying interest has previously emerged or where a retracement might find footing. Resistance, on the other hand, looms at $99.54, $100.18, and crucially, $101.31. A decisive break above $99.54 would be the first sign of continued intraday strength, with $100.18 serving as a psychological barrier. The $101.31 level is particularly significant; a clear breach and hold above this point could signal a continuation of the bullish trend, potentially opening the door for further upside.
The 4-hour timeframe offers slightly different levels, with support at $94.79, $93.26, and $92.29. These are deeper support levels that would come into play if the short-term bullish sentiment falters. Resistance on this timeframe is seen at $97.29, $98.26, and $99.79. The $98.26 level is particularly interesting as it falls just above the current trading price of $98.50 on the 1-hour chart, highlighting a zone of immediate price congestion. A move above $98.26 on this timeframe would confirm the bullish sentiment, with $99.79 acting as the next significant hurdle.
On the daily chart, the support levels are more substantial: $91.26, $87.69, and $82.92. These represent the major floors that would need to be breached for a significant bearish reversal to occur. The daily resistance levels are also considerable, with $99.60, $104.37, and $107.94. The $99.60 level is a critical psychological and technical barrier. A sustained move above this point on the daily chart would be a strong bullish signal, indicating that the rally is gaining serious traction and could extend towards the higher resistance targets. Conversely, failure to overcome $99.60 could lead to a period of consolidation or a retracement towards the daily support levels.
Geopolitical Currents and Macroeconomic Crosswinds
The Impact of Middle East Tensions
The recent escalation of tensions in the Middle East continues to be a significant tailwind for crude oil prices. News reports from Friday indicated renewed attacks on Kuwait by Iran, which, as we've seen historically, tends to tighten supply concerns and boost oil prices. This geopolitical risk premium is a fundamental driver that often overrides purely technical considerations in the short to medium term. The Brent-WTI spread has also widened, with Brent oil surging past $114 while WTI lagged, a dynamic that can sometimes signal underlying strength in the broader oil market, even if specific crude benchmarks show divergence. This widening spread, hitting an 11-year high according to some reports, often occurs when supply disruptions are geographically specific or impact certain grades of crude more than others. The market's reaction to these events is typically swift, with prices reacting to perceived threats to supply routes and production facilities. For WTI, this translates into a supportive environment, making it harder for bearish sentiment to take hold as long as these geopolitical risks persist.
The Dollar's Dual Role
While geopolitical tensions provide a bullish backdrop for WTI, the strengthening US Dollar Index (DXY) presents a counteracting force. Currently trading around 99.39, the DXY has seen a notable uptick, reflecting a broader strengthening of the dollar against major currencies. A stronger dollar typically makes dollar-denominated commodities like WTI more expensive for holders of other currencies, potentially dampening demand and capping price increases. On the 1-hour chart, the DXY shows a bullish trend with a power of 91%, despite some conflicting signals on shorter timeframes. The daily chart, however, shows a clear bullish trend with 92% power, supported by an RSI of 58.15 and positive MACD momentum. This dual pressure - geopolitical risk pushing oil up, and a stronger dollar potentially pushing it down - creates a complex trading environment. The market must weigh the immediate supply-side concerns against the broader macroeconomic trend of dollar strength.
Central Bank Narratives and Inflation Expectations
The broader macroeconomic narrative, particularly concerning central bank policies and inflation, also plays a crucial role. While specific central bank announcements were not highlighted as major catalysts in the most recent news flow, the underlying sentiment often revolves around inflation expectations and interest rate trajectories. Historically, rising oil prices are a significant contributor to inflation. This can put central banks in a difficult position, potentially forcing them to maintain a hawkish stance or even consider further tightening to combat price pressures. Conversely, a sustained period of high oil prices could also lead to demand destruction, eventually cooling inflation. The current market seems to be pricing in a continued bullish trend for oil, possibly anticipating that demand will remain robust enough to absorb higher prices, or that geopolitical supply disruptions will be the dominant factor. The hawkish Fed narrative, mentioned in relation to the Dow Jones' decline, suggests that interest rate expectations are still tilted towards tighter monetary policy, which could, in normal circumstances, weigh on commodities. However, the current oil rally appears to be driven more by supply-side fears than by strong demand indicators, making it somewhat resilient to typical anti-inflationary monetary policy headwinds.
Market Sentiment and Correlation
Market sentiment, as reflected in equity indices like the S&P 500 and Nasdaq, also provides context. The significant declines in these indices last week, with the S&P 500 plunging below critical support and the Nasdaq experiencing a sharp drop, indicate a broader risk-off sentiment in the financial markets. Typically, a decline in risk appetite leads investors to seek safe-haven assets, which can include gold and sometimes the US Dollar. While this risk-off sentiment might not directly impact WTI in the same way as gold, it does highlight a general cautiousness among investors. The fact that WTI is showing bullish momentum despite a general risk-off environment in equities suggests that the drivers for oil - geopolitical supply concerns - are currently strong enough to override broader market fears. This decoupling from equity market sentiment is noteworthy and underscores the specific supply-driven nature of the current oil price surge.
The current market environment for WTI is characterized by a tug-of-war between strong geopolitical supply risks, which are bullish for oil, and a strengthening US Dollar, which acts as a headwind. This complexity is amplified by a general risk-off sentiment in equity markets, highlighting the dominance of supply-side factors in driving WTI prices higher.
Scenario Analysis: Charting the Week Ahead
Given the confluence of technical signals and fundamental drivers, it's crucial to outline potential scenarios for WTI's price action in the coming week. The market is currently balanced precariously between strong bullish catalysts and potential headwinds, making scenario planning essential for navigating this environment.
Bearish Scenario: Profit-Taking and Dollar Strength Pressure
30% ProbabilityConsolidation Scenario: Range-Bound Volatility
40% ProbabilityBullish Scenario: Geopolitical Risk Dominates
30% ProbabilityWhat the Indicators Are Telling Us
RSI Divergence and Overbought Conditions
The Relative Strength Index (RSI) provides a mixed but predominantly bullish signal across different timeframes, albeit with nuances that require careful interpretation. On the 1-hour chart, the RSI at 62.14 is comfortably in bullish territory, suggesting strong upward momentum. However, the daily RSI at 70.65 is nearing the overbought threshold of 70. While not an immediate sell signal, an RSI reading this high indicates that the asset is becoming extended and vulnerable to a correction or consolidation. This is particularly relevant given the significant daily trend strength indicated by the ADX. The 4-hour RSI at 57.26 sits in a healthier bullish zone, suggesting that while the daily chart is becoming extended, the medium-term momentum is still robust. The divergence between the strong daily trend and the RSI approaching overbought levels is a key observation, hinting that the current rally might be losing steam at higher prices and could be due for a pause.
MACD and Trend Strength
The Moving Average Convergence Divergence (MACD) indicator offers further insight, though its signals are not entirely consistent across all timeframes. On the 1-hour and daily charts, the MACD is positive, with the histogram above the signal line, aligning with the overall bullish trend. This suggests that bullish momentum is currently dominant on these longer intraday and daily perspectives. However, the 4-hour MACD presents a conflicting picture: it shows negative momentum, with the MACD line below the signal line. This divergence between the 4-hour MACD and the bullish trend classification, as well as the bullish signals on other timeframes, is a critical point. It suggests that while the broader trend might be up, the short-to-medium term momentum on the 4-hour chart is weakening, potentially signaling a near-term reversal or at least a period of consolidation. The strength of the trend itself is vividly illustrated by the ADX indicator. On the 1-hour chart, ADX is 17.29 (weak trend), on the 4-hour it's 13.05 (very weak trend), and on the daily it's a very strong 59.27 (very strong trend). This stark contrast, especially the weak ADX on the 4-hour, suggests that the current bullish move might lack the conviction for a sustained breakout and could be prone to sideways movement or sharp reversals.
Stochastic Oscillator and Bollinger Bands
The Stochastic Oscillator is flashing signals that warrant attention, particularly regarding potential overbought conditions and divergences. On the 1-hour chart, %K at 92.01 and %D at 89.49 are deeply in overbought territory, indicating strong bullish momentum but also a heightened risk of a pullback. The 4-hour Stochastic shows %K at 54.48 and %D at 33.93, a bullish signal with %K above %D, but not in extreme zones. The daily Stochastic, with %K at 61.11 and %D at 51.74, also provides a bullish signal, though it's not in extreme territory. The significant overbought reading on the 1-hour chart, in particular, suggests that intraday traders might be looking to take profits, which could lead to a short-term dip. Bollinger Bands offer another perspective. On the 1-hour and daily charts, the price is trading above the middle band, indicating bullish pressure. On the 4-hour, it's also above the middle band, suggesting an upward bias. However, the fact that the daily RSI is approaching overbought levels while the price is above the middle Bollinger Band on the daily chart suggests that the market is becoming extended. The interplay between the Stochastic oscillator's overbought signals on the shortest timeframe and the bullish but extended RSI on the daily chart highlights the need for caution regarding further upside potential without consolidation.
| Indicator | Value | Signal | Interpretation |
|---|---|---|---|
| RSI (14) | 70.65 | Neutral | Approaching overbought on Daily; Bullish on 1H. |
| MACD | Positive | Bullish | Positive on 1H & Daily; Negative divergence on 4H. |
| Stochastic | %K: 61.11, %D: 51.74 | Bullish | Bullish signal on Daily & 4H; Extreme overbought on 1H. |
| ADX | 59.27 | Strong Trend | Very strong trend on Daily; Weak trend on 4H. |
| Bollinger Bands | Above Middle Band | Bullish | Price above middle band on all timeframes, extended on Daily. |
The Week Ahead: Key Events and Levels to Watch
Looking ahead, several factors will be crucial in shaping WTI's trajectory. Geopolitical developments in the Middle East will undoubtedly remain a primary focus. Any further escalation or de-escalation of tensions could trigger significant price swings. Investors will be closely monitoring headlines for any news that could impact oil supply or transit routes. The ongoing strength of the US Dollar also bears watching. If the DXY continues its upward trend, it could act as a persistent drag on WTI prices, even amidst bullish supply-side news. This dynamic suggests that a breakout above key resistance levels might require a weakening dollar or exceptionally strong bullish catalysts to overcome.
From a technical standpoint, the $99.60 level on the daily chart is the most critical resistance to watch. A sustained break above this point would confirm the strength of the ongoing bullish trend and could propel prices towards the $104.37 and $107.94 targets. Conversely, failure to break this resistance, coupled with a potential shift in geopolitical sentiment or a further strengthening of the dollar, could see prices retreat. Immediate support at $97.77 on the 1-hour chart will be a key level to monitor for intraday strength, while the $94.79 support on the 4-hour chart represents a more significant floor that would need to hold if a deeper correction unfolds. The divergence in ADX readings across timeframes also suggests that while the daily trend is strong, the shorter-term picture might be more prone to consolidation or minor reversals, making decisive breakouts crucial for sustained momentum.
The market sentiment, currently leaning risk-off in equities, adds another layer of complexity. While oil's geopolitical drivers are potent, a broader market downturn could eventually spill over. However, the current strength of the bullish trend on the daily chart, supported by strong ADX and positive MACD, suggests that oil is currently exhibiting resilience. Traders will need to remain vigilant, watching for confirmation signals, especially on the daily chart, before committing to significant positions. The potential for overbought conditions on the daily RSI also suggests that a period of consolidation or a shallow pullback might be healthy for the trend before any further significant upward movement.
The coming week for WTI will likely be defined by the interplay between persistent geopolitical supply risks and the strengthening US Dollar. Key levels to watch are $99.60 for resistance and $97.77/$94.79 for support, with the daily chart's strong bullish trend facing potential headwinds from overbought RSI conditions.
Frequently Asked Questions: WTI Analysis
What happens if WTI breaks above the $101.31 resistance level?
A sustained break above $101.31 on the 1-hour chart, supported by bullish momentum and positive geopolitical news, could signal a continuation of the uptrend. This would likely target the next resistance levels around $104.37 and potentially $107.94 on the daily chart, confirming the bullish scenario.
Should I buy WTI at current levels of $98.50 given the mixed signals?
Entering at current levels carries risk due to mixed signals; the 1-hour chart is bullish but overbought, while the 4-hour shows weak trend strength (ADX 13.05) and MACD divergence. A more prudent approach might be to wait for confirmation, such as a break above $99.54 or a pullback to a stronger support level like $96.00, to reduce risk and improve the risk/reward ratio.
Is the RSI at 70.65 a sell signal for WTI right now?
An RSI reading of 70.65 on the daily chart indicates that WTI is approaching overbought territory. While not an immediate sell signal on its own, it suggests that the market is becoming extended and vulnerable to a correction or consolidation. Traders should look for additional bearish confirmation, such as bearish divergence on shorter timeframes or a break below key support, before considering a sell entry.
How will the strengthening DXY at 99.39 affect WTI this week?
The strengthening US Dollar Index (DXY) currently at 99.39 acts as a headwind for WTI, making oil more expensive for holders of other currencies and potentially dampening demand. This could cap WTI's upside potential, especially if geopolitical risks subside. Traders should monitor the DXY's trend; a continued rise could pressure WTI's gains, while a pullback in the dollar could offer further room for oil to rally.
Track markets in real-time
AI-powered analysis, technical indicators and real-time price data.
Join Our Telegram Channel
Breaking market news, AI analysis and trading signals instantly.
Join Channel