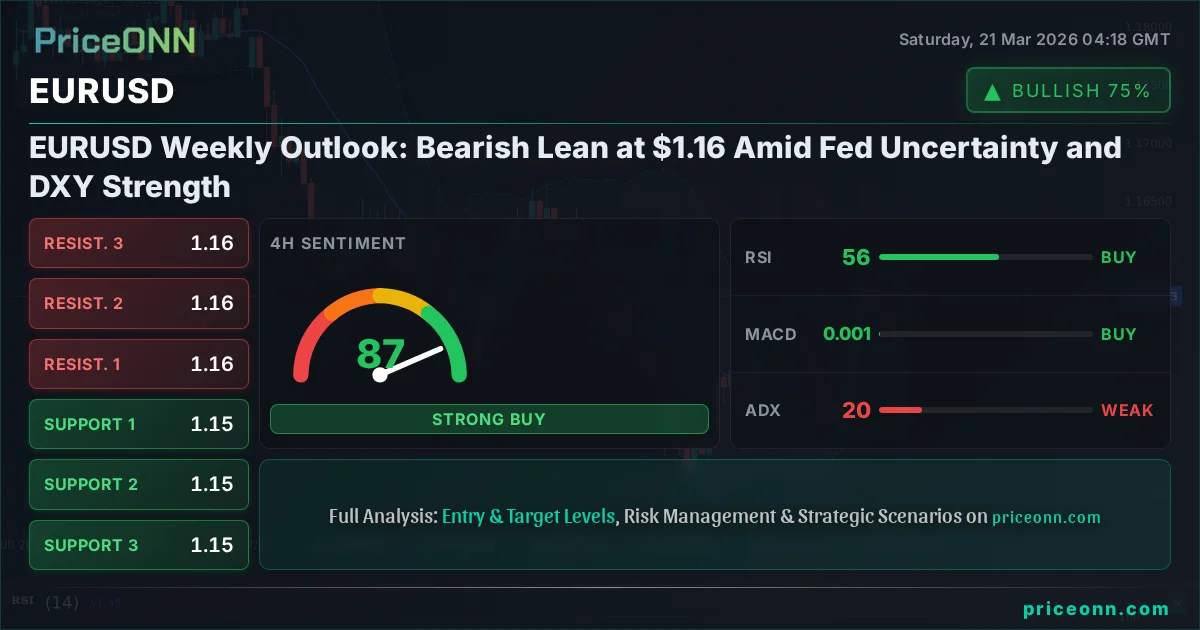
EURUSD Weekly Outlook: Bearish Lean at $1.16 Amid Fed Uncertainty and DXY Strength
EURUSD struggles near $1.16. With the DXY strengthening and Fed rate cut expectations in flux, a bearish outlook prevails. Key levels to watch this week.
The currency markets are at a fascinating crossroads, with EURUSD hovering around the critical $1.16 level as we head into the latter half of March 2026. This past week has been a rollercoaster, marked by shifting expectations around Federal Reserve policy, persistent geopolitical tensions that continue to rattle commodity markets, and a strengthening US Dollar Index (DXY). For EURUSD, the confluence of these factors paints a picture that leans towards caution, with a distinct bearish undertone. While the pair has shown resilience at times, the prevailing technical and fundamental winds suggest that further downside pressure is a more probable scenario in the short to medium term. Understanding the interplay between global risk sentiment, central bank divergence, and specific technical formations is crucial for navigating this complex currency pair. This analysis delves into the key drivers, technical indicators, and market correlations that shape our EURUSD weekly outlook, focusing on the levels that matter most for traders and investors.
- The RSI on the 4-hour chart is at 56.39, indicating a neutral-to-bullish momentum but showing signs of stalling after a recent push higher.
- Critical support for EURUSD sits at $1.15239, a level tested multiple times this week, with a break below potentially accelerating declines.
- MACD histogram on the daily chart shows negative momentum, suggesting that bearish sentiment is building despite short-term fluctuations.
- The correlation with a strengthening DXY (currently at 99.39) is a significant headwind for EURUSD, as a stronger dollar typically weighs on the euro.
Navigating the Dollar's Strength: The DXY's Dominance
The US Dollar Index (DXY), a key barometer of the dollar's strength against a basket of major currencies, has been a dominant force shaping the forex landscape. This week, the DXY has shown renewed vigor, trading around 99.39. This upward momentum is not merely a technical anomaly; it's underpinned by a complex mix of global economic signals and shifting monetary policy expectations. The Federal Reserve, while maintaining a cautious stance on rate cuts, has signaled a potential for fewer reductions than previously anticipated, especially in light of persistent inflation data. This hawkish tilt, even a subtle one, tends to bolster the dollar by making dollar-denominated assets more attractive relative to those in other currencies with more dovish central banks. The strength of the DXY directly impacts EURUSD, as the pair represents a significant portion of the index. When the dollar strengthens, it naturally exerts downward pressure on EURUSD, pushing it towards lower levels. Traders are closely watching the DXY's ability to hold above key support levels, such as 99.08 on the 4-hour chart, as a sustained move higher here would likely confirm the bearish bias for EURUSD.
The implications of a strong dollar extend beyond simple currency valuation. It can also influence global capital flows, making emerging market assets less attractive and potentially increasing demand for US Treasuries. This risk-off sentiment, often accompanying dollar strength, can further suppress riskier assets and currencies, including the Euro. For EURUSD, this means that even if European economic data were to show some improvement, the strong dollar could act as a persistent ceiling, capping any significant upside potential. The ADX on the daily DXY chart at 34.64 indicates a strong uptrend, reinforcing the idea that dollar strength is a dominant theme right now. This is a crucial piece of context for any EURUSD analysis, as it highlights a significant macroeconomic headwind that technical patterns must overcome for a bullish reversal to gain traction.
EURUSD Technicals: A Bearish Lean on Multiple Timeframes
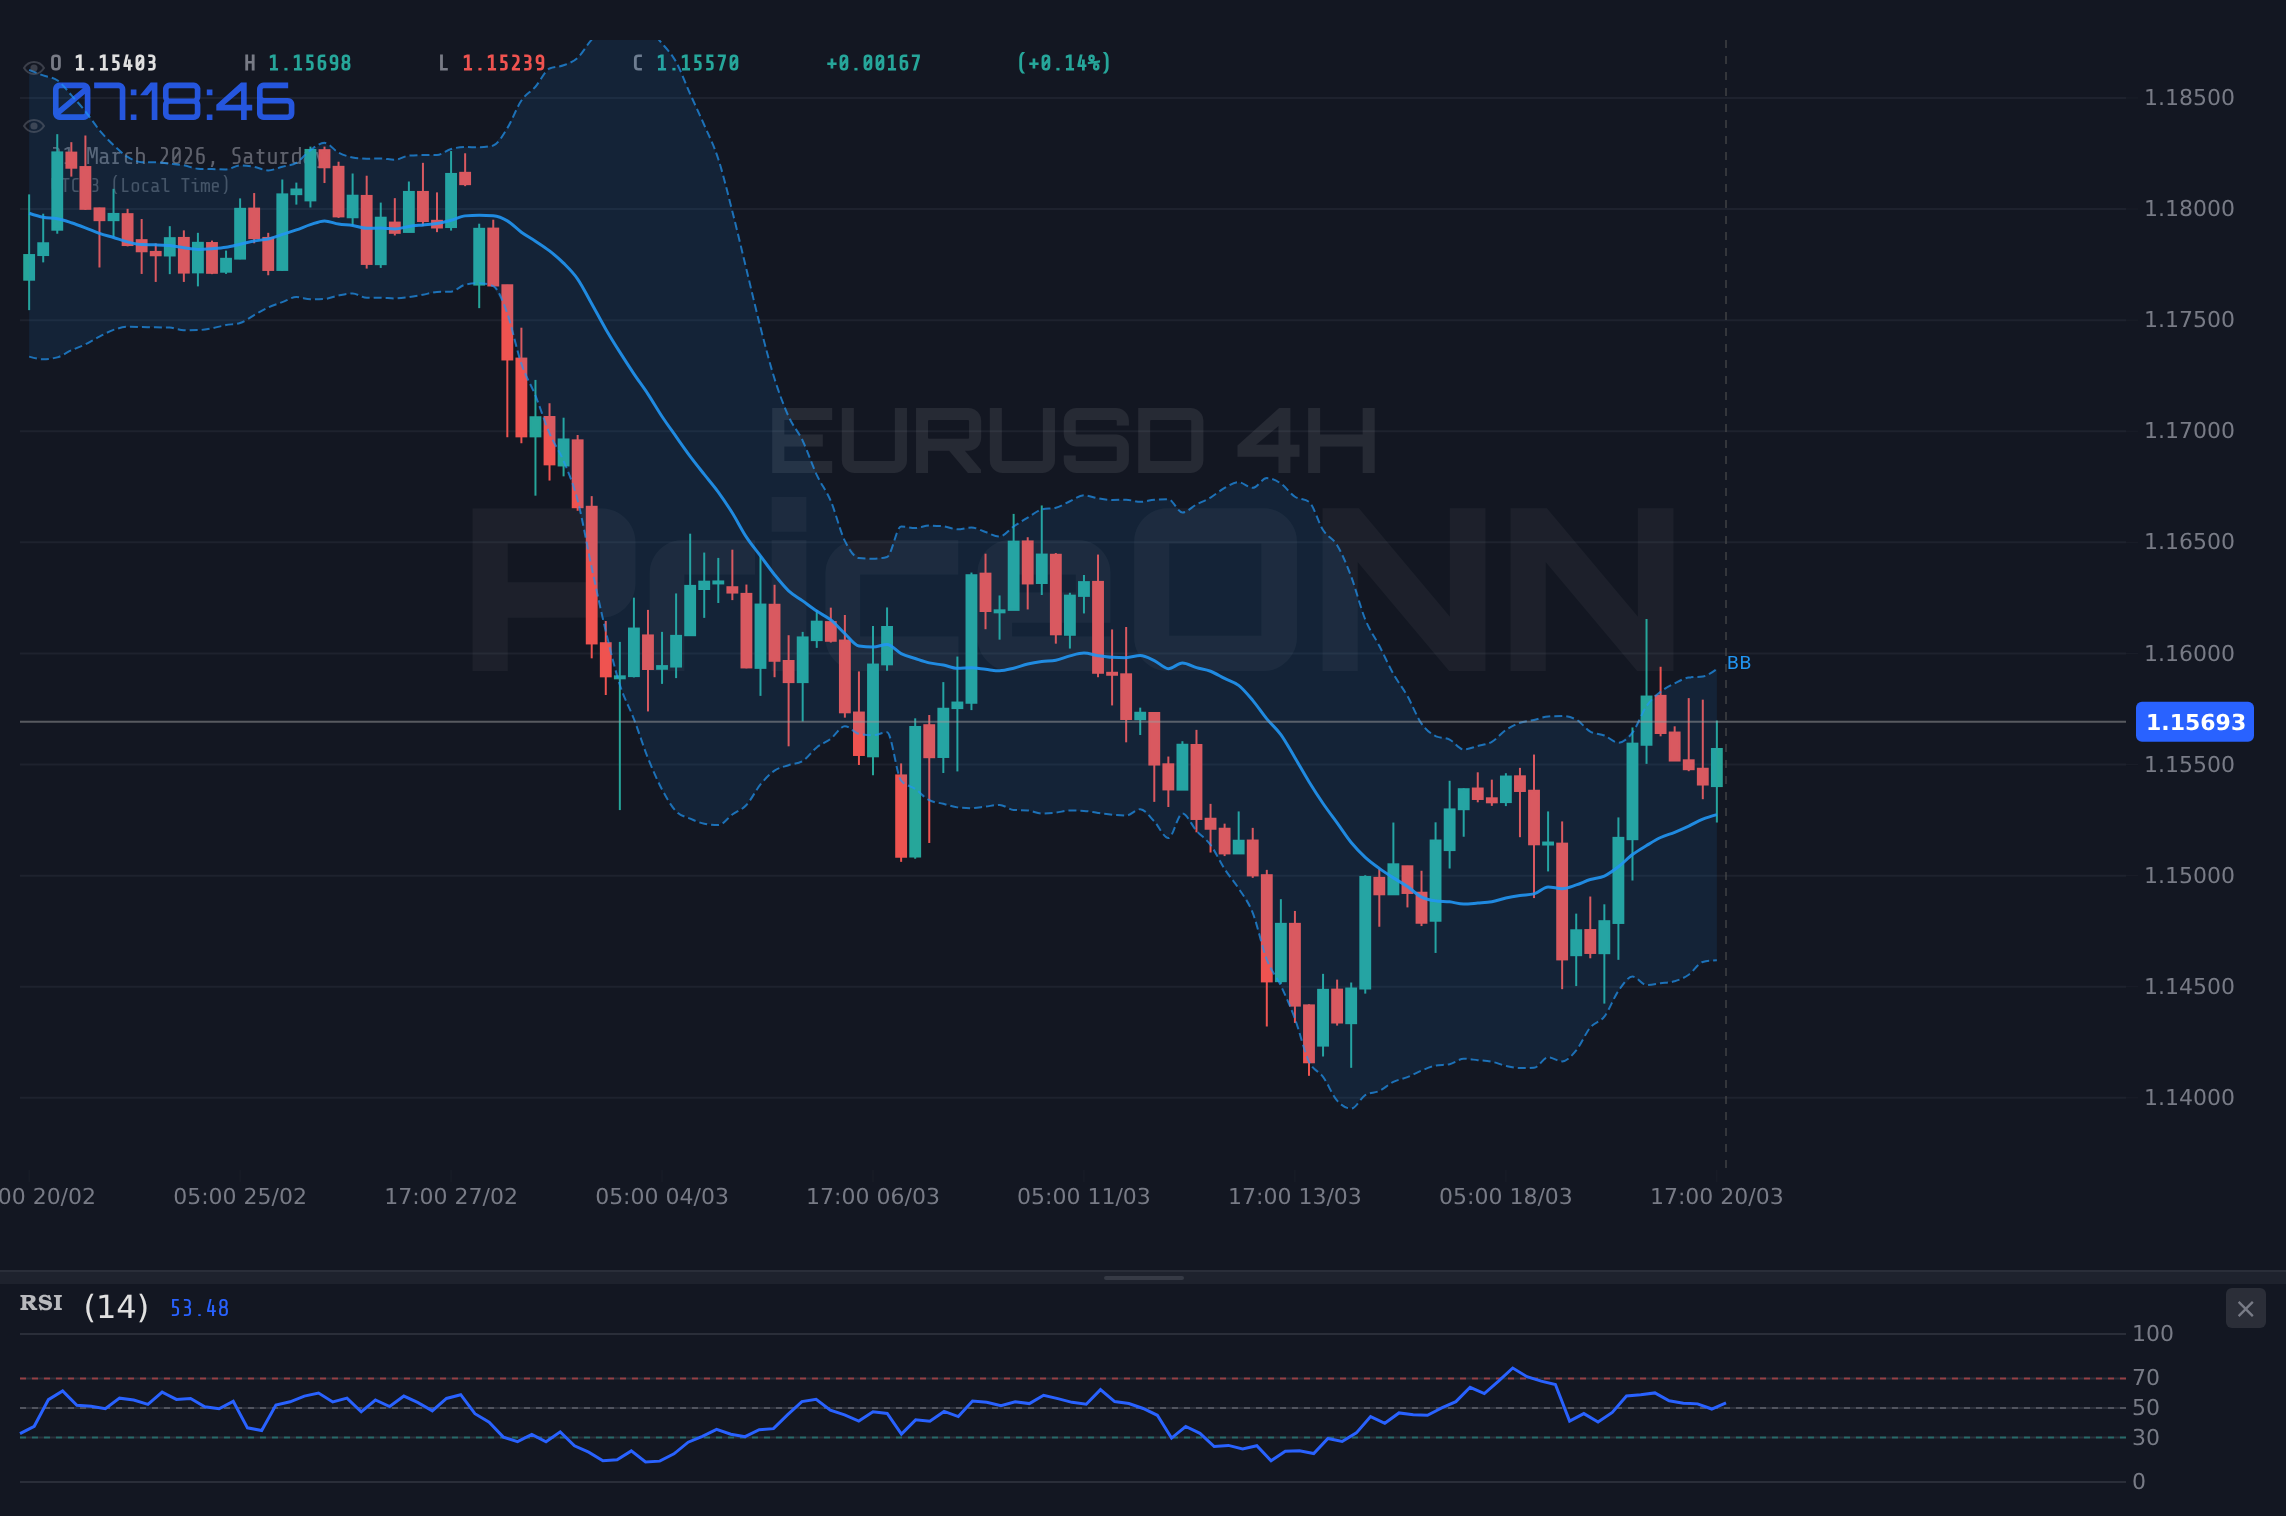
Turning our attention to the EURUSD chart itself, the technical picture across multiple timeframes reinforces the bearish lean. On the 1-hour chart, while the trend is technically classified as 'Uptrend (Strength: 87%)' with an RSI of 53.72, this momentum appears to be losing steam as it approaches resistance. The MACD is showing negative momentum, lurking below its signal line, which is a subtle warning sign that the current upward push might be a mere correction within a larger downtrend. More importantly, the 4-hour timeframe presents a mixed but leaning-bearish signal. The trend is 'Neutral (Strength: 50%)', but the RSI at 56.39 is hovering in a zone that could easily turn south, and the Stochastic Oscillator is showing a potential bearish crossover (%K < %D). The ADX at 19.77 suggests a weak trend, indicating choppiness, but the overall context of the daily chart is more concerning.
The daily EURUSD chart paints the most compelling bearish narrative. The trend is decisively 'Downtrend (Strength: 94%)', with the RSI reading a subdued 44.34. This level suggests that while the pair isn't deeply oversold, the sellers have maintained control for a significant period. The MACD on the daily chart is firmly negative, with the histogram below the signal line, indicating strengthening downside momentum. This is a critical indicator for longer-term direction. Furthermore, the Bollinger Bands on the daily chart show the price trading below the middle band, a classic sign of bearish pressure. The Stochastic Oscillator, with %K at 49.67 and %D at 30.17, presents a bullish divergence signal (%K > %D), which could suggest a short-term bounce is possible. However, this is occurring within the context of a strong downtrend, and such divergences often fail in powerful trends. The ADX at 37.37 confirms a strong downtrend, underscoring the prevailing bearish sentiment. For EURUSD to find sustainable support, it would need to break convincingly below the daily support at $1.14768, which would then open the door for further declines towards $1.13731 and potentially $1.13037.
The Role of Geopolitics and Inflationary Pressures
Beyond the direct influence of central banks and technical indicators, the macroeconomic environment plays a crucial role in shaping EURUSD's trajectory. Geopolitical tensions, particularly those involving major energy producers and trade routes, continue to inject volatility into the markets. Recent news highlights escalating tensions in the Gulf, which have directly impacted crude oil prices, pushing WTI futures towards $97.82 and Brent crude above $112.79. Higher energy prices have a dual effect: they can fuel inflation expectations, prompting central banks to adopt a more hawkish stance, and they can also dampen global economic growth by increasing operational costs for businesses and reducing consumer spending power. For the Eurozone, heavily reliant on energy imports, sustained high oil prices pose a significant inflationary challenge and a drag on economic activity. This dynamic can indirectly weaken the Euro, especially if the European Central Bank (ECB) is perceived to be less aggressive in tackling inflation compared to the Federal Reserve.
The correlation between oil prices and EURUSD is not always straightforward but is undeniably present. When oil prices surge due to supply disruptions, it can create a 'risk-off' environment. In such scenarios, investors often flock to safe-haven assets, including the US Dollar. This dynamic further exacerbates the downward pressure on EURUSD. While gold prices have tumbled below $4,500 as rising US yields diminish their safe-haven appeal, the underlying inflationary concerns driven by energy prices remain. This creates a complex interplay where rising oil prices might normally support gold, but higher yields are currently overpowering that effect. For EURUSD, the key takeaway is that elevated energy costs and associated geopolitical risks tend to favor the dollar over the euro, especially when the Fed is signaling a more restrictive monetary policy path. The market is constantly weighing these factors, and any escalation in geopolitical events could lead to sharp moves in both energy prices and currency pairs like EURUSD.
Key Levels and What They Mean for Different Traders
Understanding the critical support and resistance levels is paramount for any trader looking to navigate the EURUSD market. Currently, the pair is trading around $1.16, with immediate resistance found at $1.15647, $1.15797, and $1.15885 on the 1-hour chart. A decisive break above these levels, particularly holding above $1.15885 on a 4-hour closing basis, would be required to invalidate the near-term bearish outlook and potentially signal a move higher. Such a move would likely need confirmation from broader market sentiment shifting away from dollar strength and towards risk-on appetite, possibly signaled by a pullback in the DXY below 99.00 and a recovery in risk assets like the S&P 500.
Conversely, the support levels are where the bears will be looking to press their advantage. On the 1-hour chart, support lies at $1.15409, $1.15321, and $1.15171. However, the more significant daily support levels are at $1.14768, $1.13731, and $1.13037. A break below the immediate 4-hour support at $1.15239 would be the first sign that the bearish pressure is intensifying. Scalpers and short-term traders will be eyeing these intraday levels for quick entries and exits, likely looking for opportunities to short on rallies towards resistance or to enter long positions if the $1.15239 support holds decisively, targeting the immediate hourly resistances. Swing traders, on the other hand, will be more focused on the daily chart. A close below $1.14768 would be a significant bearish signal, opening up targets towards $1.13731. They will be looking for confirmation through sustained lower closes and bearish indicator readings across multiple timeframes.
For long-term investors, the picture is less about intraday fluctuations and more about the broader trend and fundamental shifts. They will be watching if the ECB can navigate the inflationary pressures without resorting to overly aggressive tightening that could stifle economic growth, and how the Fed's policy path evolves. A sustained break below the daily support at $1.13037 would signal a more profound bearish trend, potentially attracting longer-term bearish positions. Conversely, a clear break and hold above the daily resistance at $1.16499, coupled with a softening DXY and a more constructive global economic outlook, could signal a longer-term bullish reversal. The current ADX of 37.37 on the daily chart, however, suggests that the existing downtrend has significant strength, making a sustained bullish reversal a challenging prospect without a major shift in fundamental drivers.
Historical Context: Past Patterns in EURUSD
To gain further perspective, it’s valuable to look at how EURUSD has behaved during periods of similar dollar strength and shifting central bank expectations. Historically, periods where the Federal Reserve signals a more hawkish stance relative to the ECB have often led to sustained uptrends in the DXY and corresponding downtrends in EURUSD. For instance, during the tightening cycle that began in early 2022, the dollar experienced a significant rally, pushing EURUSD to multi-decade lows. While the specific macroeconomic conditions differ today – particularly concerning inflation drivers like energy prices and supply chain dynamics – the principle of dollar outperformance driven by Fed policy divergence remains a potent force. We observed similar patterns where technical levels acted as critical inflection points. For example, the $1.15 support zone has been a battleground multiple times in recent years, and its ability to hold or break has often dictated the subsequent trend for months.
The current technical setup, with RSI readings in the 40s on the daily chart and MACD generating negative momentum, bears resemblance to previous consolidation or reversal attempts within broader downtrends. When EURUSD has previously attempted to rally against a strong dollar, it often faced stiff resistance near the mid-1.15 to 1.16 levels, precisely where it is struggling now. The ADX readings also provide historical context. A daily ADX above 30, as seen currently at 37.37, typically signifies a strong trend. In the past, such strong trends have often seen pullbacks but ultimately continued in their established direction until a significant shift in fundamentals or market sentiment occurred. The current downtrend, with its strong ADX, suggests that any potential rallies might be short-lived 'bear market rallies' rather than the start of a new sustained uptrend, unless key resistance levels are decisively broken with conviction and supported by improving macroeconomic data from the Eurozone or a clear dovish pivot from the Fed.
Correlation Analysis: Beyond the Greenback
While the DXY is the most direct correlation for EURUSD, analyzing its relationship with other major markets provides a more holistic view. The S&P 500 and Nasdaq 100 indices have experienced significant declines this week, trading at 6536.05 and 23992.13 respectively. This broad market selloff indicates a 'risk-off' sentiment, which typically favors safe-haven assets like the US Dollar and can weigh on riskier currencies and assets. The fact that EURUSD is struggling to find footing even as equities fall suggests that the dollar's safe-haven appeal is currently outweighing any potential euro strength derived from traditional risk appetite. This is a crucial nuance: normally, a risk-off environment might see USDJPY fall and EURUSD rise as investors seek safety. However, the current dynamic seems to be dollar-centric, where the dollar itself is acting as the primary safe haven, potentially at the expense of other currencies including the Euro.
The correlation with oil prices is also noteworthy. With Brent crude trading above $112.79 and WTI near $98.50, energy prices are elevated. While this can fuel inflation and potentially weaken currencies sensitive to import costs (like the Euro), the immediate market reaction has been a flight to the dollar. This suggests that the inflationary impact is currently being viewed through the lens of Fed policy response rather than a direct drag on European economic prospects that would weaken the Euro significantly. Gold's tumble below $4,500, despite oil's rise, further supports the narrative of dollar strength and rising yields dominating safe-haven flows, pushing investors away from traditional inflation hedges. This complex web of correlations highlights that the current market environment is heavily influenced by the Fed's stance and the dollar's strength, making EURUSD's path intricately linked to these dominant themes.
The Path Forward: Scenarios and Key Events
Looking ahead, several key events and technical levels will dictate the direction of EURUSD. The immediate focus remains on the $1.15239 support level. A daily close below this mark would significantly increase the probability of a move towards the next major support at $1.14768. This would align with the current bearish technical signals, including the negative MACD momentum and strong daily ADX. If this bearish scenario plays out, traders should look for confirmation through increasing volume on down moves and continued weakness in risk assets, alongside a DXY holding firm above 99.00.
Conversely, a bullish scenario would require EURUSD to decisively break and hold above the immediate hourly resistance cluster near $1.15885. This would necessitate a shift in market sentiment, perhaps triggered by less hawkish-than-expected commentary from Fed officials or stronger economic data from the Eurozone that bolsters the Euro independently of dollar movements. A sustained move above $1.16499 on the daily chart would be a more significant bullish development, potentially signaling the end of the current downtrend and opening targets towards $1.17193. However, given the current strong dollar trend and bearish technicals, this remains a lower probability outcome in the short term.
A neutral or consolidation scenario is also possible, especially if upcoming economic data provides mixed signals or if key central bank speeches offer little new direction. In such a case, EURUSD might continue to trade within the established range, potentially between the $1.15239 support and the $1.15885 resistance. This choppy, range-bound environment, suggested by the weaker ADX readings on lower timeframes, could offer opportunities for range traders but would be challenging for trend followers. Patience will be key, waiting for a clear breakout above resistance or a decisive breakdown below support to engage with higher conviction.
Bearish Scenario: Downside Pressure Mounts
65% ProbabilityNeutral Scenario: Range-Bound Consolidation
25% ProbabilityBullish Scenario: Rebound Potential Ignored?
10% ProbabilityFrequently Asked Questions: EURUSD Analysis
What happens if EURUSD breaks below the $1.15239 support level?
A daily close below $1.15239 would validate the bearish scenario, indicating increased selling pressure. This could lead to a rapid decline towards the next significant daily support at $1.14768, as traders react to the breakdown and potential acceleration of the downtrend confirmed by the daily ADX at 37.37.
Should I consider buying EURUSD at current levels near $1.16 given the RSI at 56.39 on the 4H chart?
Buying at current levels carries significant risk given the overall bearish trend and strong dollar. While the 4H RSI is neutral-to-bullish, it lacks conviction. A more prudent approach would be to wait for a confirmed break above hourly resistance near $1.15885 or a significant shift in macro sentiment, which currently seems unlikely. A break below $1.15239 would invalidate any short-term bullish thesis.
Is the negative MACD momentum on the daily chart a strong sell signal for EURUSD?
The negative MACD momentum on the daily chart is a strong indicator of underlying bearish pressure, suggesting sellers are in control over the longer term. While it doesn't dictate immediate entry timing, it confirms that any rallies are likely to be met with resistance, reinforcing the potential for further downside as long as this momentum persists.
How will the Federal Reserve's policy outlook impact EURUSD this week?
Any hint from the Fed of a more hawkish stance, or fewer rate cuts than anticipated, will likely strengthen the US Dollar further, putting additional downward pressure on EURUSD. Conversely, a surprisingly dovish tone could offer some respite, but the current strong dollar trend and bearish technicals suggest that such a move would need to be substantial to reverse the pair's trajectory.
Technical Outlook Summary
| Indicator | Value | Signal | Interpretation |
|---|---|---|---|
| RSI (14) | 44.34 | Bearish | Suggests sellers have control, but not oversold yet. |
| MACD Histogram | -0.0017 | Bearish | Negative momentum strengthening on daily chart. |
| Stochastic | K:49.67, D:30.17 | Bullish Divergence | Potential for short-term bounce, but trend is down. |
| ADX | 37.37 | Strong Trend | Confirms a strong downtrend is in play. |
| Bollinger Bands | Price below middle band | Bearish Pressure | Suggests bearish sentiment and potential downside. |
Key Levels
Support Levels
Resistance Levels
Track markets in real-time
AI-powered analysis, technical indicators and real-time price data.
Join Our Telegram Channel
Breaking market news, AI analysis and trading signals instantly.
Join Channel