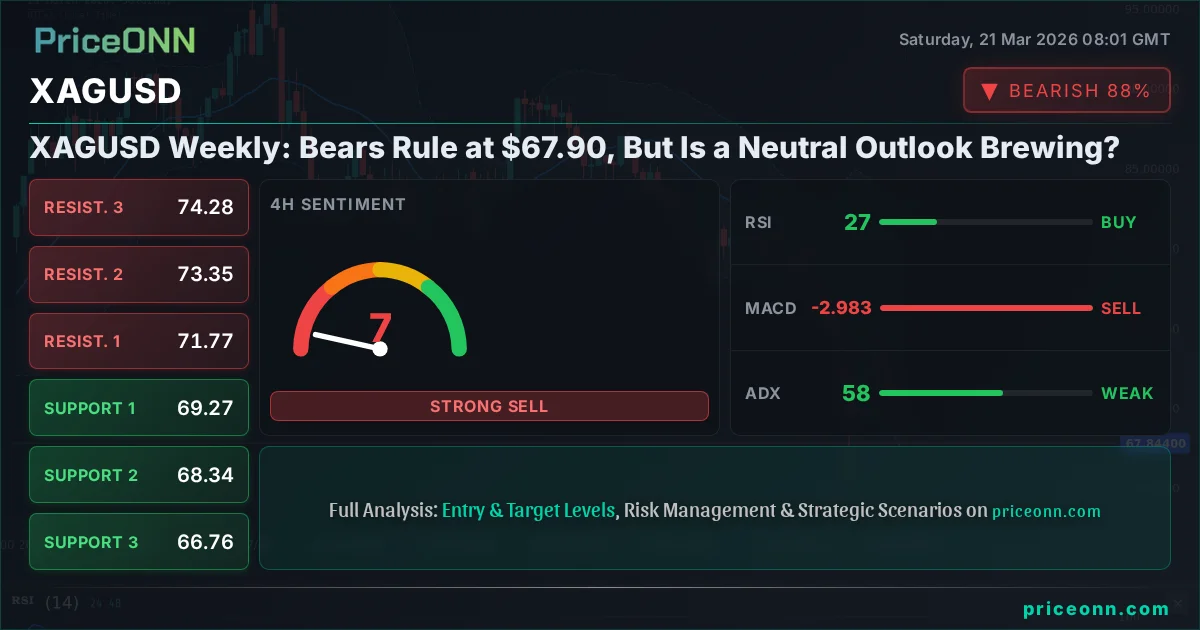
XAGUSD Weekly: Bears Rule at $67.90, But Is a Neutral Outlook Brewing?
Silver's volatile run continues as bears press their advantage below $70. With XAGUSD at $67.90, we analyze the technical landscape and key levels for the week ahead.
XAGUSD Weekly: Bears Rule at $67.90, But Is a Neutral Outlook Brewing?
The financial markets have witnessed a dramatic downturn in precious metals this week, with silver (XAGUSD) taking a significant hit. Trading at $67.90, the white metal has seen its price plummet, driven by a confluence of factors including rising US yields and a strengthening dollar. This sharp decline has put bears firmly in control, but as we look towards the close of the week, the technical indicators present a complex picture, hinting at a potential shift towards a neutral stance. This deep dive will dissect the recent price action, explore the underlying market drivers, and analyze the critical levels to watch as we navigate the evolving landscape for silver.
- XAGUSD is trading at $67.90, reflecting a significant weekly decline driven by bearish sentiment.
- Critical support sits at $67.33 on the 1H chart, a level that if broken, could accelerate the downtrend towards $65.40.
- The ADX indicator shows a strong downtrend (ADX 57.74 on 4H), but RSI readings in oversold territory across multiple timeframes signal potential for a bounce.
- Correlation with a strengthening DXY (currently 99.39) and falling S&P 500 (at 6536.05) suggests a risk-off environment, typically negative for silver but also highlighting its safe-haven appeal if sentiment shifts.
- A neutral outlook is emerging as conflicting signals appear on shorter timeframes, suggesting consolidation might precede the next major move.
The narrative surrounding silver this past week has been overwhelmingly bearish. The precious metal has experienced a sharp and decisive fall from its recent highs, a move that has not only captured headlines but also wiped billions off the value of mining stocks, as reported by PriceONN's market news. This sell-off, with XAGUSD currently trading at $67.90, has pushed key technical indicators into oversold territory, prompting a critical question: are we witnessing the capitulation phase, or is this the prelude to a potential stabilization? The sheer speed and magnitude of the decline, especially the 6.67% daily drop, warrants a closer examination of the forces at play and what they signify for the immediate future of silver prices.
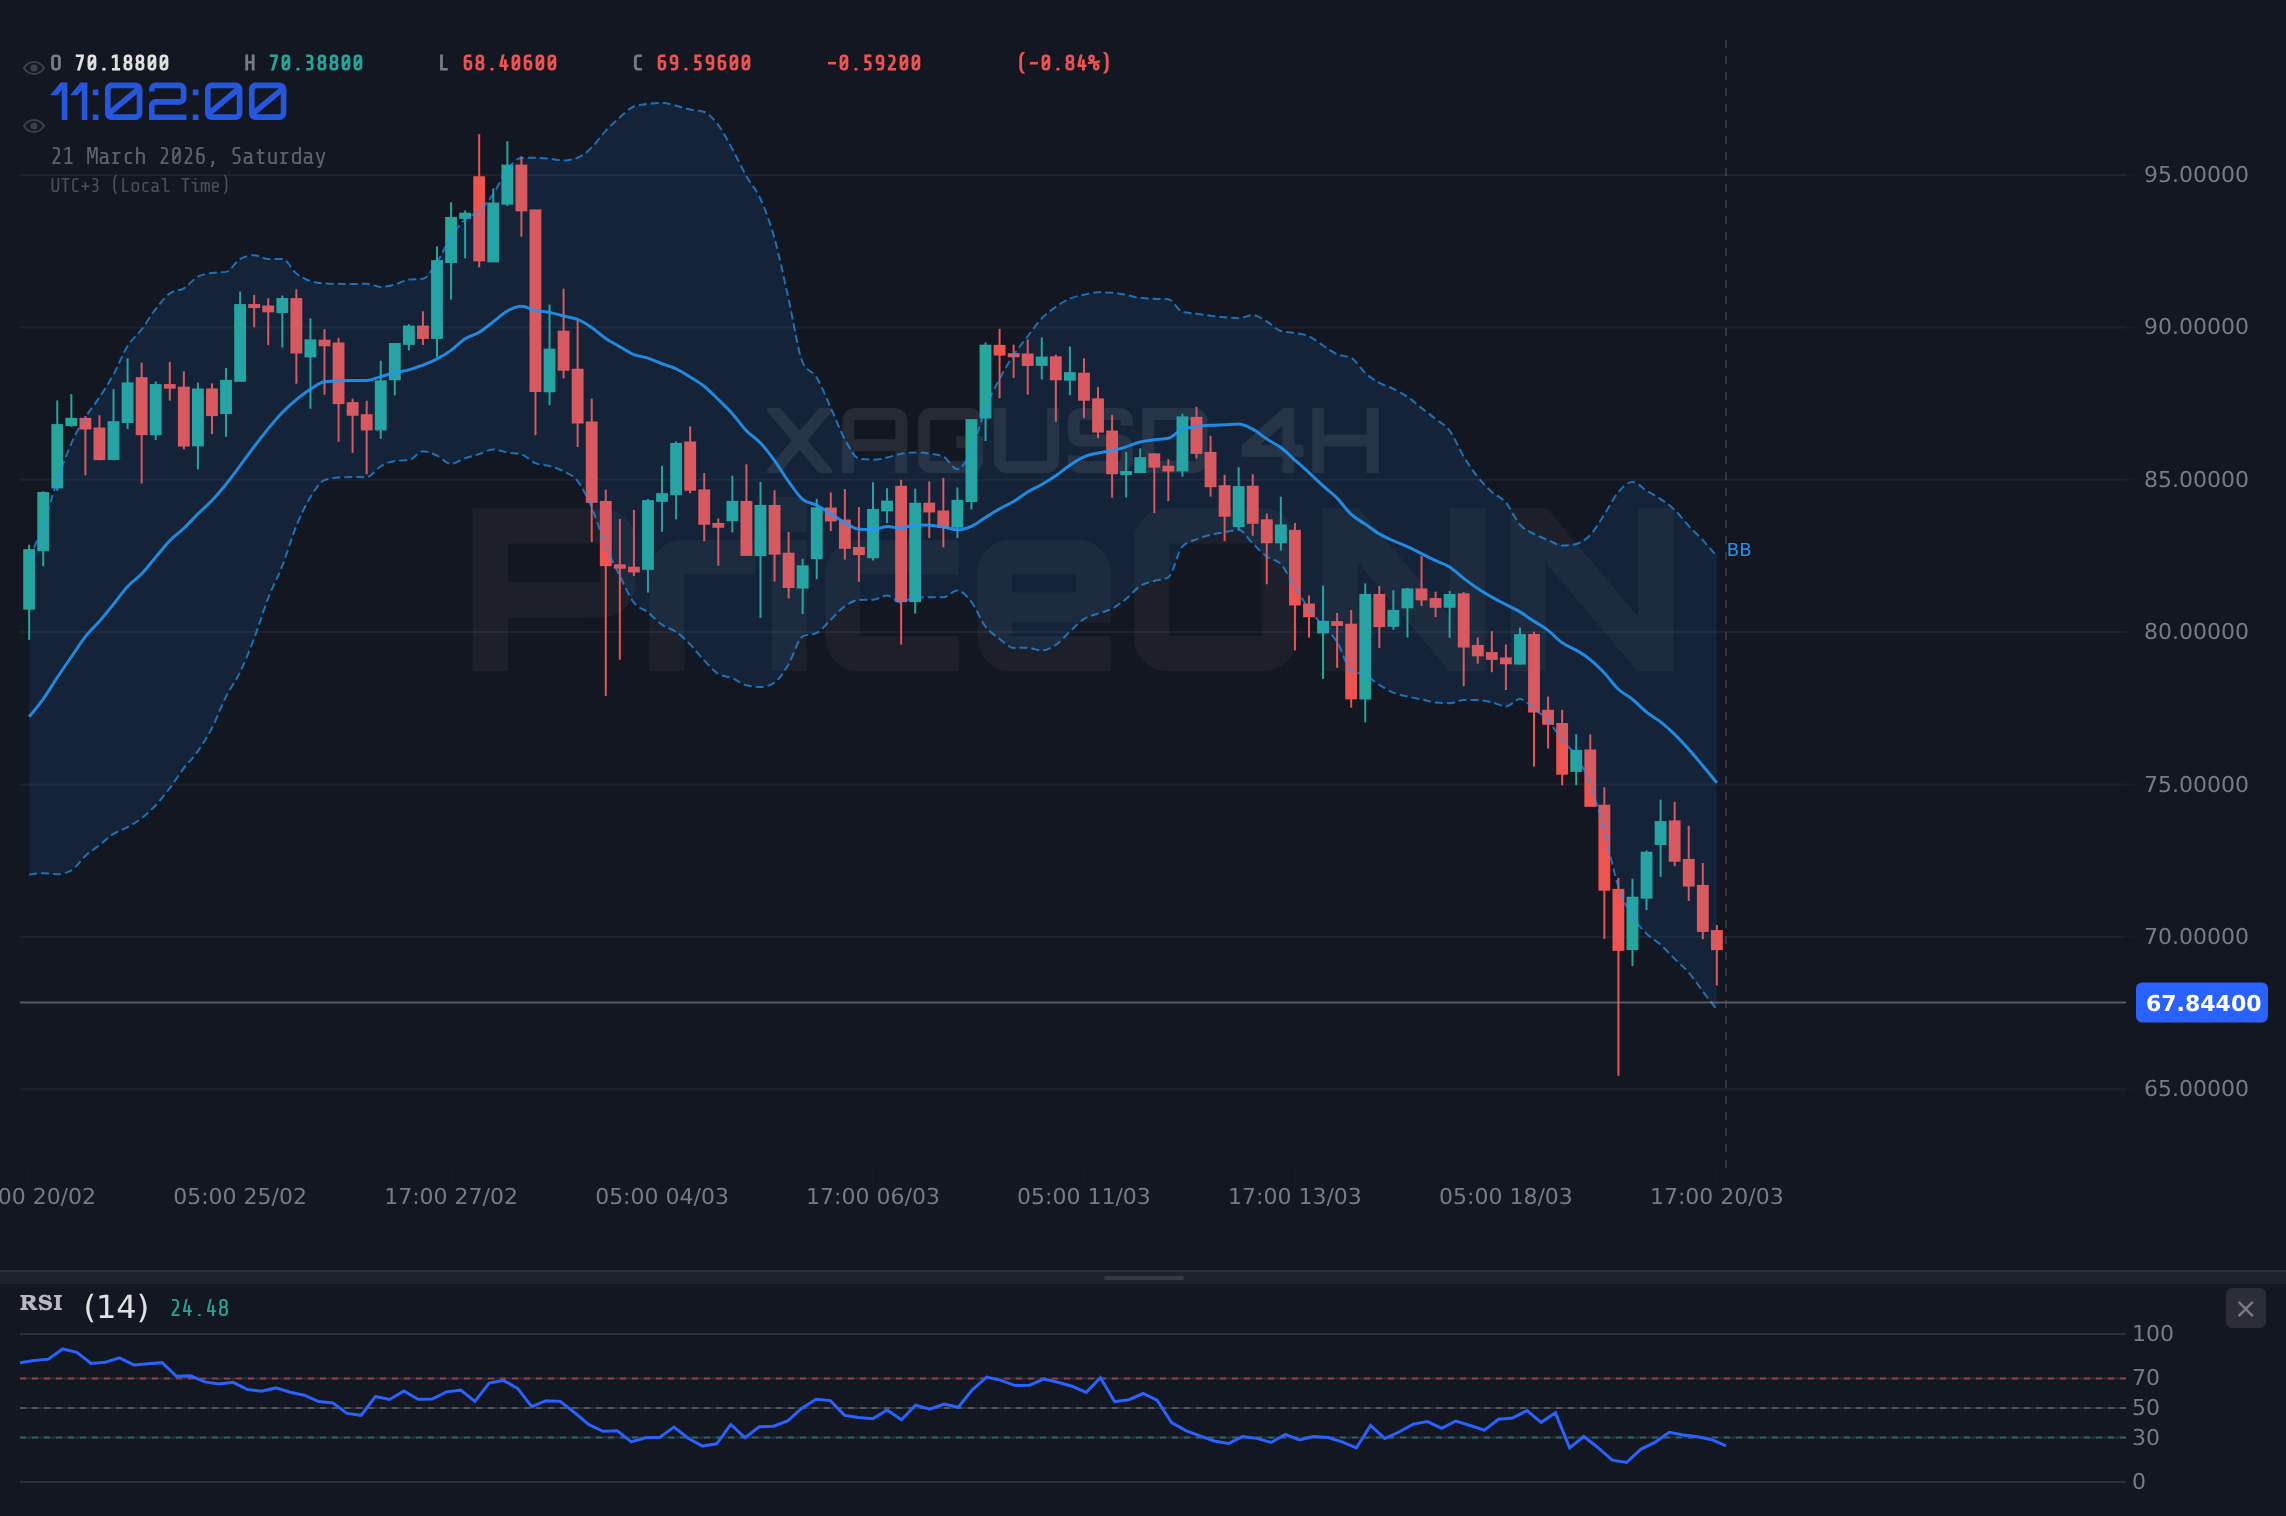
This past week has been brutal for silver investors. The price action has been characterized by a relentless downward trend, with XAGUSD falling sharply to $67.90. News reports highlighted a significant tumble, with gold, silver, and copper prices experiencing a significant decline, impacting major mining stocks. The 4H chart paints a stark picture: a very strong downtrend with an ADX reading of 62.9 indicates that the momentum behind this move is substantial. The RSI at 19.17 on the same timeframe is deeply oversold, a condition that historically suggests a potential for a reversal. However, the prevailing market sentiment, fueled by geopolitical tensions and rising US yields, has been overpowering these technical signals. The question on many traders' minds is whether this extreme oversold condition will finally force a pause or even a reversal in the aggressive selling pressure.
The correlation between silver and the broader macroeconomic environment has been particularly evident this week. The US Dollar Index (DXY) has shown strength, trading around 99.39, which typically exerts downward pressure on dollar-denominated commodities like silver. Simultaneously, major stock indices such as the S&P 500, currently at 6536.05, and the Nasdaq 100 at 23992.13, have experienced significant declines. This risk-off sentiment often leads investors to shed riskier assets and seek the perceived safety of the US dollar, further exacerbating the pressure on silver. However, the inverse relationship isn't always straightforward; sometimes, during extreme geopolitical uncertainty, silver can act as a safe haven itself. The current environment, marked by escalating Middle East tensions and their impact on energy prices, creates a complex interplay of forces that are challenging traditional correlations.
The Case for the Bears: A Downward Spiral?
The bearish case for XAGUSD is compelling, supported by a trifecta of technical indicators and a challenging macroeconomic backdrop. On the 1-hour timeframe, the trend is overwhelmingly downward with 98% strength, and the ADX at 36.09 reinforces the conviction behind the move. The MACD is firmly in negative territory, below its signal line, indicating sustained selling pressure. Bollinger Bands are showing the price trading below the lower band on the 1H and 1D charts, a sign of extreme bearishness that, while suggesting oversold conditions, also points to a potential for further downside if this momentum continues unabated. The immediate support levels identified at $67.33, $66.59, and $65.40 on the 1H chart are now in focus. A decisive break below $67.33 could trigger further liquidation, potentially accelerating the descent towards the $65.40 mark. The 4-hour chart paints an even starker picture, with an ADX of 62.9 indicating a very strong downtrend, and the RSI at 27.22 deep in oversold territory, yet still failing to stem the tide of selling.
From a daily perspective, the trend might be classified as neutral with 50% strength, but the technical signals overwhelmingly lean towards caution. The RSI at 29.58, while oversold, has not yet shown a clear reversal pattern. The MACD continues to print negative momentum, and the price is trading below the lower Bollinger Band, a bearish signal that historically can precede further declines. The support levels on the daily chart at $66.58, $60.41, and $55.38 are significantly lower, suggesting substantial room for further price erosion if the bearish momentum is sustained. The general signal across all timeframes, with the exception of some shorter-term indicators struggling to maintain their bearish conviction, is a strong 'SELL'. This aligns with the broader market narrative where rising interest rate expectations and geopolitical risks are diminishing the appeal of non-yielding assets like silver.
Furthermore, the recent news flow has amplified the bearish sentiment. Reports indicate that gold, silver, and copper prices have tumbled this week, with billions wiped off mining stocks. Specifically, an article on March 21 highlighted that "Gold Tumbles Below $4,500 as Rising US Yields Dim Safe-Haven Appeal," and a similar narrative is playing out for silver. The PriceONN market news from March 21 also noted, "Why Did Silver Plunge Over 6% This Week? Key Levels Tested Below $70." This indicates that the move below key psychological levels, such as $70, has been a significant event, likely triggering stop-loss orders and further accelerating the downward price action. The ongoing Middle East conflict, while typically a driver for safe-haven assets, seems to be overshadowed by inflation concerns and central bank hawkishness, creating a challenging environment for silver.
The Counter-Argument: Signs of Stabilization?
Despite the overwhelming bearish technicals and the negative macroeconomic sentiment, there are glimmers of hope and potential stabilization for XAGUSD. The 1-hour RSI is sitting at 28.95, deep in oversold territory, and has been for some time. Similarly, on the 4-hour chart, the RSI is at 19.17, and on the daily chart, it's at 29.58. These readings, while not immediate buy signals, indicate that the selling pressure may be exhausting itself. Historically, prolonged periods in the oversold zone can precede significant bounces. The Stochastic Oscillator on the 1-hour chart shows %K at 13.36 and %D at 13.89, also deeply oversold and potentially poised for a crossover that could signal a short-term upward correction. While the ADX remains high, suggesting a strong trend, the RSI's persistent oversold condition cannot be ignored indefinitely.
On the 1-hour chart for EURUSD, which often moves inversely to the dollar and can influence silver, the signals are mixed but lean towards a potential stabilization. While the 1D trend is bearish, the 1H trend is showing 87% strength for 'BUY', with RSI at 53.72 and Stochastic %K above %D. This suggests that while the broader trend for the pair might be down, there's some buying pressure emerging on shorter timeframes. If the US dollar were to pause its ascent or even pull back slightly, it could provide some much-needed relief for silver. The DXY itself, while strong, is showing some conflicting signals on its 1H chart, with a 'BUY' signal but RSI at 56.78 and Stochastic showing a dip. This suggests that the dollar's relentless march might also be approaching a point where a short-term consolidation could occur.
Furthermore, the sheer velocity of the price decline might be creating an unsustainable situation. When prices fall too far, too fast, especially without significant fundamental catalysts shifting dramatically day-to-day, a technical bounce becomes more probable. The fact that major mining stocks have seen billions wiped off their value, as mentioned in the PriceONN news, indicates extreme selling pressure. Often, such capitulation events can mark bottoms, even if the underlying trend remains challenging. The March 21 PriceONN news, "Why Did Silver Plunge Over 6% This Week? Key Levels Tested Below $70," and the subsequent recovery attempts, even if minor, show that $67.90 might be a level where some buyers are starting to cautiously enter the market, looking for value after the sharp sell-off.
Navigating the Levels: What to Watch
For traders and investors, the key to navigating this volatile market lies in closely monitoring specific price levels and technical indicators. On the 1-hour chart, the immediate support is found at $67.33, followed by $66.59 and $65.40. A break below $67.33 would confirm the continuation of the bearish trend, targeting $66.59 and potentially $65.40. Conversely, resistance levels to watch on the upside are $69.26, $70.45, and $71.18. A sustained move above $69.26 could signal a short-term recovery, with $70.45 acting as a more significant hurdle.
The 4-hour chart presents a more significant battleground. Support levels are situated at $69.27, $68.34, and $66.76. The $69.27 level is crucial; holding above it could provide a base for a potential rebound, while a break below it would reinforce the bearish outlook, targeting $68.34 and potentially $66.76. Resistance is seen at $71.77, $73.35, and $74.28. A move above $71.77 would be the first sign of a significant bullish shift, needing to break through subsequent resistance levels to confirm a trend change.
On the daily chart, the levels are more extended. Support lies at $66.58, $60.41, and $55.38. These are longer-term levels, and a breach of $66.58 would signal a deeper decline. Resistance is overhead at $77.79, $82.82, and $89. These are significant targets that would need to be overcome for a sustained bullish reversal to take hold. The current price of $67.90 places XAGUSD precariously close to the more immediate daily support, making the $66.58 level a critical watchpoint for the coming week.
Bearish Scenario: Continued Downside Pressure
70% ProbabilityNeutral Scenario: Consolidation and Range-Bound Trading
25% ProbabilityBullish Scenario: Short-Term Bounce
5% ProbabilityThe Verdict: Caution Remains Key
Analyzing the data, the immediate picture for XAGUSD is one of significant bearish pressure, but with a growing potential for stabilization. The strong downtrend signals across multiple timeframes, coupled with the macroeconomic headwinds of a strong dollar and rising yields, suggest that the path of least resistance is still to the downside. The ADX readings are particularly concerning for bulls, indicating that the current trend has substantial momentum. However, the persistent oversold conditions on RSI and Stochastic oscillators across the 1H, 4H, and even the daily charts cannot be dismissed. These technical readings suggest that the market may be oversold to a degree that could lead to a short-term bounce or at least a period of consolidation.
The PriceONN market news from March 21, "Why Did Silver Plunge Over 6% This Week? Key Levels Tested Below $70," and the subsequent price action around $67.90, indicate that this level is crucial. While bears have dominated, the market is now at a point where a technical correction is plausible, especially if there are any shifts in geopolitical risk sentiment or a slight pause in the dollar's ascent. The key will be whether XAGUSD can hold the $67.33 support level. A failure to do so would likely see the downtrend continue with targets at $66.59 and $65.40. Conversely, a hold at $67.33, coupled with some positive divergence on shorter timeframes, could set the stage for a move back towards the $69.26 resistance, and potentially higher if momentum builds.
For now, the most probable scenario appears to be a period of consolidation or range-bound trading as the market digests the recent sell-off and awaits clearer direction. The strong bearish signals from indicators like ADX suggest that any bounce might be met with selling pressure. Therefore, caution is the prevailing theme. Traders should look for confirmation before committing to positions, paying close attention to the $67.33 support and the $69.26 resistance. The neutral scenario, with a probability estimate of 25%, seems the most likely outcome in the short term, characterized by choppy price action between these key levels. Only a decisive break above resistance or below support will signal the next significant directional move.
Frequently Asked Questions: XAGUSD Analysis
What happens if XAGUSD breaks below the $67.33 support level this week?
If XAGUSD breaks decisively below the $67.33 support on the 1-hour chart, it would invalidate any short-term bullish hopes and likely accelerate the downtrend. This would trigger further selling, with immediate targets at $66.59 and potentially extending towards $65.40 as bears regain full control.
Should I buy XAGUSD at current levels of $67.90 given the oversold RSI?
Buying solely based on an oversold RSI at $67.90 carries significant risk due to the strong bearish trend (ADX 57.74). While a short-term bounce is possible (5% probability), confirmation such as holding $67.33 support and bullish divergence is needed. A safer approach would be to wait for a clear reversal signal or a break above resistance.
Is the RSI at 19.17 on the 4H chart a buy signal for XAGUSD?
An RSI of 19.17 is deeply oversold, indicating extreme selling pressure. While it suggests XAGUSD is technically due for a bounce, it's not an immediate buy signal on its own, especially with a very strong downtrend (ADX 62.9). This level highlights potential for a reversal, but confirmation is crucial before entering a long position.
How will the strengthening DXY at 99.39 affect XAGUSD this week?
The strengthening DXY at 99.39 typically exerts downward pressure on silver, as it makes the dollar more attractive relative to commodities. This correlation suggests that continued dollar strength could hinder any attempts by XAGUSD to recover, reinforcing the bearish outlook unless other factors, like geopolitical risk, significantly alter market sentiment.
Technical Outlook Summary
| Indicator | Value | Signal | Interpretation |
|---|---|---|---|
| RSI (14) | 29.58 | Oversold | Deeply oversold on daily, potential for bounce but trend is down. |
| MACD Histogram | -15.20 | Negative | Sustained selling pressure, momentum remains with bears. |
| Stochastic | K: 8.5, D: 13.09 | Oversold | Extreme oversold conditions suggest potential exhaustion, but trend is key. |
| ADX | 19.51 | Weak Trend | Daily trend strength is low, but 1H/4H show strong directional moves. |
| Bollinger Bands | Lower Band Breach | Bearish | Price below lower band indicates strong selling pressure, potential for mean reversion. |
Key Levels
Support Levels
Resistance Levels
Track markets in real-time
AI-powered analysis, technical indicators and real-time price data.
Join Our Telegram Channel
Breaking market news, AI analysis and trading signals instantly.
Join Channel