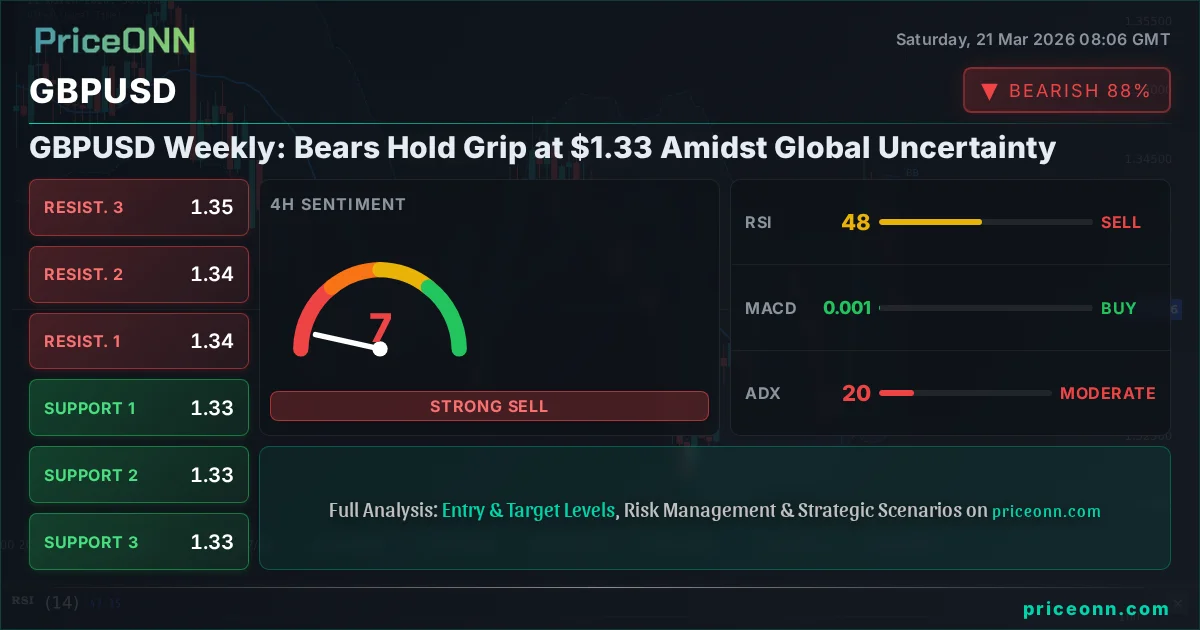
GBPUSD Weekly: Bears Hold Grip at $1.33 Amidst Global Uncertainty
GBP/USD struggles near $1.33 as mixed signals emerge. Technicals show bearish pressure, while upcoming events add volatility.
The British Pound Sterling (GBP) finds itself locked in a fierce battle against the US Dollar (USD) around the critical $1.33 level as the week draws to a close. This pivotal juncture has become a battleground for bulls and bears, with conflicting technical signals and a swirling vortex of macroeconomic and geopolitical undercurrents making any directional conviction a challenging proposition. Having seen significant volatility throughout the week, the pair's inability to decisively break through key resistance or capitulate at support levels paints a picture of market indecision, a sentiment amplified by the broader global economic landscape.
- GBP/USD is trading around $1.33, exhibiting bearish pressure with an RSI at 42.55 on the 1-hour chart.
- Key support is identified at $1.32863, while resistance looms at $1.33721, levels tested throughout the past week.
- The MACD histogram indicates fading bullish momentum, suggesting caution for short-term upside.
- The pair's correlation with the DXY, currently at 99.39, suggests dollar strength continues to be a headwind for Sterling.
Last week's price action for GBPUSD, closing near $1.33, has set the stage for continued uncertainty as we move into the next trading period. The pair's journey has been one of oscillation, failing to establish a clear trend amidst a backdrop of mixed central bank signals and persistent global economic headwinds. While the daily chart hints at a broader bearish trend with an ADX of 29.92, the 1-hour timeframe shows a neutral trend with a power of 50%, highlighting the short-term chop that traders have been navigating. This divergence in trend strength across different timeframes underscores the complex interplay of forces shaping GBPUSD's trajectory, making a clear-cut strategy elusive for many market participants.
The recent news cycle has been dominated by geopolitical tensions, particularly the escalating conflict in the Middle East. This has fueled a significant surge in oil prices, with Brent Crude reaching $112.79 and WTI at $98.50. Such price shocks have a ripple effect across global markets, impacting inflation expectations and central bank policy considerations. For the UK economy, this translates into renewed inflationary pressures, potentially complicating the Bank of England's (BoE) efforts to manage monetary policy. The market's reaction to these energy price surges has been varied, but the overarching theme is increased uncertainty, which often leads to risk-off sentiment, typically benefiting safe-haven assets like the US Dollar and putting pressure on riskier currencies or those more exposed to global trade dynamics, such as the Pound Sterling.
The US Dollar Index (DXY) has shown resilience, currently trading at 99.39, reflecting a cautious global sentiment and a 'risk-off' environment. This strength in the dollar acts as a significant headwind for GBPUSD. Historically, a rising DXY often correlates with a falling GBPUSD, as the dollar's appeal as a safe-haven asset increases during times of geopolitical stress or economic uncertainty. The current DXY reading of 99.39, with its daily trend showing a strong upward bias (92% strength), suggests that dollar demand remains robust. This dynamic implies that any upward movement in GBPUSD may face immediate selling pressure as the greenback's strength pulls capital towards it, making it an uphill battle for Sterling bulls to gain significant ground.
Looking at the technical indicators on the 1-hour timeframe for GBPUSD, the picture is one of caution. The Relative Strength Index (RSI) at 42.55 indicates that the pair is in neutral territory but leaning towards bearish momentum, suggesting that sellers have a slight edge. The Moving Average Convergence Divergence (MACD) histogram is negative and below the signal line, further reinforcing the bearish sentiment in the short term. While the Stochastic Oscillator shows %K (29.29) crossing above %D (15.14), hinting at a potential short-term bounce, it's emanating from oversold levels and needs confirmation. The Average Directional Index (ADX) at 27.93 signifies a strong downtrend, indicating that the current bearish momentum has substance. This confluence of indicators on the hourly chart points towards potential downside risk, with sellers looking to press their advantage.
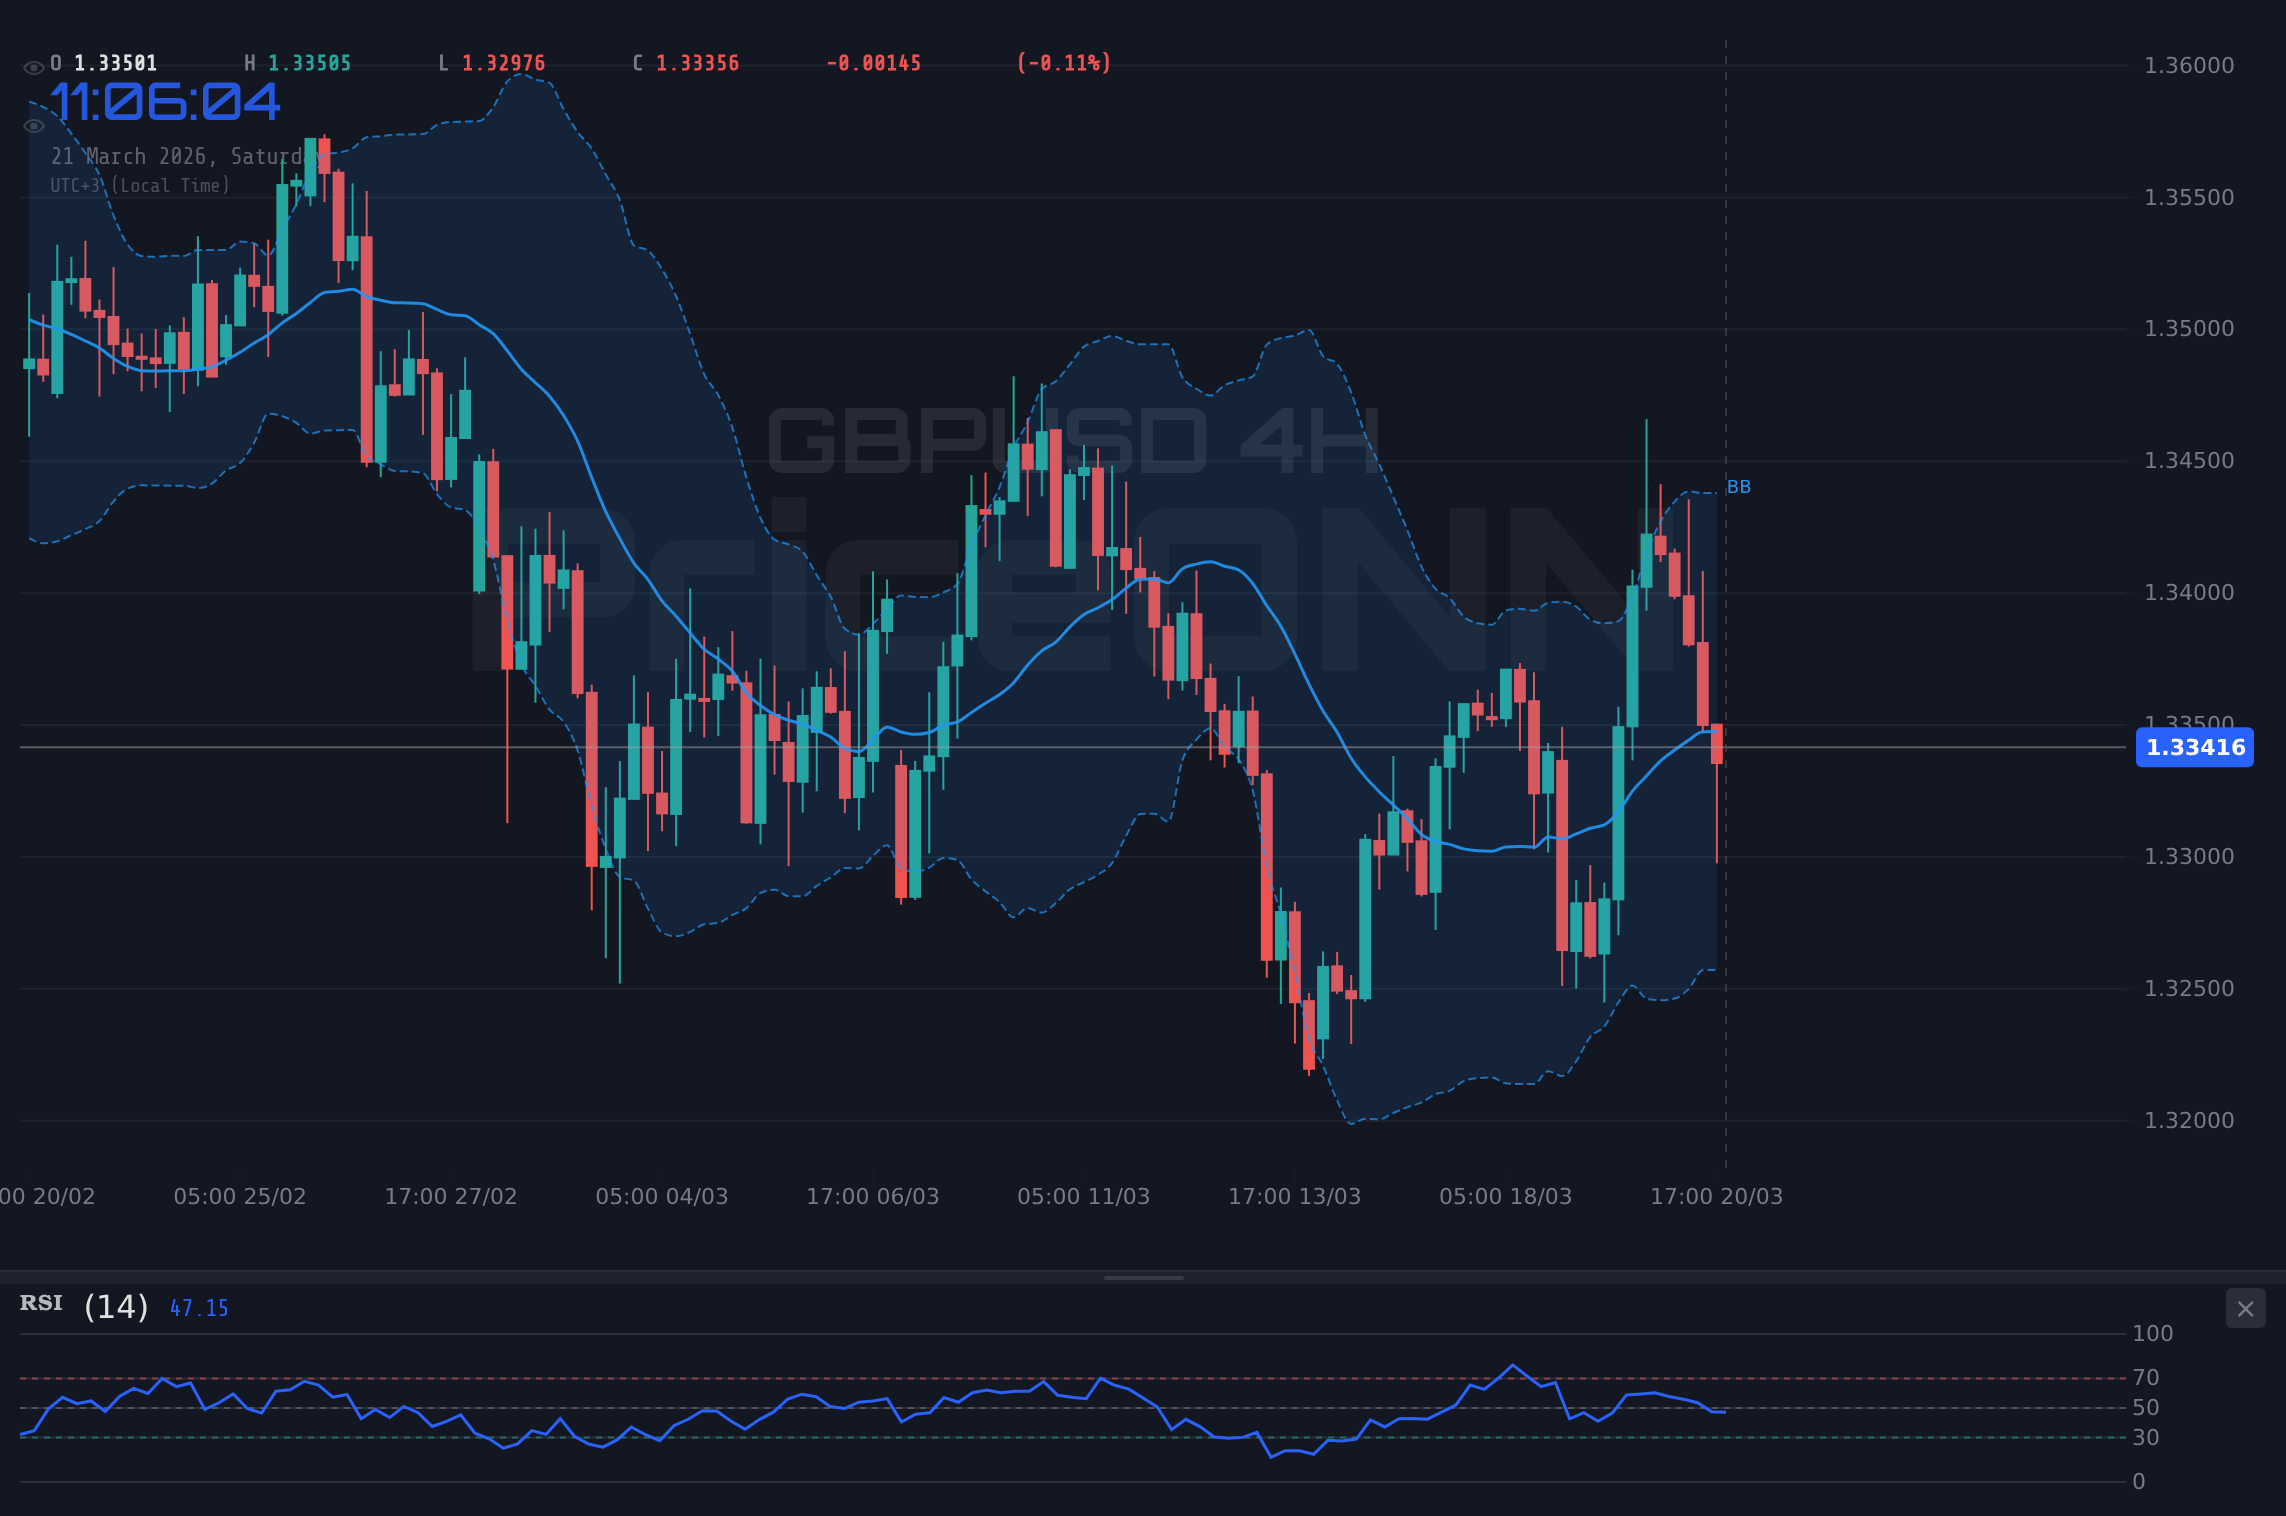
On the 4-hour chart, the technical landscape for GBPUSD offers a slightly different, yet still cautious, perspective. The RSI at 48.39 remains in neutral territory, inching towards oversold conditions, which could signal a pause or a minor reversal in the near term. The MACD, however, shows positive momentum with the histogram above the signal line, a divergence from the 1-hour timeframe, suggesting that the bearish pressure might be easing on this intermediate timeframe. Bollinger Bands are positioned above the middle band, indicating a slight upward bias in this timeframe. Yet, the Stochastic Oscillator's %K (50) crossing below %D (70.78) from overbought territory presents a bearish signal, suggesting a potential pullback. The ADX at 20.06 points to a moderately trending market, but the overall trend strength is not as pronounced as on the daily chart, indicating a period of consolidation or indecision.
The daily timeframe for GBPUSD presents the most compelling bearish narrative, albeit with caveats. The RSI at 45.27 sits comfortably in neutral territory, showing room for further downside before reaching oversold conditions. The MACD, while showing positive momentum with the histogram above the signal line, is in a critical position near the zero line, suggesting that its bullish signal might be weakening or about to reverse. The Bollinger Bands are trading below the middle band, confirming the bearish lean. Crucially, the ADX at 29.92 indicates a strong downtrend, a significant signal that the bears have been in control over the longer term. This longer-term perspective suggests that any short-term rallies might be opportunities for sellers to re-enter the market at better prices, aligning with the broader trend.
The economic calendar for the past week provided a mixed bag of data that contributed to the indecision surrounding GBPUSD. While the UK's inflation data showed some signs of cooling, it wasn't enough to significantly alter the Bank of England's (BoE) cautious stance. The recent PriceONN market news highlighted a BoE 'hawkish surprise' on March 19th, which briefly propelled GBP/USD higher. However, this momentum was short-lived as dollar strength and other macroeconomic factors reasserted themselves. The upcoming week holds key data releases that could sway market sentiment, including crucial employment figures from the UK and inflation reports from the US. Traders will be closely watching these events for any signs that could break the current stalemate.
From a fundamental perspective, the divergence in monetary policy expectations between the Bank of England and the US Federal Reserve continues to play a significant role. While the BoE has shown a willingness to consider rate cuts, albeit cautiously, the Fed has maintained a more hawkish stance, prioritizing the fight against inflation. This policy divergence, coupled with the current geopolitical risks that favor the US dollar, creates a challenging environment for Sterling. The market is pricing in a certain probability for future interest rate movements, and any shifts in these expectations, driven by economic data or central bank commentary, can lead to sharp moves in GBPUSD. The current pricing suggests that the market is expecting the Fed to remain on hold for longer than the BoE, a factor that inherently supports the dollar.
The strength of the US dollar is a recurring theme and a primary driver for GBPUSD's recent performance. With the DXY at 99.39, indicating a solid upward trend, the greenback's strength is a significant barrier to any substantial recovery for the Pound. This is not merely a correlation; it's a reflection of global capital flows seeking safety amidst geopolitical uncertainty and higher interest rate differentials favoring the US. The recent tumble in gold and other commodities, as reported by PriceONN, further underscores this risk-off sentiment, which typically propels the dollar higher. Therefore, any analysis of GBPUSD must inherently consider the broader dollar index movement as a key determinant of Sterling's fate.
Considering the current technical setup and fundamental backdrop, a bearish outlook appears more probable for GBPUSD in the short to medium term, though the path is unlikely to be linear. The daily chart's strong downtrend (ADX 29.92) and the consistent pressure around the $1.33 level suggest that the path of least resistance is lower. Support levels at $1.33149, $1.33048, and $1.32863 are critical watch points. A decisive break below $1.32863 would likely trigger further selling, targeting deeper support levels. However, the market is never purely one-sided. The potential for a 'hawkish surprise' from the BoE or a significant shift in US economic data could quickly alter the narrative, making a neutral scenario or even a bullish reversal a possibility, albeit one that currently appears less likely given the prevailing conditions.
The past week saw GBP/USD trading within a tight range, with significant action around the $1.33 mark. Price action on Tuesday and Wednesday showed attempts to push higher, briefly touching resistance levels around $1.33620, but these rallies were met with selling pressure, pushing the pair back down. The UK jobs report, which was a key event mentioned in PriceONN news, did not provide the catalyst for a sustained move. On Thursday, the pair tested support levels near $1.33048 before finding some bids, showcasing the tight range-bound trading. The failure to break decisively above resistance at $1.33721 and the subsequent retreat indicate a lack of conviction from buyers. This price action reinforces the notion that $1.33 remains a critical psychological and technical level, with a clear break needed to establish a new trend.
The implications of the current technical readings are significant for traders. The bearish signals on the 1-hour and daily charts, coupled with the strong ADX values, suggest that short-term traders might look for opportunities to sell into rallies. The RSI levels, while not deeply oversold, indicate a lack of strong buying interest. The Stochastic Oscillator's readings, particularly on the hourly chart, suggest potential for short-term bounces, but these are likely to be capped by the overhead resistance and the prevailing bearish trend. The key is to watch for confirmation: a sustained break below $1.33 support or a decisive move above $1.33721 resistance would be needed to signal a clear direction. Until then, expect choppy trading with potential for range-bound strategies.
The correlation with other markets is also worth noting. The sharp decline in gold prices to below $4,500, as reported by PriceONN, is a classic sign of risk aversion and a strengthening dollar, both of which are bearish for GBPUSD. Similarly, the broader equity markets, including SP500 and Nasdaq, have seen significant drops, with SP500 closing at 6536.05 and Nasdaq at 23992.13. This risk-off sentiment typically benefits the USD, further pressuring pairs like GBPUSD. The energy shock, with Brent Crude rallying, adds to inflationary concerns, which could complicate central bank decisions but currently seems to be overshadowed by safe-haven demand for the dollar.
Looking ahead, the economic calendar is packed with potentially market-moving events. The upcoming UK employment data will be crucial for assessing the health of the British economy and its impact on BoE policy. Simultaneously, US inflation reports will provide further clues on the Fed's future rate path. Any deviation from expectations in these reports could lead to significant volatility in GBPUSD. The $1.33 level remains the focal point. A break below it opens the door to further declines, while a strong push above $1.33721 could signal a potential short-covering rally. Traders should exercise caution and employ robust risk management strategies, as the confluence of technical signals and fundamental uncertainties creates a volatile trading environment.
The market sentiment analysis suggests a cautious approach is warranted. While some indicators hint at potential short-term bounces, the overarching technical and fundamental picture leans bearish. The strong downtrend on the daily chart, coupled with dollar strength and geopolitical risks, creates a challenging environment for Sterling. The $1.33 level is a key battleground; a sustained break below it would likely confirm further downside, targeting support levels below. Conversely, a decisive move above the $1.33721 resistance, supported by strong fundamental catalysts, could signal a reversal. For now, patience and risk management are paramount.
The interplay between technical levels and fundamental drivers is particularly evident in GBPUSD's current trading range. The failure to sustain rallies above $1.33721 resistance, despite brief positive news from the BoE, highlights the strength of the bearish sentiment and the dollar's dominance. Conversely, the support at $1.33048 has held, preventing a steeper decline, but without strong buying conviction. This suggests a market awaiting a clearer catalyst. The ADX at 29.92 on the daily chart clearly indicates a strong trend is in play, and until this trend is decisively broken, any counter-trend moves should be treated with extreme caution. The current price action around $1.33 is a testament to the tug-of-war between prevailing bearish forces and the market's anticipation of future economic shifts.
As we dissect the GBPUSD's performance, it's crucial to acknowledge the role of volatility. The recent surge in oil prices and ongoing geopolitical tensions have injected a significant degree of uncertainty into financial markets. This heightened volatility often presents opportunities for well-prepared traders who can navigate the choppy waters. The key lies in identifying clear setups, managing risk effectively, and avoiding emotional decisions. The $1.33 level is more than just a price point; it represents a psychological threshold where many trading decisions are being made. Understanding the forces that will ultimately break this stalemate - be it a shift in central bank policy, significant economic data, or a de-escalation of geopolitical risks - is paramount for success.
The current technical indicators provide a mixed but predominantly cautionary signal. On the hourly chart, RSI at 42.55 and a negative MACD histogram suggest bearish momentum. However, the Stochastic Oscillator shows potential for a short-term bounce. The 4-hour chart presents a more neutral picture with conflicting Stochastic signals. The daily chart, with its strong ADX of 29.92 and RSI below 50, clearly points to a bearish trend. This divergence across timeframes emphasizes the need for a nuanced approach. Traders should look for confluence of signals, particularly a break of key levels, before committing to a directional trade. The market is currently in a state of flux, and patience is a virtue that will likely be rewarded.
The ongoing narrative of US dollar strength, driven by geopolitical tensions and a hawkish Fed stance, continues to weigh heavily on GBPUSD. With the DXY at 99.39 and showing a strong upward trend, the greenback remains the favored safe-haven currency. This dynamic makes it challenging for Sterling to mount a sustained recovery, even in the face of potentially positive domestic data. The current price action around $1.33 reflects this struggle, with buyers unable to overcome the dollar's dominance and the prevailing bearish technical signals. Any significant shift in the global risk sentiment or central bank policy expectations would be needed to break this correlation and offer Sterling a chance to breathe.
The market participants are keenly aware of the critical levels surrounding GBPUSD. Support at $1.33048 and $1.32863 represents potential buying zones, where short-term traders might look to enter long positions, anticipating a bounce. However, a decisive break below $1.32863 could trigger significant stop-losses, leading to a rapid decline towards $1.32670 and below. On the upside, resistance at $1.33721 and $1.33900 are key hurdles. A sustained move above these levels, particularly on significant volume, could signal a shift in sentiment and open the door for a broader bullish correction. Until then, expect the $1.33 handle to remain a focal point of intense trading activity.
The recent tumble in gold and copper prices, alongside a broader sell-off in mining stocks, as reported by PriceONN, serves as a stark indicator of the prevailing risk-off sentiment in global markets. This sentiment typically favors the US dollar, creating a negative correlation for pairs like GBPUSD. The fact that these commodities are falling even as oil prices surge highlights a complex interplay of factors, possibly driven by inflation fears clashing with recessionary concerns. For GBPUSD, this reinforces the bearish bias, as global uncertainty often leads investors to seek the perceived safety of the dollar, making it harder for Sterling to find consistent upward momentum.
The Bank of England's recent 'hawkish surprise,' as noted in PriceONN's news, briefly offered a glimmer of hope for Sterling bulls. However, the subsequent inability to sustain gains above $1.3380 suggests that the market's reaction was short-lived, overshadowed by the stronger dollar and broader risk aversion. This highlights the delicate balance of factors influencing GBPUSD. While domestic policy can provide a temporary boost, global macroeconomic forces and geopolitical risks often dictate the longer-term trend. The market is now looking towards upcoming data, particularly from the US, to provide a clearer direction, reinforcing the prevailing uncertainty around the pair's next significant move.
The technical analysis across multiple timeframes paints a picture of consolidation with a bearish undertone. The 1-hour chart shows potential for short-term bounces but is capped by bearish momentum indicators. The 4-hour chart offers mixed signals, indicating indecision. The daily chart, however, strongly suggests a bearish trend is in play, reinforced by a high ADX value. This suggests that while short-term fluctuations may occur, the longer-term trajectory favors a downward bias. Key levels to watch are $1.33048 for support and $1.33721 for resistance. A break of either level on significant volume would be required to signal a clear directional move. Until then, expect continued choppiness around the $1.33 handle.
The current market environment for GBPUSD is characterized by a delicate balance of opposing forces. Geopolitical tensions are driving safe-haven demand for the dollar, while domestic economic data and central bank policy expectations create conflicting signals for the Pound. Technically, the pair is trading in a critical range, with key support and resistance levels clearly defined. The bearish lean on longer timeframes suggests that any rallies might be short-lived, but the potential for short-term bounces cannot be entirely dismissed. Traders must remain vigilant, focusing on risk management and waiting for clear signals before committing to positions. The $1.33 level is not just a price; it's a battleground where the future direction of this pair will likely be decided.
The GBPUSD pair remains at a critical juncture, trading around $1.33. The prevailing bearish sentiment, supported by dollar strength and longer-term technical trends, suggests that downside risks are elevated. However, the potential for short-term bounces and the impact of upcoming economic data mean that caution is paramount. The key levels to watch are $1.33048 as immediate support and $1.33721 as resistance. A decisive break of either will likely dictate the next significant move. As we navigate this period of uncertainty, disciplined trading and a focus on risk management will be essential for success.
The global economic outlook remains clouded by geopolitical risks and inflationary pressures, creating a complex environment for currency markets. For GBPUSD, this translates into a challenging period of consolidation with a bearish bias. The $1.33 level represents a key battleground, and traders should exercise caution, focusing on risk management and waiting for clear directional signals. The market is poised for volatility as key economic data releases approach, and those who remain disciplined and patient are most likely to be rewarded.
Bearish Scenario: Downside Pressure Mounts
65% ProbabilityNeutral Scenario: Range-Bound Consolidation
25% ProbabilityBullish Scenario: Sterling Recovers
10% ProbabilityFrequently Asked Questions: GBPUSD Analysis
What happens if GBPUSD breaks below the $1.33048 support level?
A break below $1.33048 on GBPUSD would likely invalidate any short-term bullish sentiment and could trigger further downside. Invalidation would likely see price action targeting the next key support at $1.32863, potentially accelerating towards $1.32670 if selling pressure intensifies.
Should I buy GBPUSD at current levels around $1.33 given the RSI is at 42.55?
Buying GBPUSD solely based on the current RSI of 42.55 is not advisable, as it indicates bearish momentum. A low-probability bullish scenario (10%) would require a confirmed break above $1.33721 resistance. Until then, risk management is key, and waiting for clearer signals or a test of lower support levels like $1.33048 might offer better risk-reward.
Is the MACD histogram showing a bearish signal for GBPUSD trend analysis?
Yes, the MACD histogram on the 1-hour chart is negative and below the signal line, indicating bearish momentum. This aligns with the overall cautious sentiment and suggests that upside potential may be limited in the short term, reinforcing the bearish bias seen on longer timeframes.
How will upcoming UK employment data and US inflation reports affect GBPUSD this week?
Stronger-than-expected UK jobs data could provide temporary support for GBPUSD by boosting BoE rate cut expectations, while hotter US inflation could strengthen the DXY and pressure GBPUSD lower. Traders will be closely monitoring these releases for potential catalysts to break the current indecision around $1.33.
Track markets in real-time
AI-powered analysis, technical indicators and real-time price data.
Join Our Telegram Channel
Breaking market news, AI analysis and trading signals instantly.
Join Channel