USDJPY Trades $159.23: Neutral Week Ahead Amidst Divergent Signals
USDJPY hovers near $159.23. With mixed signals from indicators and a strong yen divergence, traders watch for a breakout catalyst. Analysis covers key levels and scenarios.
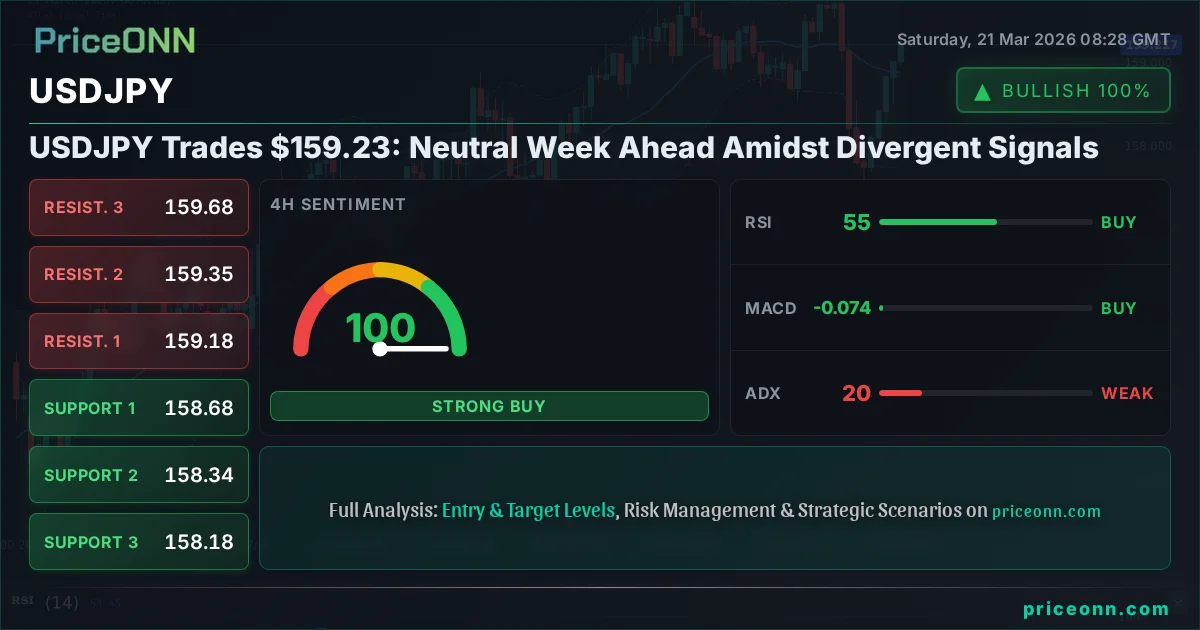
The USDJPY pair finds itself at a critical juncture, trading around the $159.23 mark as the market braces for a potentially neutral week. Last Friday saw a notable 0.93% gain, pushing the pair towards the higher end of its recent range, yet the underlying technical indicators present a complex tapestry of signals. This divergence suggests caution is warranted, as the market awaits a clearer directional cue from the interplay between the Bank of Japan's (BoJ) monetary policy stance and the Federal Reserve's (Fed) persistent hawkish undertones. The recent price action, characterized by volatility and a tendency to consolidate, implies that neither bulls nor bears have established decisive control, setting the stage for a week where key levels and upcoming economic data will be paramount in shaping the pair's trajectory.
- USDJPY is trading around $159.23, showing a neutral trend on the daily chart with a strong 1H bullish signal.
- Critical support is holding around $158.176, while resistance looms near $159.622 on the 1H timeframe.
- The ADX at 19.58 (4H) and 19.51 (1D) suggests a lack of strong trend, indicating choppy price action ahead.
- Divergent signals from RSI (59.49 daily vs. 63.52 hourly) and Stochastic (oversold hourly vs. overbought daily) highlight market indecision.
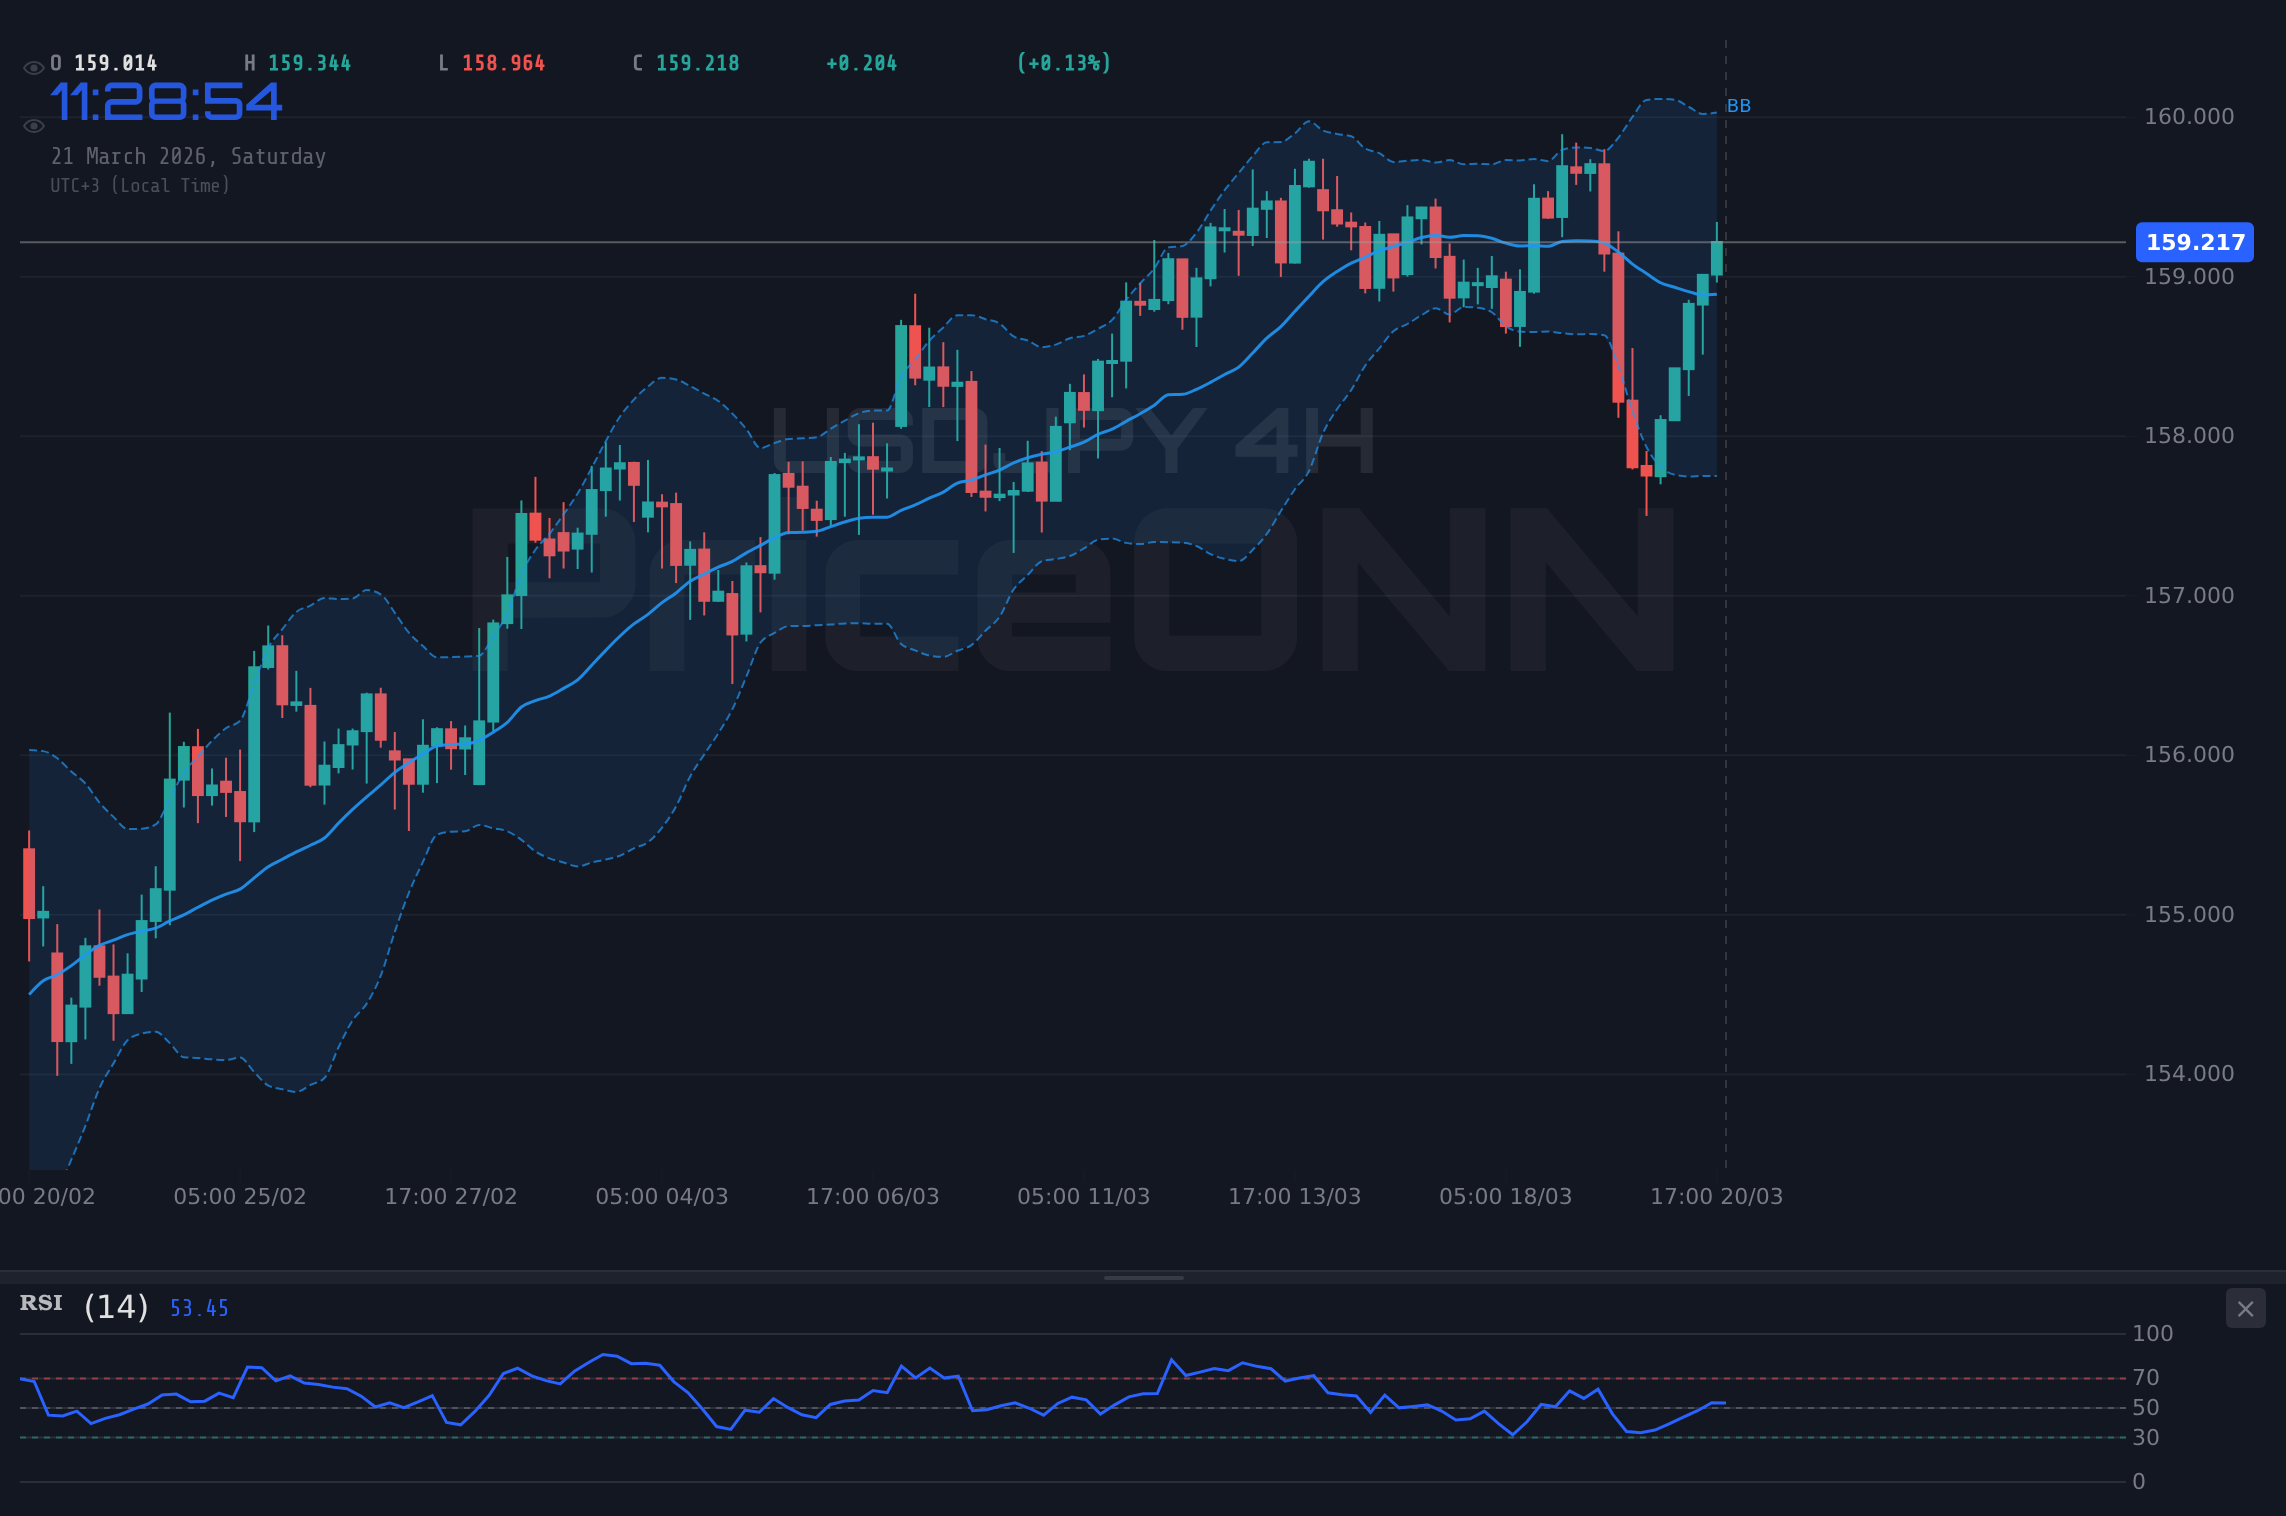
The past week was a rollercoaster for USDJPY, culminating in a significant upward move that saw the pair test levels not seen in recent memory. However, this surge was met with a degree of caution, especially considering the broader market context and the conflicting signals emanating from technical indicators. While the daily chart suggests a neutral trend with a power of 50%, the 1-hour timeframe flashes a strong bullish signal, indicating intraday strength that may not necessarily translate into a sustained uptrend. This dichotomy is crucial for traders to understand; it implies that short-term momentum might be positive, but the longer-term picture remains undecided, ripe for consolidation or a sharp reversal if key levels are breached. The 0.93% daily gain, while impressive, occurred within a broader context of yen weakness, a theme that has dominated currency markets for some time.
Looking at the 1-hour chart, the trend is decidedly bullish with a strength of 87%, supported by a General Signal leaning heavily towards 'BUY' (7 Buy, 1 Sell). This suggests that intraday traders might have found momentum on the upside. However, this bullishness is tempered when we examine the 4-hour and daily charts. The 4-hour timeframe shows a neutral trend (50% strength) with a 'BUY' signal (6 Buy, 2 Sell), while the daily chart also presents a neutral trend (50% strength) but with a predominantly 'BUY' signal (6 Buy, 1 Sell). This inconsistency across timeframes is a classic sign of a market in flux, where short-term trends can easily be reversed by shifts in sentiment or larger market forces. The current price of $159.23 sits precariously between the 1H resistance at $159.622 and support at $159.224, underscoring the need for a close watch on these immediate levels.
The underlying drivers for USDJPY's recent movements are multifaceted. On one hand, the Federal Reserve's hawkish stance, hinted at through recent statements and economic data, continues to underpin the US dollar. The prospect of higher-for-longer interest rates in the US, compared to the Bank of Japan's ultra-loose monetary policy, creates a significant interest rate differential that favors the dollar. This differential has been a primary catalyst for the yen's depreciation against the dollar over the past year. The Bank of Japan, despite some recent signals of a potential policy shift, has largely maintained its accommodative stance, leaving the yen vulnerable to further downside pressure, especially when global risk appetite is stable or increasing.
Conversely, the Japanese Yen's inherent safe-haven appeal cannot be entirely dismissed, particularly amidst rising geopolitical tensions. While the recent focus has been on the Middle East energy shock, any escalation or broadening of conflicts could theoretically drive flows back into the yen. However, the current market pricing seems to be prioritizing the interest rate differential over safe-haven demand, a sentiment reinforced by the strong upward momentum seen in USDJPY. The recent news of gold and silver prices tumbling below key psychological levels, partly due to rising US yields dimming safe-haven appeal, further supports the narrative that risk-off sentiment, if present, is not yet strong enough to significantly boost the yen.
Technically, the picture is equally mixed. On the 1-hour chart, RSI is at 63.52, suggesting a neutral-to-bullish leaning, while Stochastic K is at 88.06 and D at 93.24, indicating an overbought condition that could precede a pullback. The ADX at 29.64 points to a strong uptrend on this timeframe. Moving to the 4-hour chart, RSI sits at 54.99, still in neutral territory, but Stochastic shows a bearish signal (%K < %D), and ADX at 19.58 suggests a weaker trend. The daily chart presents a more consolidated view: RSI at 59.49 is approaching overbought territory, Stochastic is showing a bearish signal (%K < %D), and ADX at 22.03 indicates only a moderate trend. This divergence highlights a potential battleground where short-term bullish momentum faces longer-term headwinds and overbought conditions.
The Bull's Roadmap: Navigating Towards Higher Ground
For the bulls to regain firm control of USDJPY, a decisive break and sustained hold above the immediate resistance levels are essential. The 1-hour chart shows resistance at $159.622 and $159.885. A clear breach of $159.885, ideally on increased volume, would signal a potential continuation of the intraday bullish momentum. If this breakout is confirmed, the next significant resistance level to watch would be the psychologically important $160.00 mark. Beyond that, the daily resistance levels at $160.705 and $161.57 become the next targets. Such a move would likely be fueled by continued dollar strength, perhaps driven by stronger-than-expected US economic data or more hawkish commentary from Fed officials. The current high RSI on the 1H chart could provide the initial push, but the overbought Stochastic necessitates a consolidation or pullback before a sustained rally above $160 can be convincingly established. The ability of the pair to hold above the 1H support at $159.224 would be the first sign of bullish resilience.
The bullish scenario hinges on the continuation of the interest rate differential favoring the US dollar and a lack of significant safe-haven demand for the yen. If US Treasury yields continue to climb, attracting capital back to dollar-denominated assets, USDJPY could easily push higher. Furthermore, any signs of diminishing risk appetite globally would need to be carefully monitored; if geopolitical tensions were to significantly escalate, it could trigger a flight to safety that would challenge this bullish thesis. However, based on current market pricing and the prevailing economic narrative, the path of least resistance appears to be upwards, provided key intraday and short-term resistance levels are overcome. The critical factor would be whether the daily chart can overcome its own overbought signals and resistance levels, suggesting a more sustained move rather than just intraday volatility.
Where Bears Take Control: The Yen's Stand
Conversely, the bearish scenario for USDJPY would be initiated by a failure to hold the immediate support levels and a decisive break below the $159.025 mark on the 1-hour chart. This level, along with the 4-hour support at $158.678 and the daily support at $158.176, represents crucial floors that, if breached, could trigger a cascade of selling. A break below $158.176, especially with increased bearish momentum confirmed by MACD and RSI declining, would invalidate the short-term bullish signals and potentially open the door for a move back towards the $157.50 region, a level previously identified as a key support zone. Further downside could target the $156.89 support on the daily chart.
Several factors could contribute to a bearish reversal. A sudden shift in Fed policy expectations, perhaps due to cooling US inflation data or signs of economic slowdown, could reduce the dollar's appeal. Alternatively, a significant geopolitical event that dramatically increases global risk aversion could reignite safe-haven demand for the yen, leading to rapid unwinding of long USDJPY positions. The overbought signals on the daily Stochastic oscillator at $159.23 also suggest that the pair is ripe for a correction. If the bulls fail to defend the $159.224 intraday support, sellers could gain momentum, pushing the price down through the various support levels. The strength of the ADX on the 1-hour chart (29.64) suggests that a downtrend, once initiated, could gain traction quickly, especially if it coincides with broader dollar weakness across major currency pairs.
The Waiting Game: Consolidation and Uncertainty
Given the mixed signals across different timeframes and the current positioning of key indicators, a period of consolidation or range-bound trading remains a distinct possibility. This neutral scenario would see USDJPY oscillating between the immediate support and resistance levels identified on the 1-hour chart, roughly between $159.025 and $159.885. In this environment, neither the bulls nor the bears can establish a dominant trend, leading to choppy price action and potentially sideways movement as the market digests recent gains and awaits fresh catalysts. The weak ADX readings on the 4-hour (19.58) and daily (22.03) charts lend credence to this scenario, indicating a lack of strong directional momentum on longer timeframes.
This consolidation phase could be driven by a temporary pause in the interest rate differential narrative, perhaps due to a period of stable US economic data or cautious commentary from Fed officials. Similarly, a de-escalation of geopolitical tensions could reduce the immediate safe-haven appeal of the yen, thus preventing a sharp downturn. During such a period, traders might focus on shorter-term opportunities within the established range, looking for bounces off support and rejections from resistance. However, the underlying pressure from the interest rate differential suggests that any consolidation might be a precursor to a further upward move, rather than a significant reversal, unless fundamental drivers shift dramatically. The key here would be the volume and conviction behind price movements at the boundaries of the range.
Bearish Reversal: Yen Strength Returns
15% ProbabilityConsolidation Phase: Range-Bound Action
35% ProbabilityBullish Continuation: Dollar Dominance
50% ProbabilityNavigating the Week Ahead: Key Catalysts for USDJPY
As we look towards the upcoming trading week, several key factors will likely dictate the direction of USDJPY. The primary driver remains the divergence in monetary policy between the Fed and the BoJ. Any updates on inflation or employment from the US that reinforce the Fed's hawkish stance could provide further impetus for dollar strength. Conversely, any hints from the BoJ about a quicker-than-expected normalization of its ultra-loose policy could support the yen. Traders will be closely watching US Treasury yields; a continued rise would likely favor USDJPY, while a significant dip could signal a risk-off move or a reassessment of Fed policy expectations.
Geopolitical developments will also play a crucial role. While the current focus is on energy markets, any significant escalation or new flashpoints could trigger safe-haven flows into the yen. However, the market's recent tendency to prioritize interest rate differentials suggests that such flows might be short-lived unless the situation becomes extremely dire. On the technical front, the $159.025 support and $159.885 resistance levels on the 1-hour chart are critical. A decisive breakout above the latter could signal a move towards $160, while a failure to hold the former might open the door for a retracement towards the $158.00 region. The ADX readings across different timeframes suggest that while a trend might emerge, it could be susceptible to reversals, making risk management paramount.
| Indicator | Value | Signal | Interpretation |
|---|---|---|---|
| RSI (14) | 59.49 | Neutral | Approaching overbought on Daily, neutral on 4H |
| MACD Histogram | 0.15 | Bullish | Positive momentum on Daily, but fading |
| Stochastic | K:49.67, D:30.17 | Bullish Crossover | Bullish crossover on Daily, but overbought on 1H |
| ADX | 22.03 | Moderate Trend | Weak trend on 4H, moderate on Daily |
| Bollinger Bands | Middle Band | At Middle Band | Price testing middle band on Daily |
Frequently Asked Questions: USDJPY Analysis
What happens if USDJPY breaks above the $159.885 resistance level?
A sustained break above $159.885 on the 1-hour chart, especially with increasing volume, could signal a continuation of the bullish momentum. This would likely target the $160.00 psychological level, followed by the daily resistance at $160.705. Such a move would be predicated on continued dollar strength and a lack of significant yen safe-haven demand.
Should I consider buying USDJPY at current levels around $159.23 given the mixed signals?
Caution is advised at current levels due to conflicting signals across timeframes. The bullish 1-hour trend is challenged by overbought conditions and neutral daily indicators. A more prudent approach would be to wait for a clear break above $159.885 or a confirmed pullback to support around $159.025 before considering entry.
Is the RSI at 59.49 on the daily chart a sell signal for USDJPY?
An RSI of 59.49 on the daily chart is approaching overbought territory but is not yet a definitive sell signal. It indicates increasing bullish momentum that could potentially lead to further gains, but also suggests that the pair is becoming extended and could be due for a pullback or consolidation. Confirmation from other indicators like Stochastic or a break of key resistance would be needed for a stronger sell signal.
How will upcoming US economic data, like inflation figures, affect USDJPY this week?
Stronger-than-expected US inflation data would likely reinforce the Fed's hawkish stance, potentially pushing USDJPY higher by widening the interest rate differential. Conversely, softer inflation could lead to reassessments of Fed policy, weakening the dollar and possibly triggering a pullback in USDJPY towards support levels like $159.025.
Track markets in real-time
AI-powered analysis, technical indicators and real-time price data.
Join Our Telegram Channel
Breaking market news, AI analysis and trading signals instantly.
Join Channel