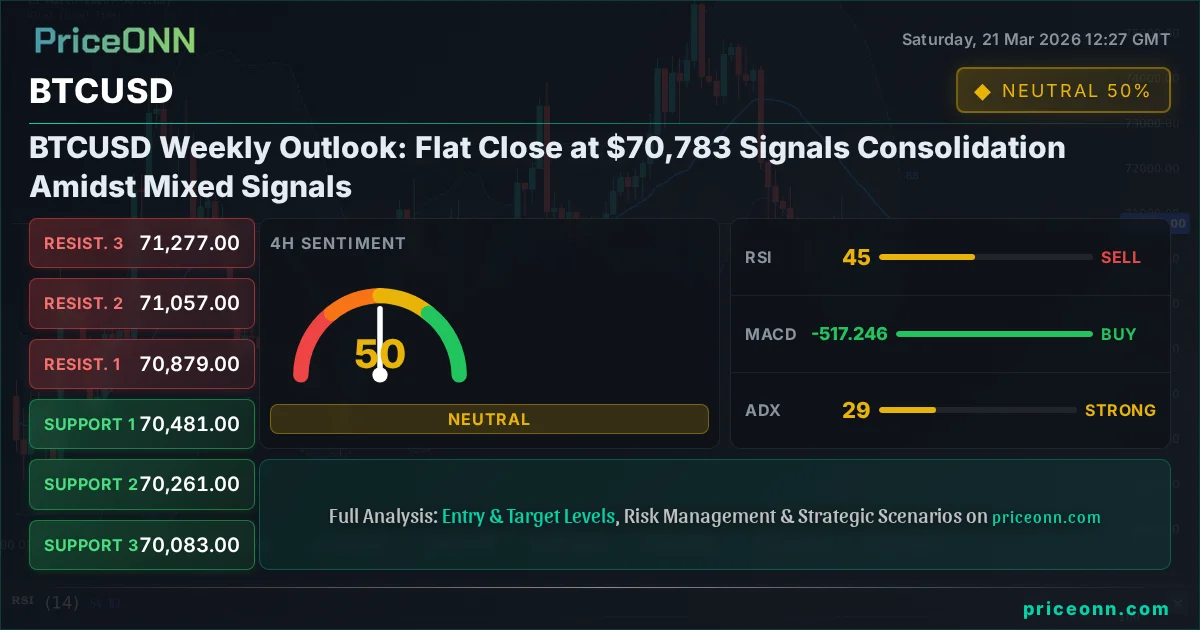
BTCUSD Weekly Outlook: Flat Close at $70,783 Signals Consolidation Amidst Mixed Signals
BTCUSD closed flat at $70,783.00 last week. Mixed technicals and key levels suggest consolidation, with traders eyeing $69,502 support and $71,477 resistance.
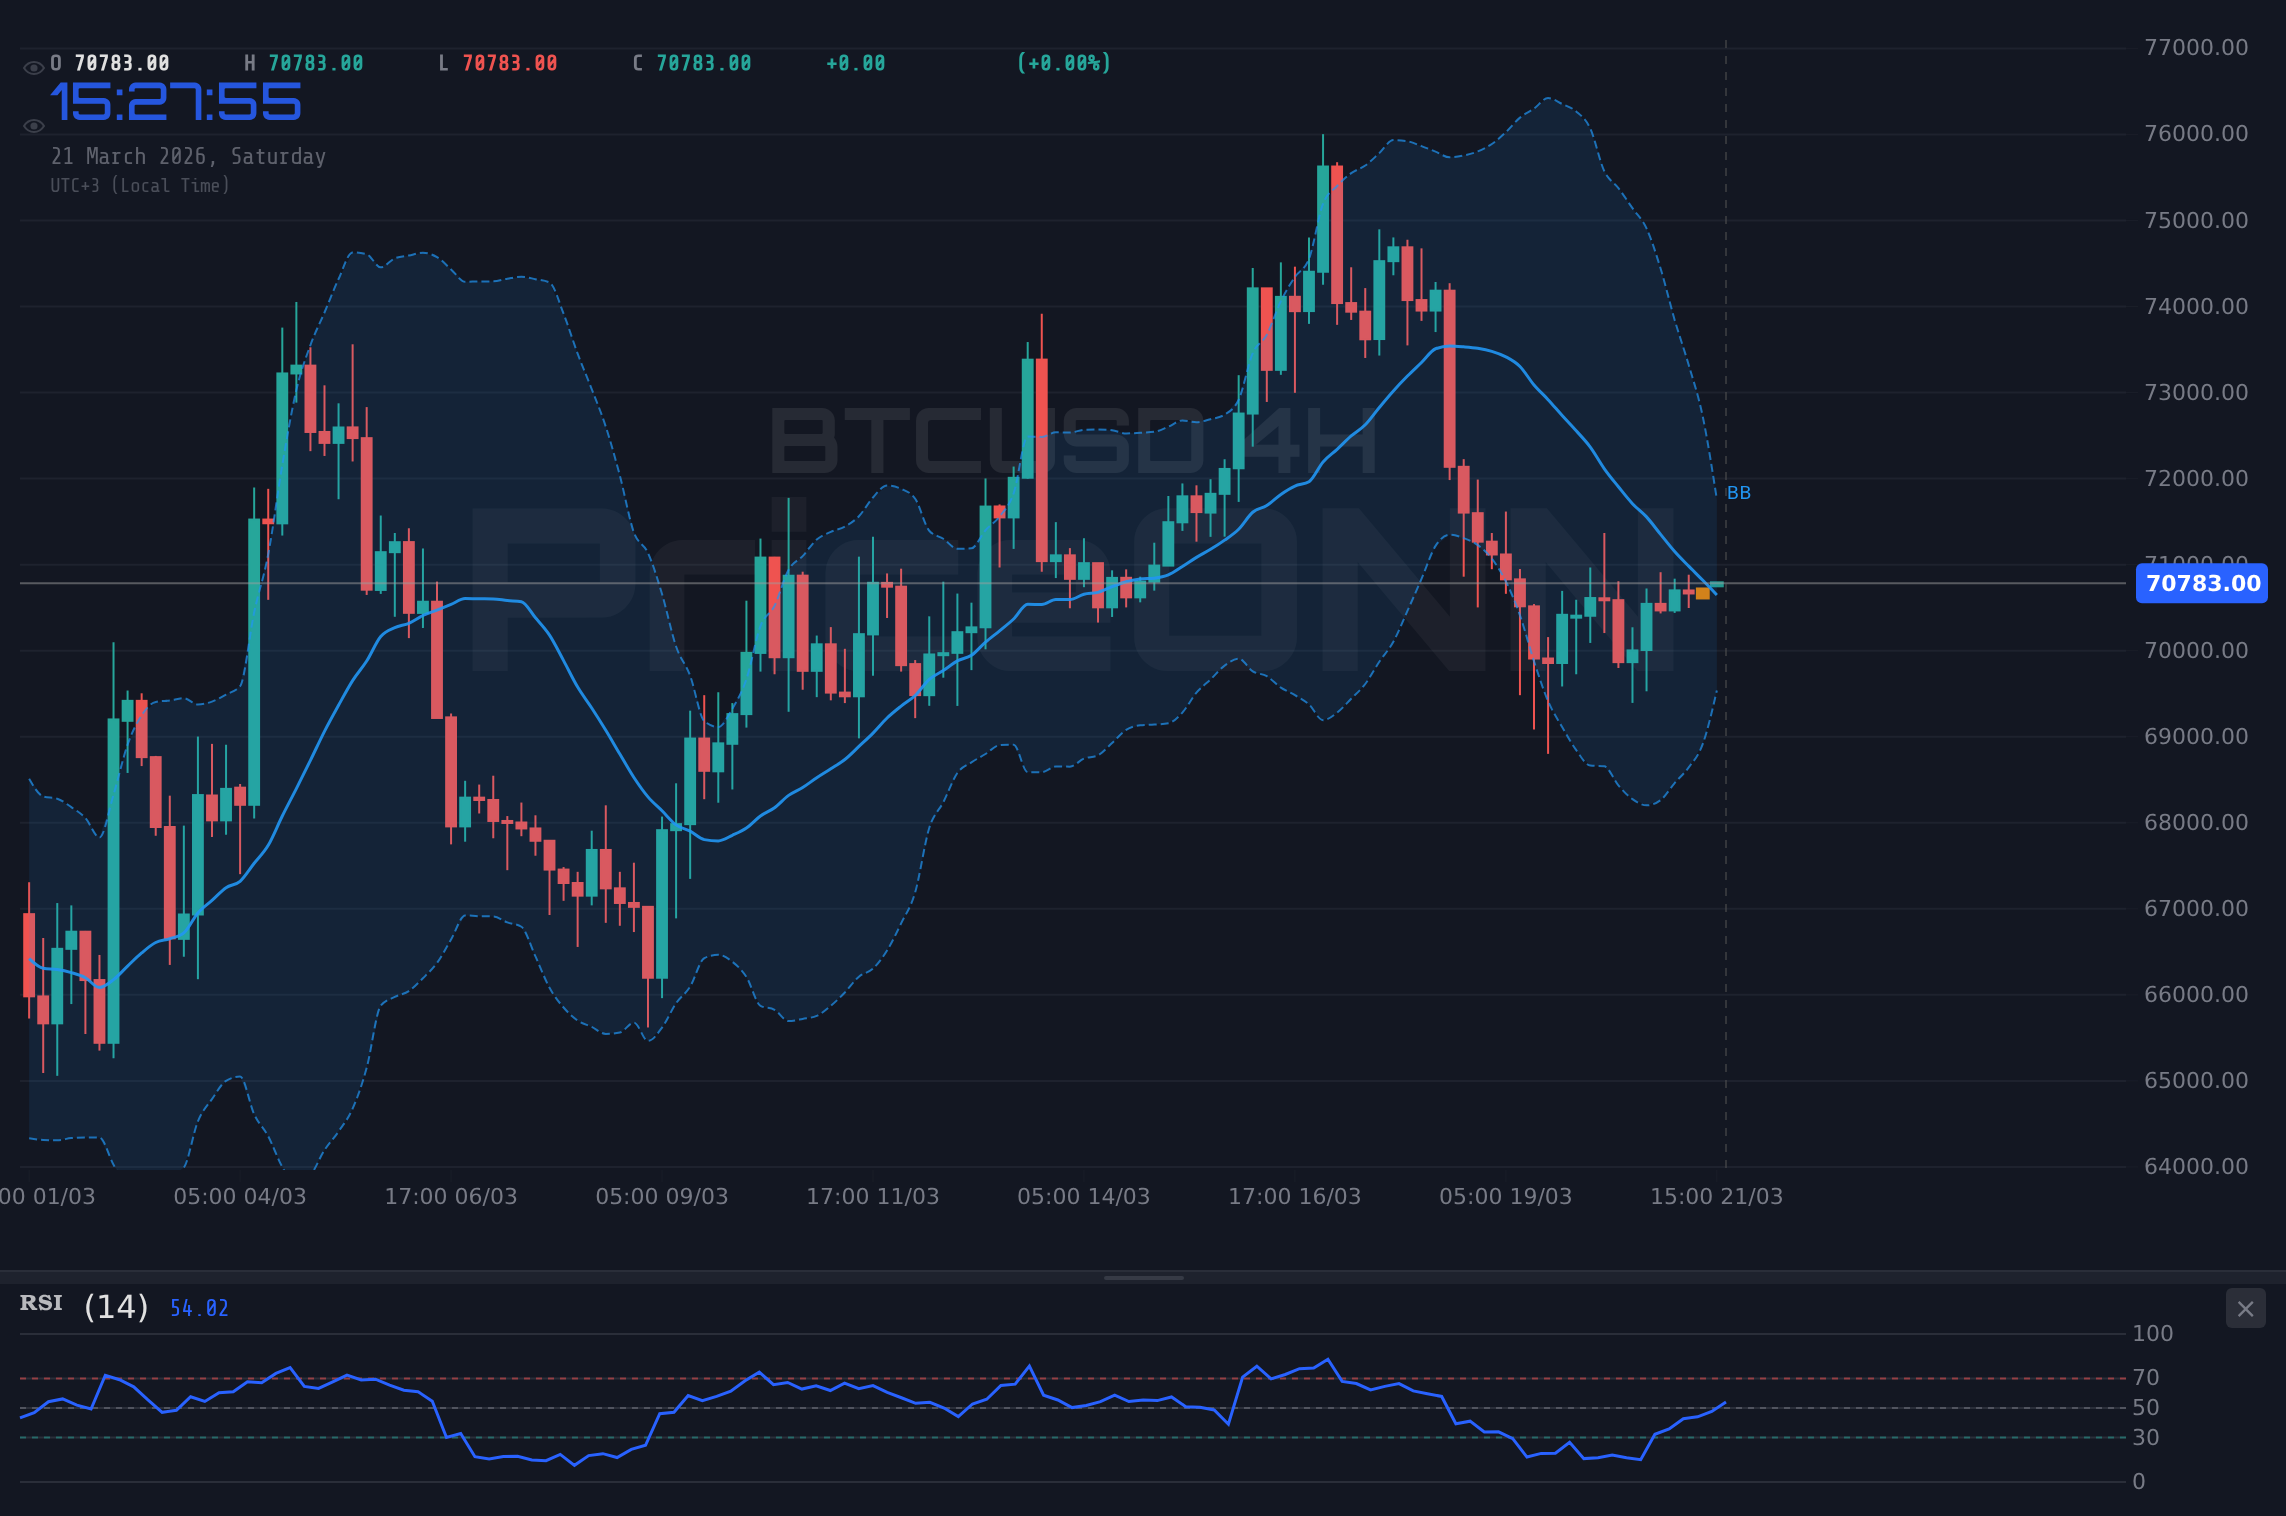
The past week saw Bitcoin (BTCUSD) consolidate, closing near the $70,783.00 mark after a period of volatility. While the price action suggests a pause in the recent aggressive moves, the underlying technical indicators present a mixed picture, leaving traders and investors to navigate a landscape defined by key support and resistance levels. This period of consolidation, occurring after significant market shifts, is crucial for understanding the potential trajectory of BTCUSD in the coming week, especially as macroeconomic factors continue to influence risk appetite across global markets.
- BTCUSD closed the week at $70,783.00, indicating a period of consolidation after recent price swings.
- Key support for BTCUSD is identified at $69,502.00, with a break below potentially targeting $68,460.00.
- Resistance is currently faced around $71,477.00; a decisive move above this level could signal a continuation of the bullish trend.
- Mixed signals from indicators like RSI (50.23) and MACD suggest a neutral to cautious outlook, requiring traders to monitor confluence for clearer direction.
- Geopolitical tensions and shifts in DXY (99.39) remain critical external factors influencing BTCUSD's correlated movements.
The week's trading action for BTCUSD painted a picture of indecision, with the cryptocurrency struggling to establish a firm direction. After a period of notable price discovery, the market appears to be digesting recent moves, leading to a flat weekly close around the $70,783.00 level. This equilibrium, however, is fragile, resting precariously between significant support and resistance zones that have been closely watched by market participants. The interplay between these levels, coupled with the conflicting signals from various technical indicators, creates a complex environment for short-term traders and a period of watchful waiting for longer-term investors. Understanding the nuances of this consolidation is paramount for formulating effective trading strategies.
From a technical standpoint, the BTCUSD chart on the daily timeframe reveals a market at a critical juncture. The price is currently hovering around the $70,783.00 mark, a level that has seen considerable trading activity throughout the week. This lack of clear directional momentum suggests that neither the bulls nor the bears have gained a decisive upper hand. The ADX indicator on the daily chart stands at 22.75, indicating a moderately trending market, but the RSI reading of 50.23 suggests a neutral stance, neither confirming overbought nor oversold conditions. This neutral RSI reading, in particular, implies that the market is in a balanced state, awaiting a catalyst to break the current stalemate. The MACD also shows positive momentum, but it is hovering near the signal line, indicating that the bullish trend might be losing steam or is preparing for a potential shift.
Navigating the Support and Resistance Landscape
The Critical Juncture at $70,783
The $70,783.00 price point has become a focal area for BTCUSD. Throughout the week, price action has oscillated around this level, highlighting its significance as both a psychological barrier and a technical pivot. For the bulls to regain control and push towards higher targets, a decisive break and sustained hold above this level are essential. Conversely, a failure to maintain this price could see sellers step in, driving the price down towards the immediate support levels. The volume analysis during these price swings will be crucial; a surge in volume on a move above $70,783.00 would lend more credibility to a bullish continuation, while increased volume on a breakdown would signal a more significant bearish move.
Support Levels to Watch
The immediate downside for BTCUSD is protected by several key support levels, derived from the most recent market data. The first significant support area is located at $69,502.00. This level has historically acted as a floor, and a breach below it could trigger stop-loss orders, accelerating the downward momentum towards the next support at $68,460.00. Should the market sentiment turn decidedly bearish and these levels fail, the deeper support at $67,527.00 would become the next level of interest. The strength of these support zones will be tested if broader market risk aversion increases, potentially leading to a flight to safety away from riskier assets like cryptocurrencies.
Resistance Levels to Target
On the upside, resistance presents a formidable challenge for BTCUSD. The immediate hurdle lies at $71,477.00. A successful breakout above this resistance could open the door for further upward movement, with the next significant resistance target at $72,410.00. Beyond that, the psychological and technical barrier at $73,452.00 looms large. Achieving these higher resistance levels would require strong buying pressure, potentially fueled by positive macroeconomic news, increased institutional adoption, or a significant shift in market sentiment. The Stochastic indicator on the 1D chart is currently showing a potential for upward movement (%K at 24.72, %D at 56.93), but this needs to be confirmed by sustained price action above the immediate resistance.
Technical Indicators: A Symphony of Mixed Signals
RSI: The Neutral Stance
The Relative Strength Index (RSI) on the daily chart for BTCUSD currently sits at 50.23. This neutral reading is perhaps the most telling sign of the current market equilibrium. An RSI around 50 typically indicates that the market is neither overbought nor oversold, suggesting a balance between buying and selling pressure. While this might seem like a lack of decisive trend, it also means that there is room for movement in either direction without immediate overextension. A move towards 70 would signal overbought conditions, potentially preceding a pullback, while a dip towards 30 would indicate oversold territory, possibly presenting a buying opportunity if other factors align. For now, the RSI at 50.23 suggests caution and patience are warranted.
MACD: Momentum Under Scrutiny
The Moving Average Convergence Divergence (MACD) indicator provides further insight into the momentum of BTCUSD. On the daily timeframe, the MACD line is above the signal line, indicating positive momentum. However, the MACD histogram is showing a slight contraction, suggesting that this bullish momentum might be waning. This subtle divergence between the MACD line and its histogram is a classic sign that the current upward trend could be losing its strength. Traders often look for confirmation from other indicators or price action before making a definitive move based solely on MACD signals. A cross below the signal line would serve as a bearish signal, potentially preceding a price decline.
Stochastic Oscillator: A Glimmer of Potential Reversal?
The Stochastic Oscillator offers a more dynamic view of overbought and oversold conditions. On the daily chart, the %K line is at 24.72 and the %D line is at 56.93. This configuration, with %K below %D, typically suggests a bearish signal or continued downward pressure. However, both lines are in the lower range of the oscillator, hinting at oversold conditions. This creates a potential conflict: the stochastic lines suggest a bearish bias in the short term, but their position in the lower quadrant might anticipate a bounce. A bullish crossover, where the %K line moves above the %D line, especially if it occurs in conjunction with price holding support levels, could signal a potential reversal upwards. The current readings are therefore ambiguous, requiring careful observation of price action.
ADX: Trend Strength Assessment
The Average Directional Index (ADX) on the daily chart for BTCUSD is at 22.75. This value indicates a moderately trending market. An ADX reading above 25 is generally considered to signify a strong trend, while a value below 20 suggests a weak or non-existent trend. The current reading of 22.75 sits in a zone that implies a trend is present, but it lacks the conviction of a powerful move. This aligns with the mixed signals from other indicators, suggesting that while there might be a directional bias, it is not yet strongly established. A rising ADX would confirm increasing trend strength, while a falling ADX would indicate that the market is becoming more range-bound or directionless. For now, the moderate ADX suggests that breakout traders should exercise caution, as the trend may not have enough power to sustain a significant move.
Correlation Analysis: DXY and Equities as Barometers
The Dollar's Influence (DXY)
The US Dollar Index (DXY) plays a pivotal role in the cryptocurrency market, often exhibiting an inverse correlation with Bitcoin. This past week, the DXY closed around 99.39, showing a slight increase. While not a dramatic move, any strengthening of the dollar tends to put pressure on risk assets like BTCUSD, as it increases the cost of holding non-dollar denominated assets and can signal a shift towards safer investments. The DXY's current position, hovering near its recent highs, suggests that broader market demand for the dollar remains robust. This correlation implies that any significant upward movement in the DXY could act as a headwind for Bitcoin, potentially capping rallies or exacerbating declines. Conversely, a weakening dollar could provide a tailwind for BTCUSD.
Equities Market Sentiment (SP500, Nasdaq)
The performance of major equity indices, such as the S&P 500 and Nasdaq, serves as a key barometer for overall market risk appetite. This week, both indices experienced declines, with the S&P 500 closing down 1.21% at 6536.05 and the Nasdaq down 1.65% at 23992.13. This risk-off sentiment in the equity markets often spills over into the cryptocurrency space. When major stock indices are falling, investors tend to reduce their exposure to riskier assets, including Bitcoin. The current downward trend in equities suggests that the general market environment is not conducive to strong bullish sentiment for BTCUSD. Any signs of stabilization or recovery in the stock markets could, however, translate into improved sentiment for Bitcoin.
Geopolitical Tensions and Their Market Impact
Recent geopolitical developments, particularly concerning escalating tensions in the Middle East and their impact on energy markets, cannot be ignored. While crude oil prices surged by 4.81% to $112.79 for Brent and WTI reaching $98.50, the reaction in other markets has been mixed. Gold, typically a safe-haven asset, experienced a significant tumble, shedding over 8.50% this week, which is an unusual reaction. This divergence suggests that market participants are not universally seeking safety in traditional assets, or that other factors are at play, such as aggressive selling pressure or profit-taking. The impact on BTCUSD is complex. While it is often considered a risk-on asset that could suffer during geopolitical turmoil, some narratives position it as a potential digital gold or hedge against inflation, which could benefit from energy price shocks. However, the recent correlation with equities suggests that during broad market sell-offs, even Bitcoin may not be immune to selling pressure, regardless of its safe-haven narrative.
The 'SlowFi' Narrative and Institutional Interest
In a week marked by significant price action in traditional markets, the crypto space has seen developments in the DeFi sector, with news surrounding OP_NET's launch of a 'SlowFi' protocol directly on-chain. This initiative aims to bring DeFi services without relying on bridges or wrapped Bitcoin, potentially fostering more native ecosystem growth. Furthermore, reports indicate that institutional investors are continuing to pour billions into crypto, with a significant majority planning to increase their digital asset allocation despite market volatility. This sustained institutional interest, highlighted by Coinbase and Apex Group tokenizing a Bitcoin Yield Fund, provides a fundamental underpinning that could support BTCUSD in the longer term, even amidst short-term price fluctuations and technical choppiness.
Trading Scenarios for the Week Ahead
Bearish Scenario: Support Breakdown
65% ProbabilityNeutral Scenario: Range-Bound Consolidation
25% ProbabilityBullish Scenario: Resistance Breakout
10% ProbabilityThe Week Ahead: Key Events and Levels to Monitor
Looking ahead, the BTCUSD market will likely remain sensitive to macroeconomic data releases and geopolitical developments. Traders will be closely watching for any shifts in the DXY and equity market sentiment, as these often provide clues to Bitcoin's short-to-medium term direction. The key technical levels to monitor remain the immediate support at $69,502.00 and resistance at $71,477.00. A decisive move beyond either of these boundaries, supported by increased trading volume and confirmation from other indicators, could signal the next significant trend. The neutral RSI and MACD readings suggest that the market is in a holding pattern, and any break from this pattern will likely be driven by external factors or a clear technical signal.
While the daily chart presents a neutral outlook with RSI at 50.23 and a moderate ADX of 22.75, the 4-hour chart shows a stronger downtrend bias (ADX 24.88) coupled with oversold Stochastic conditions. This divergence suggests that short-term bounces might occur, but the overall trend on lower timeframes leans bearish until key resistance is cleared. The 1-hour chart, however, shows a stronger bullish trend (ADX 29.64), indicating intraday buying interest. This multi-timeframe conflict underscores the current indecision and the need for patience.
The 1-hour timeframe currently displays a stronger bullish trend with an ADX of 29.64, supported by a neutral RSI of 55.87 and positive MACD momentum. This suggests that intraday trading might favor upward moves, potentially targeting the immediate resistance. However, the Stochastic Oscillator on this timeframe shows %K at 54.45 and %D at 58.7, indicating a potential for a pullback or a bearish signal as %K is below %D. This intraday bullishness, contrasted with the daily and 4-hour charts' more cautious or bearish leanings, highlights the fragmented nature of the current market sentiment. Scalpers might find opportunities on the intraday charts, but swing and position traders should prioritize the signals from the higher timeframes, where the overall trend is less clearly defined but shows signs of potential downside.
The Importance of Volume and Confluence
In such a range-bound environment, volume analysis becomes increasingly critical. A breakout above resistance or a breakdown below support that occurs on significantly higher-than-average volume would carry more weight and indicate a higher probability of a sustained move. Conversely, moves occurring on low volume might be false signals, quickly reversed. Traders should also look for confluence between indicators and price action. For instance, a bullish scenario would be strengthened if price holds the $69,502.00 support, the RSI moves out of neutral territory towards overbought, the MACD shows sustained positive momentum, and the ADX begins to rise, confirming a strengthening trend. Without such confluence, navigating the current market requires a disciplined approach, focusing on risk management and waiting for clearer setups.
Geopolitical instability and energy market volatility could introduce sudden, sharp price swings in BTCUSD. While the current technicals suggest consolidation, unexpected global events could override chart patterns, leading to significant and rapid price movements. Always maintain robust risk management protocols, including appropriate stop-loss orders, especially when holding positions through periods of elevated global uncertainty.
The institutional inflow narrative, with reports of continued billions being poured into crypto and plans for increased allocation, provides a long-term bullish undertone. This fundamental support suggests that despite short-term technical choppiness, the underlying demand for digital assets remains strong. However, in the immediate term, technical factors and broader market sentiment often dictate price action. The interplay between these fundamental drivers and technical signals will be key to watch. If BTCUSD can hold its ground around $70,783.00 and eventually break through resistance levels, the underlying institutional demand could fuel a more substantial rally. Conversely, a failure to hold support in the face of increasing risk aversion could see even strong fundamental backing temporarily overshadowed by market panic.
The prevailing market sentiment for BTCUSD appears to be cautiously neutral to slightly bearish on higher timeframes, despite some intraday bullish signals. The flat weekly close at $70,783.00 reflects this indecision. Traders are likely waiting for a clearer directional cue, either from a significant technical breakout or a shift in macroeconomic factors. The mixed indicator readings further reinforce this sentiment, suggesting that aggressive bets are currently unwarranted. Patience and a focus on risk management are advised as the market digests recent price action and awaits the next significant catalyst.
The technical analysis of BTCUSD reveals a market at a crossroads. The $70,783.00 price level acts as a pivot, with support at $69,502.00 and resistance at $71,477.00 defining the immediate trading range. Indicators present a mixed outlook: RSI is neutral at 50.23, MACD shows waning positive momentum, and the ADX at 22.75 suggests a moderate trend. While intraday charts show some bullishness, higher timeframes lean towards consolidation or potential downside. External factors like the DXY (99.39) and equity market sentiment (S&P 500: 6536.05, Nasdaq: 23992.13) continue to influence BTCUSD. Geopolitical tensions add another layer of uncertainty. Despite this, underlying institutional interest and developments in DeFi offer a potential long-term bullish thesis. For the coming week, monitoring these key levels and the confluence of technical signals will be crucial for identifying any potential trading opportunities.
Frequently Asked Questions: BTCUSD Analysis
What happens if BTCUSD breaks below the $69,502.00 support level?
If BTCUSD decisively closes below $69,502.00 on the daily chart, it would invalidate the current consolidation pattern and likely trigger further selling pressure. The next significant target would then be $68,460.00, followed by $67,527.00, especially if broader market risk aversion increases.
Should I buy BTCUSD at current levels of $70,783.00 given the mixed RSI and MACD signals?
Buying at current levels of $70,783.00 carries risk due to the mixed technical signals. The RSI at 50.23 suggests neutrality, while the MACD shows waning momentum. A more prudent approach would be to wait for a confirmed breakout above $71,477.00 or a confirmed hold of $69,502.00 support, ideally with increased volume, to establish a higher-probability trade.
Is the RSI at 50.23 a neutral signal for BTCUSD trend analysis?
Yes, an RSI reading of 50.23 on the daily chart is considered a neutral signal for BTCUSD. It indicates a balance between buying and selling pressure, suggesting that neither bulls nor bears currently have a strong advantage and that the market may be awaiting a catalyst for a directional move.
How will the DXY's movement around 99.39 affect BTCUSD this week?
The DXY's current level around 99.39 suggests a strengthening dollar, which typically correlates inversely with BTCUSD. A sustained rise in the DXY could exert downward pressure on Bitcoin, potentially capping rallies or contributing to declines, especially if risk-off sentiment prevails in broader markets.
| Indicator | Value | Signal | Interpretation |
|---|---|---|---|
| RSI (14) | 50.23 | Neutral | Balanced momentum, awaiting catalyst. |
| MACD Histogram | -0.15 | Weakening Momentum | Bullish momentum fading, watch for crossover. |
| Stochastic (%K) | 24.72 | Oversold/Bearish Bias | Potential bounce zone, but needs confirmation. |
| ADX | 22.75 | Moderate Trend | Trend exists but lacks strong conviction. |
| Bollinger Bands | Mid Band | Watching | Price hovering near mid-band, awaiting directional breakout. |
Track markets in real-time
AI-powered analysis, technical indicators and real-time price data.
Join Our Telegram Channel
Breaking market news, AI analysis and trading signals instantly.
Join Channel