The Australian Dollar versus the US Dollar (AUD/USD) navigated a week of relative calm, largely consolidating around the $0.70241 mark. Last Friday's close saw the pair hovering near this critical juncture, reflecting a market caught between conflicting fundamental drivers and a lack of decisive technical direction. As we step into a new trading week, the question on many traders' minds is whether the AUD/USD is poised for a significant move, or if it will remain range-bound, awaiting clearer signals from central banks and macroeconomic data. The current technical indicators paint a mixed picture, with some suggesting potential upside while others hint at underlying weakness. This analysis delves into the key levels, technical readings, and potential scenarios that will shape the AUD/USD's trajectory in the coming days, aiming to provide a comprehensive outlook for the week ahead.
- AUD/USD closed last week near $0.70241, indicating a flat trading week.
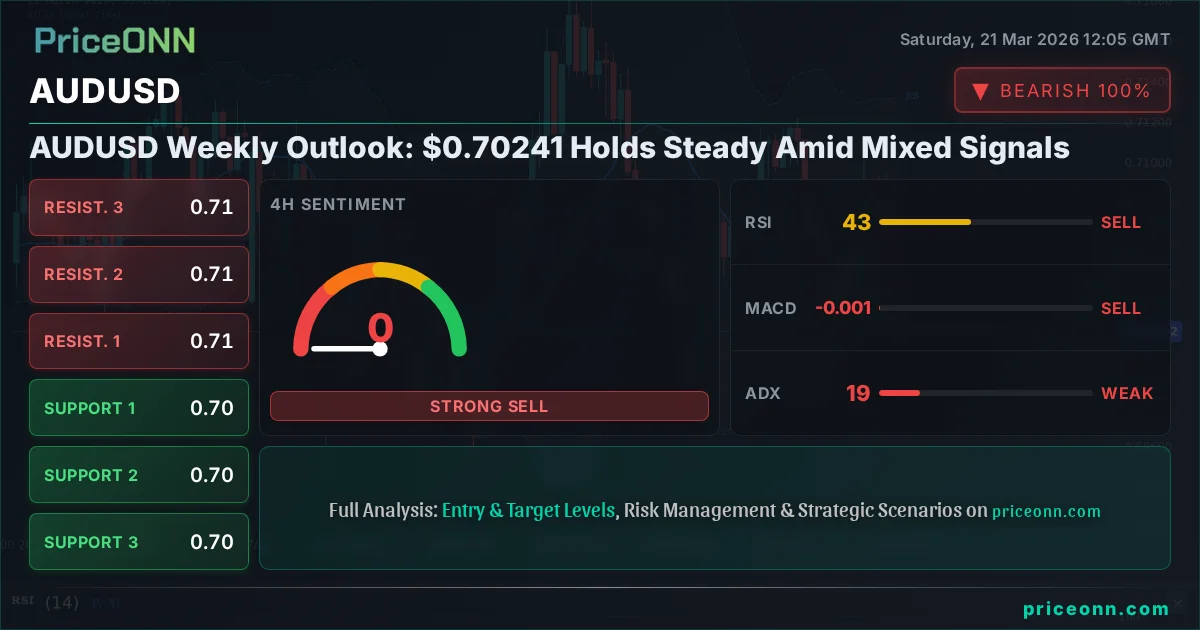
- Key support is identified at $0.70193, with resistance eyed at $0.71284.
- RSI at 47.97 on the daily chart suggests a slight bearish lean, but lacks conviction.
- ADX at 20.48 indicates a weak trend, suggesting consolidation is likely.
- Geopolitical tensions and central bank policy remain key macro drivers.
Navigating the Choppy Waters: Last Week's Price Action
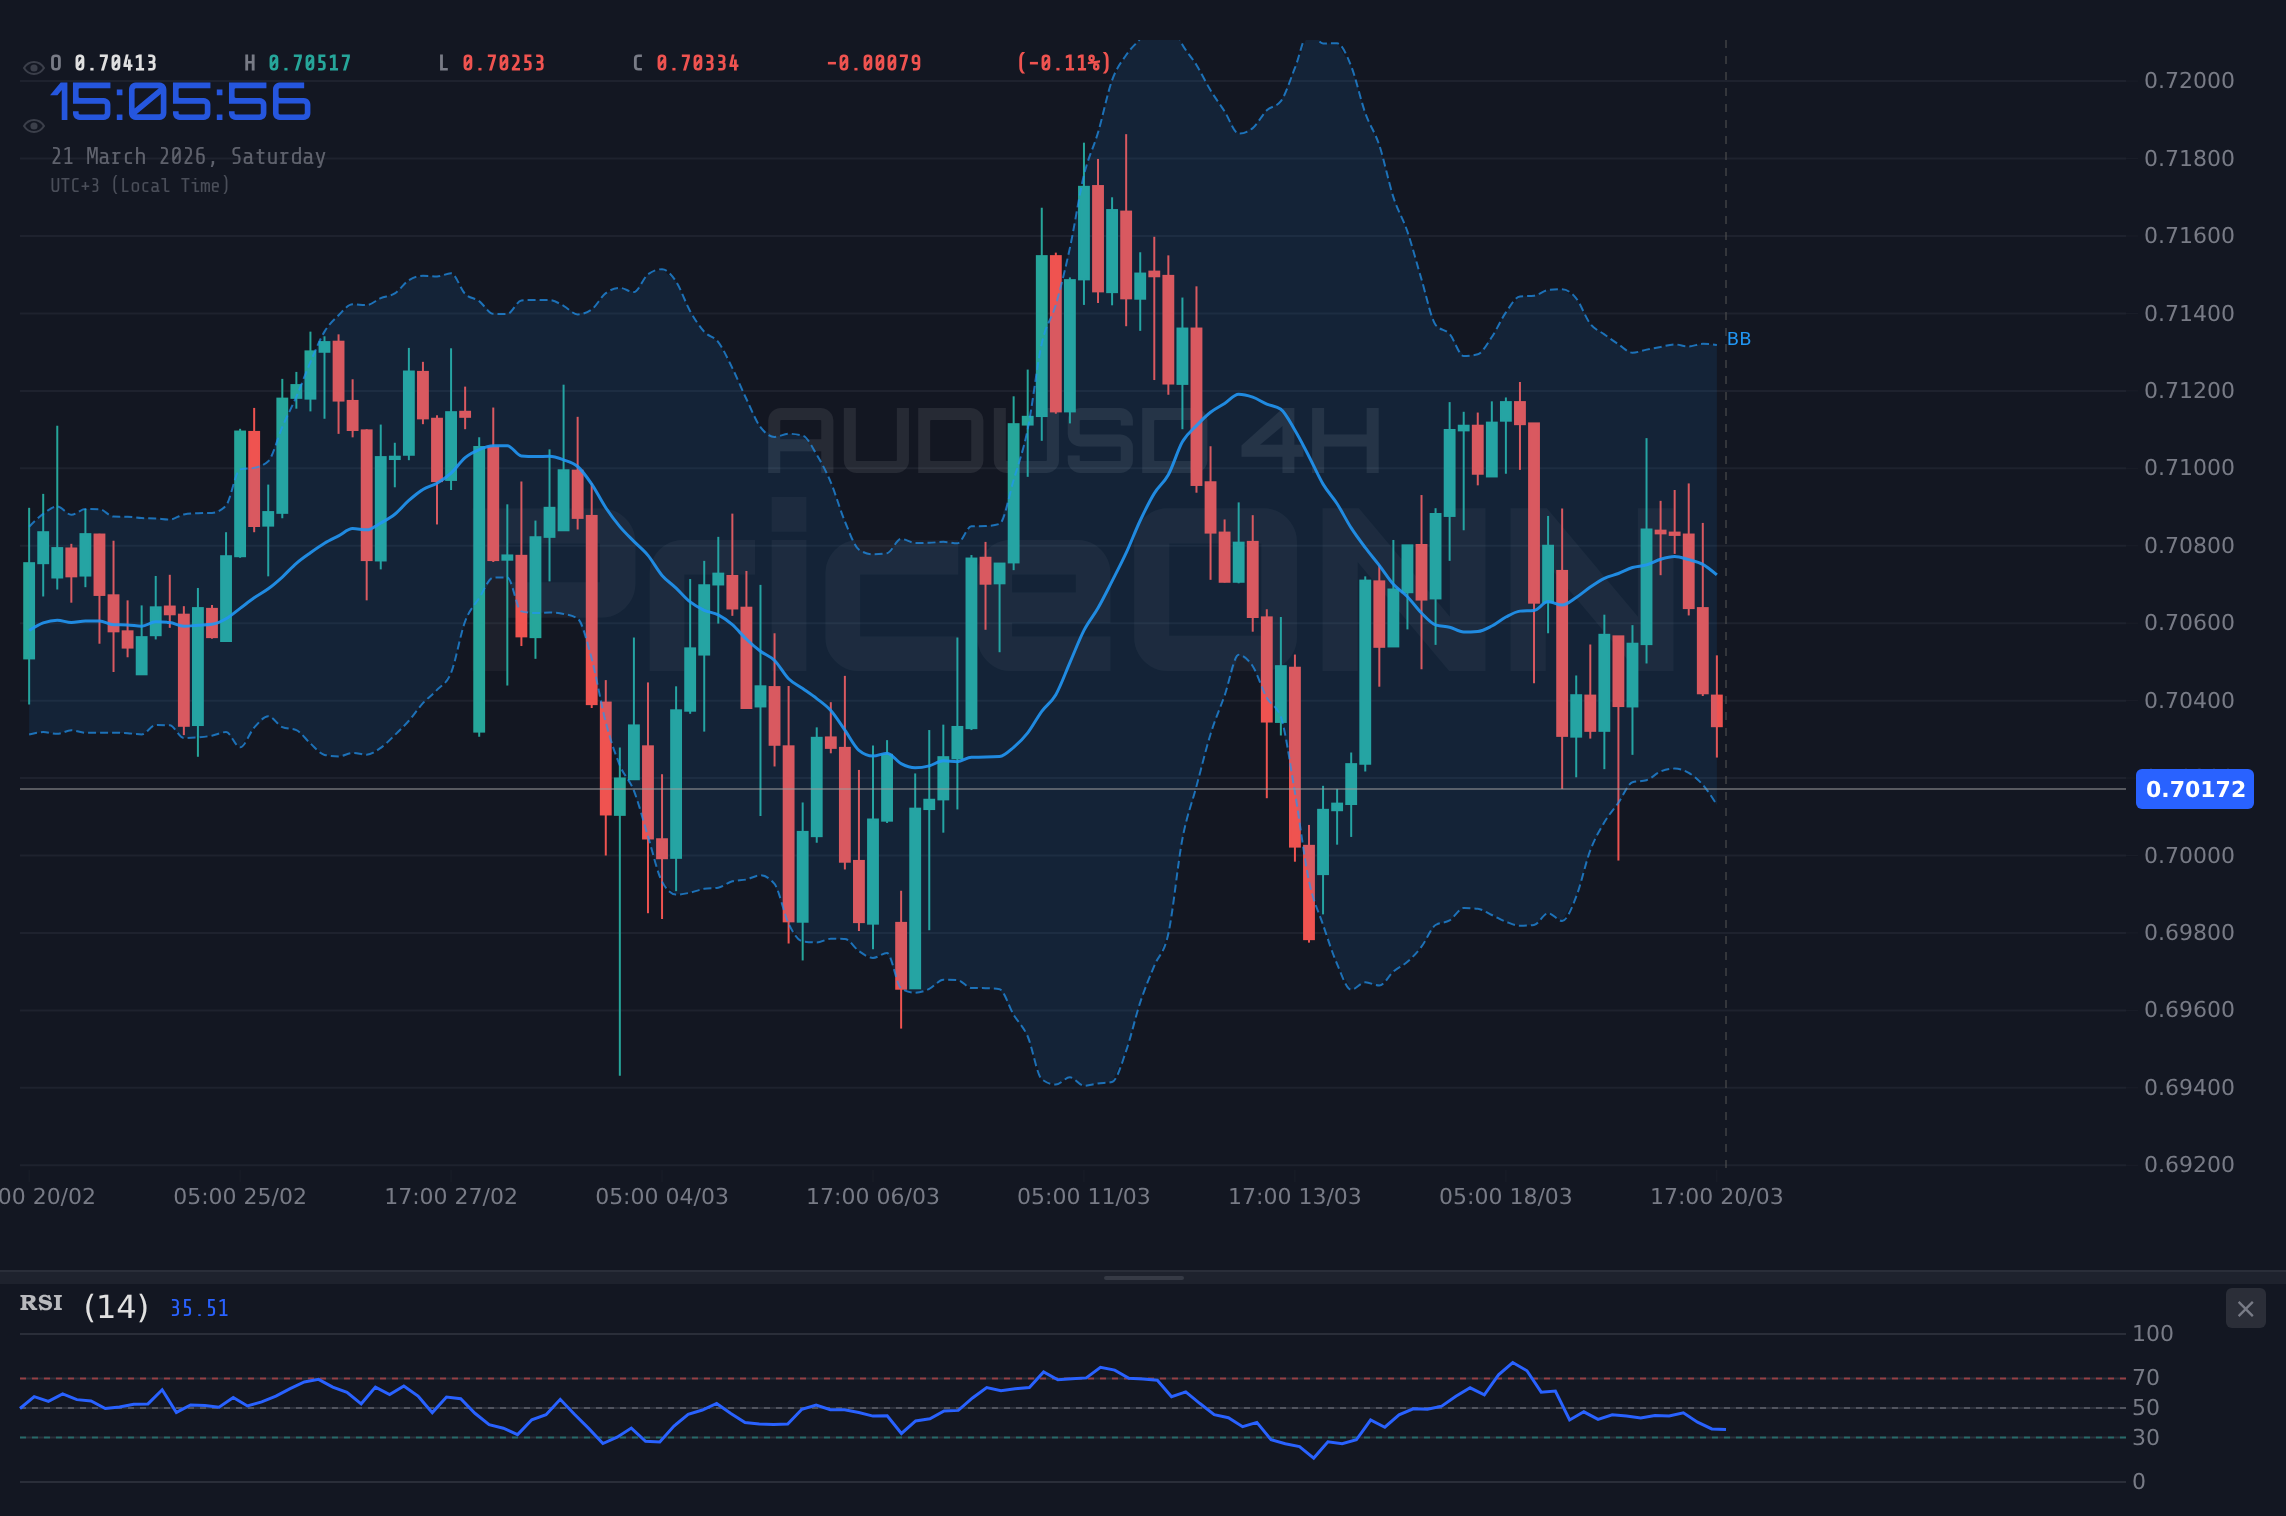
Last week was characterized by a distinct lack of directional conviction for the AUD/USD. While the pair experienced some intraday volatility, it ultimately failed to break decisively above key resistance levels or fall through significant support. The current price of $0.70241 represents a level where both buyers and sellers have shown interest, leading to the sideways action observed. This consolidation phase often occurs when markets are digesting recent news, such as the RBA's hawkish surprise earlier in the month, while simultaneously awaiting fresh catalysts. The US dollar, as measured by the DXY, showed some strength, trading around 99.39 on Friday, which typically exerts downward pressure on commodity-linked currencies like the Australian dollar. However, this pressure was not enough to force a sustained breakdown below the $0.7000 handle, highlighting the resilience of AUD/USD buyers at these lower levels.
The failure to make significant progress in either direction suggests that market participants are adopting a 'wait-and-see' approach. The economic calendar provided some mixed signals. While Australian data, such as the unemployment rate, surprised to the upside, hinting at potential economic headwinds, the broader risk sentiment also played a role. Global equity markets, including the SP500 and Nasdaq, experienced significant declines, trading at 6536.05 and 23992.13 respectively. This risk-off sentiment usually favors safe-haven assets like the US dollar, but the specific interplay of factors kept AUD/USD largely tethered to its current range. The lack of a strong trend on daily charts, with ADX reading a modest 20.48, further supports the notion of a market in consolidation, where significant price moves are unlikely without a clear catalyst.
On the commodity front, gold prices experienced a sharp tumble, falling to $4497.65, and silver also saw a significant decline, trading at $67.9. This weakness in precious metals, often seen as safe havens, could be attributed to the strengthening dollar and perhaps some unwinding of long positions ahead of key economic data. Oil prices, however, showed strength, with Brent crude climbing to $112.79 and WTI at $98.5, driven by escalating geopolitical tensions in the Gulf. This divergence between gold and oil adds another layer of complexity to the macro picture, as rising energy prices can fuel inflation concerns, potentially influencing central bank policy and, consequently, currency markets. For AUD/USD, the muted performance last week means that the key technical levels remain intact, setting the stage for potential volatility in the week ahead.
The Technical Tightrope: Indicators and Levels to Watch
From a technical perspective, the AUD/USD pair is currently perched precariously around the $0.70241 level, a price point that has seen considerable action. On the daily chart, the Relative Strength Index (RSI) stands at 47.97. This reading places it firmly in the neutral territory, but with a slight bearish lean, indicating that while there isn't overwhelming buying pressure, sellers are not yet in complete control. The Moving Average Convergence Divergence (MACD) histogram is also showing negative momentum, with the MACD line below its signal line. This suggests that downward momentum is present, though not necessarily accelerating rapidly. The Bollinger Bands on the daily chart show the price hovering below the middle band, which typically signals a bearish tendency in the short to medium term.
The Stochastic Oscillator provides a more nuanced view. On the daily timeframe, the %K line is at 35.85 and the %D line is at 44.21. This indicates a bearish signal as the %K line is below the %D line, and both are in the lower half of their range. However, the 1-hour chart shows a different picture, with Stochastic %K at 47.56 and %D at 57.56, which is also a bearish signal but closer to the midpoint. The 4-hour chart Stochastic shows %K at 43.72 and %D at 61.32, further reinforcing the bearish lean in the shorter timeframes. The Average Directional Index (ADX) on the daily chart is reading 20.48, which signifies a weak trend. This low ADX value confirms the consolidation observed, suggesting that the market lacks strong directional conviction and any breakouts might be prone to false signals.
The critical support level to watch remains around $0.70193, as indicated by the 1D support data. A decisive break below this level could signal the start of a more significant downtrend, potentially targeting the next support at $0.69545. On the resistance side, the immediate hurdle lies around $0.71284. This level has acted as a ceiling in recent trading sessions. If the bulls manage to push the price above this barrier with conviction and strong volume, it could open the door for a move towards the subsequent resistance at $0.71727. The overall technical picture is one of indecision, with shorter-term bearish signals battling against a lack of strong trend confirmation on longer timeframes. Traders will be closely monitoring price action around these key levels for any signs of a confirmed breakout or breakdown.
The Dollar's Dance: Macro Drivers and AUD/USD Correlation
The performance of the US Dollar Index (DXY) remains a paramount factor influencing the AUD/USD pair. Last Friday, the DXY was trading around 99.39, showing a degree of strength that typically puts pressure on risk-sensitive currencies like the Australian dollar. This upward movement in the dollar can be attributed to a confluence of factors, including ongoing geopolitical tensions which often drive safe-haven flows into the greenback, and shifting expectations regarding Federal Reserve policy. While the Fed recently maintained its interest rate stance, the market continues to digest the implications, with Fed officials providing mixed signals about the future path of monetary policy. The potential for continued dollar strength, or a reversal, will be a key determinant of AUD/USD's direction.
The correlation between AUD/USD and the broader risk sentiment, as reflected in equity markets, is also crucial. The significant drops seen in the SP500 (down 1.21% to 6536.05) and Nasdaq (down 1.65% to 23992.13) on Friday suggest a prevailing risk-off mood. In such environments, investors tend to move away from riskier assets and currencies towards perceived safe havens like the US dollar. If this risk-off sentiment persists, it could create headwinds for AUD/USD, potentially pushing it lower. Conversely, any signs of stabilization or recovery in global equities could provide a tailwind for the Australian dollar, especially if accompanied by a weakening dollar.
Commodity prices, particularly oil, also warrant attention. Brent crude's surge to $112.79 and WTI's rise to $98.5, fueled by escalating tensions in the Persian Gulf, add another layer of complexity. Higher energy prices can have a dual effect: they can signal increased global demand, which might be positive for commodity currencies, but they also fuel inflation concerns. This could lead central banks, including the Fed, to adopt a more hawkish stance, thereby strengthening the dollar. The sharp decline in gold prices to $4497.65, despite geopolitical risks, suggests that the dollar's safe-haven appeal might be currently outweighing gold's traditional role, or that the market is prioritizing other factors. Understanding these interconnected dynamics is vital for anticipating AUD/USD's moves.
The Week Ahead: Potential Scenarios for AUD/USD
Looking ahead, the AUD/USD pair is at a critical juncture, with several potential paths forward depending on how key technical and fundamental factors evolve. The current price of $0.70241 sits within a range defined by the daily support at $0.70193 and resistance at $0.71284. The market's next move will likely be dictated by a break of these levels, or by significant shifts in the broader macroeconomic landscape.
Bullish Scenario: The Aussie's Ascent
25% ProbabilityNeutral Scenario: The Waiting Game
55% ProbabilityBearish Scenario: The Aussie's Descent
20% ProbabilityThe most probable scenario, given the current technical setup and market conditions, appears to be a continuation of the neutral range-bound trading. The weak ADX reading of 20.48 on the daily chart strongly suggests a lack of trend, making sustained moves in either direction less likely without a significant catalyst. The market seems to be in a 'wait-and-see' mode, digesting recent events and awaiting clearer direction from upcoming economic data and central bank commentary. The probabilities assigned reflect this assessment: a 55% chance of continued consolidation, a 20% chance of a bearish breakdown if key dollar-supportive factors emerge, and a 25% chance of a bullish move if risk sentiment improves dramatically and the dollar weakens.
However, the potential for sudden shifts cannot be ignored. Geopolitical risks remain elevated, as evidenced by the oil price surge and concerns about Middle East tensions. Any escalation could lead to a flight to safety, benefiting the US dollar and potentially triggering the bearish scenario for AUD/USD. Conversely, a significant improvement in global risk appetite, perhaps spurred by positive economic news or a more dovish tone from the Fed, could fuel the bullish scenario. Traders should remain vigilant for breaks of the key support at $0.70193 and resistance at $0.71284, as these will be crucial in determining the pair's short-to-medium term direction. The 'fundamentals' of AUD/USD are complex, requiring constant monitoring of both Australian economic health and global risk dynamics.
What's Next? Key Triggers and Event Watchlist
As we look towards the upcoming week, several key events and technical triggers will be critical in shaping the AUD/USD's path. On the technical front, the immediate focus will remain on the AUD/USD $0.70241 price level. A decisive daily close above the resistance at $0.71284 would be a significant bullish signal, potentially opening the door for a move towards $0.71727 and beyond. Conversely, a firm break below the support at $0.70193 could signal a test of lower levels, with $0.69545 being the next significant area of interest. The strength of these moves, particularly the volume accompanying them, will be crucial for confirmation.
From a fundamental perspective, upcoming economic data releases will be paramount. Traders will be keenly watching any commentary from Federal Reserve officials for clues on future interest rate policy. Any hint of a more hawkish stance could strengthen the US dollar and pressure AUD/USD, while a more dovish tone could provide relief for the Aussie. Similarly, Australian economic data releases will be closely scrutinized. Any signs of further economic weakness in Australia, beyond what has already been priced in, could weigh on the currency. The interplay between US dollar strength, global risk sentiment, and commodity prices will continue to be a dominant theme.
Geopolitical developments, particularly those impacting oil prices and risk appetite, will also be a key factor to monitor. Given the current elevated tensions, any unexpected news could trigger sharp market movements. For AUD/USD, this means that while technical levels provide a framework, fundamental surprises could easily override them. Therefore, a flexible approach, combined with robust risk management, will be essential for navigating the potential volatility. The market is currently awaiting a clearer narrative, and the coming week's data and events will likely provide the necessary impetus for AUD/USD to break out of its recent consolidation.
| Indicator | Value | Signal | Interpretation |
|---|---|---|---|
| RSI (14) | 47.97 | Neutral | Slightly bearish lean, below 50 but not oversold. |
| MACD Histogram | -0.0026 | Bearish | Negative momentum, indicating downward pressure. |
| Stochastic | K=35.85, D=44.21 | Bearish | Below 50, %K |
| ADX | 20.48 | Weak Trend | Indicates a ranging or consolidating market, lack of strong direction. |
| Bollinger Bands | Below Middle Band | Bearish | Price action below the middle band suggests bearish bias. |
Frequently Asked Questions: AUDUSD Analysis
What happens if AUDUSD breaks decisively below the $0.70193 support level?
A break below $0.70193, especially with a strengthening US dollar and negative risk sentiment, could trigger a bearish scenario. This might lead to a test of the next support level at $0.69545, potentially extending towards $0.69102 if the downtrend gains significant momentum.
Should I consider buying AUDUSD at current levels around $0.70241 given the mixed indicators?
Buying at current levels requires caution. While some shorter-term indicators hint at potential reversals, the overall daily chart shows a weak trend (ADX 20.48) and bearish leanings (RSI 47.97). A more prudent approach might be to wait for a confirmed break above resistance at $0.71284 or a clear bullish signal at support near $0.70193.
Is the daily RSI at 47.97 a sell signal for AUDUSD right now?
An RSI of 47.97 is not a definitive sell signal on its own, as it sits in neutral territory. However, it indicates a slight bearish bias, suggesting that upward momentum is lacking and sellers have a slight edge. Confirmation from other indicators like the MACD histogram and price action breaking below key support would be needed for a stronger sell signal.
How will upcoming Fed commentary affect AUDUSD this week, given the current consolidation?
Any hawkish remarks from the Fed regarding inflation or interest rates could strengthen the US dollar, potentially pushing AUD/USD below $0.70193. Conversely, a more dovish tone might weaken the dollar, supporting a move towards the $0.71284 resistance level. Market participants will be closely watching for any shifts in rate cut expectations.
Track markets in real-time
AI-powered analysis, technical indicators and real-time price data.
Join Our Telegram Channel
Breaking market news, AI analysis and trading signals instantly.
Join Channel