AUD/USD is trading at $0.70961, reflecting a slight decline of -0.4% recently. The market dynamics are increasingly influenced by broader economic indicators and geopolitical factors.
The recent movement suggests that AUD/USD is under pressure due to a strengthening dollar and uncertain market sentiment.
Market Overview and Current Position
The Australian dollar has shown resilience against the backdrop of fluctuating economic conditions and global market dynamics. As of now, AUD/USD is facing downward pressure, trading at $0.70961. The recent price action has prompted traders to reassess their strategies as they anticipate upcoming economic releases that could impact market direction.
Technical Analysis
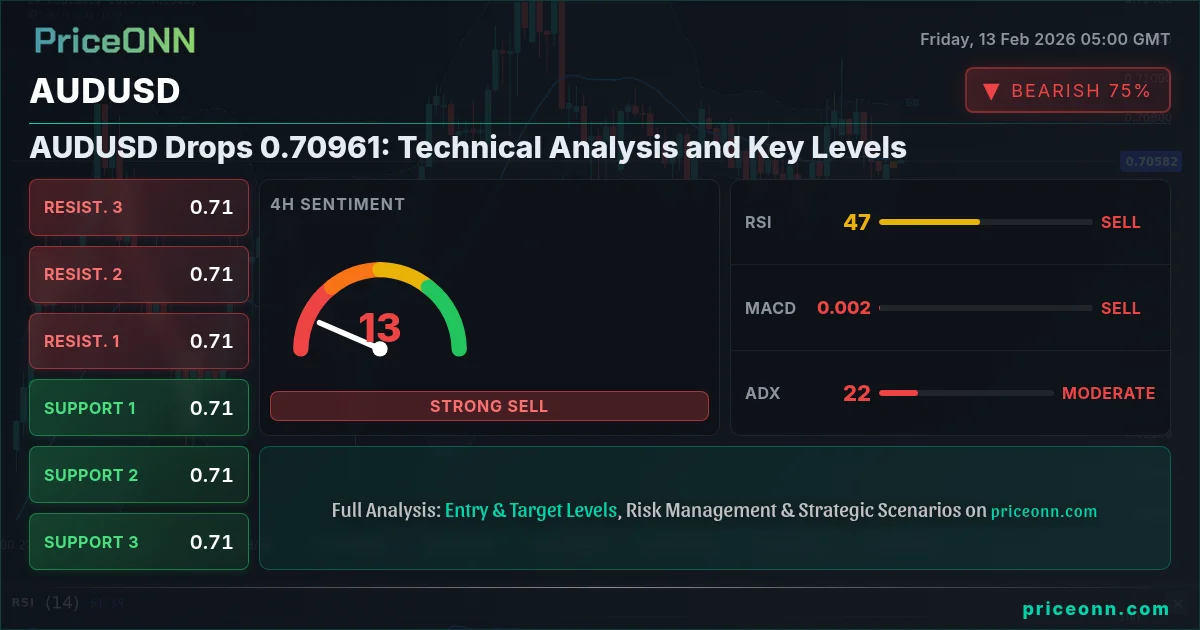
The 1-hour chart indicates a bearish trend with strong momentum:
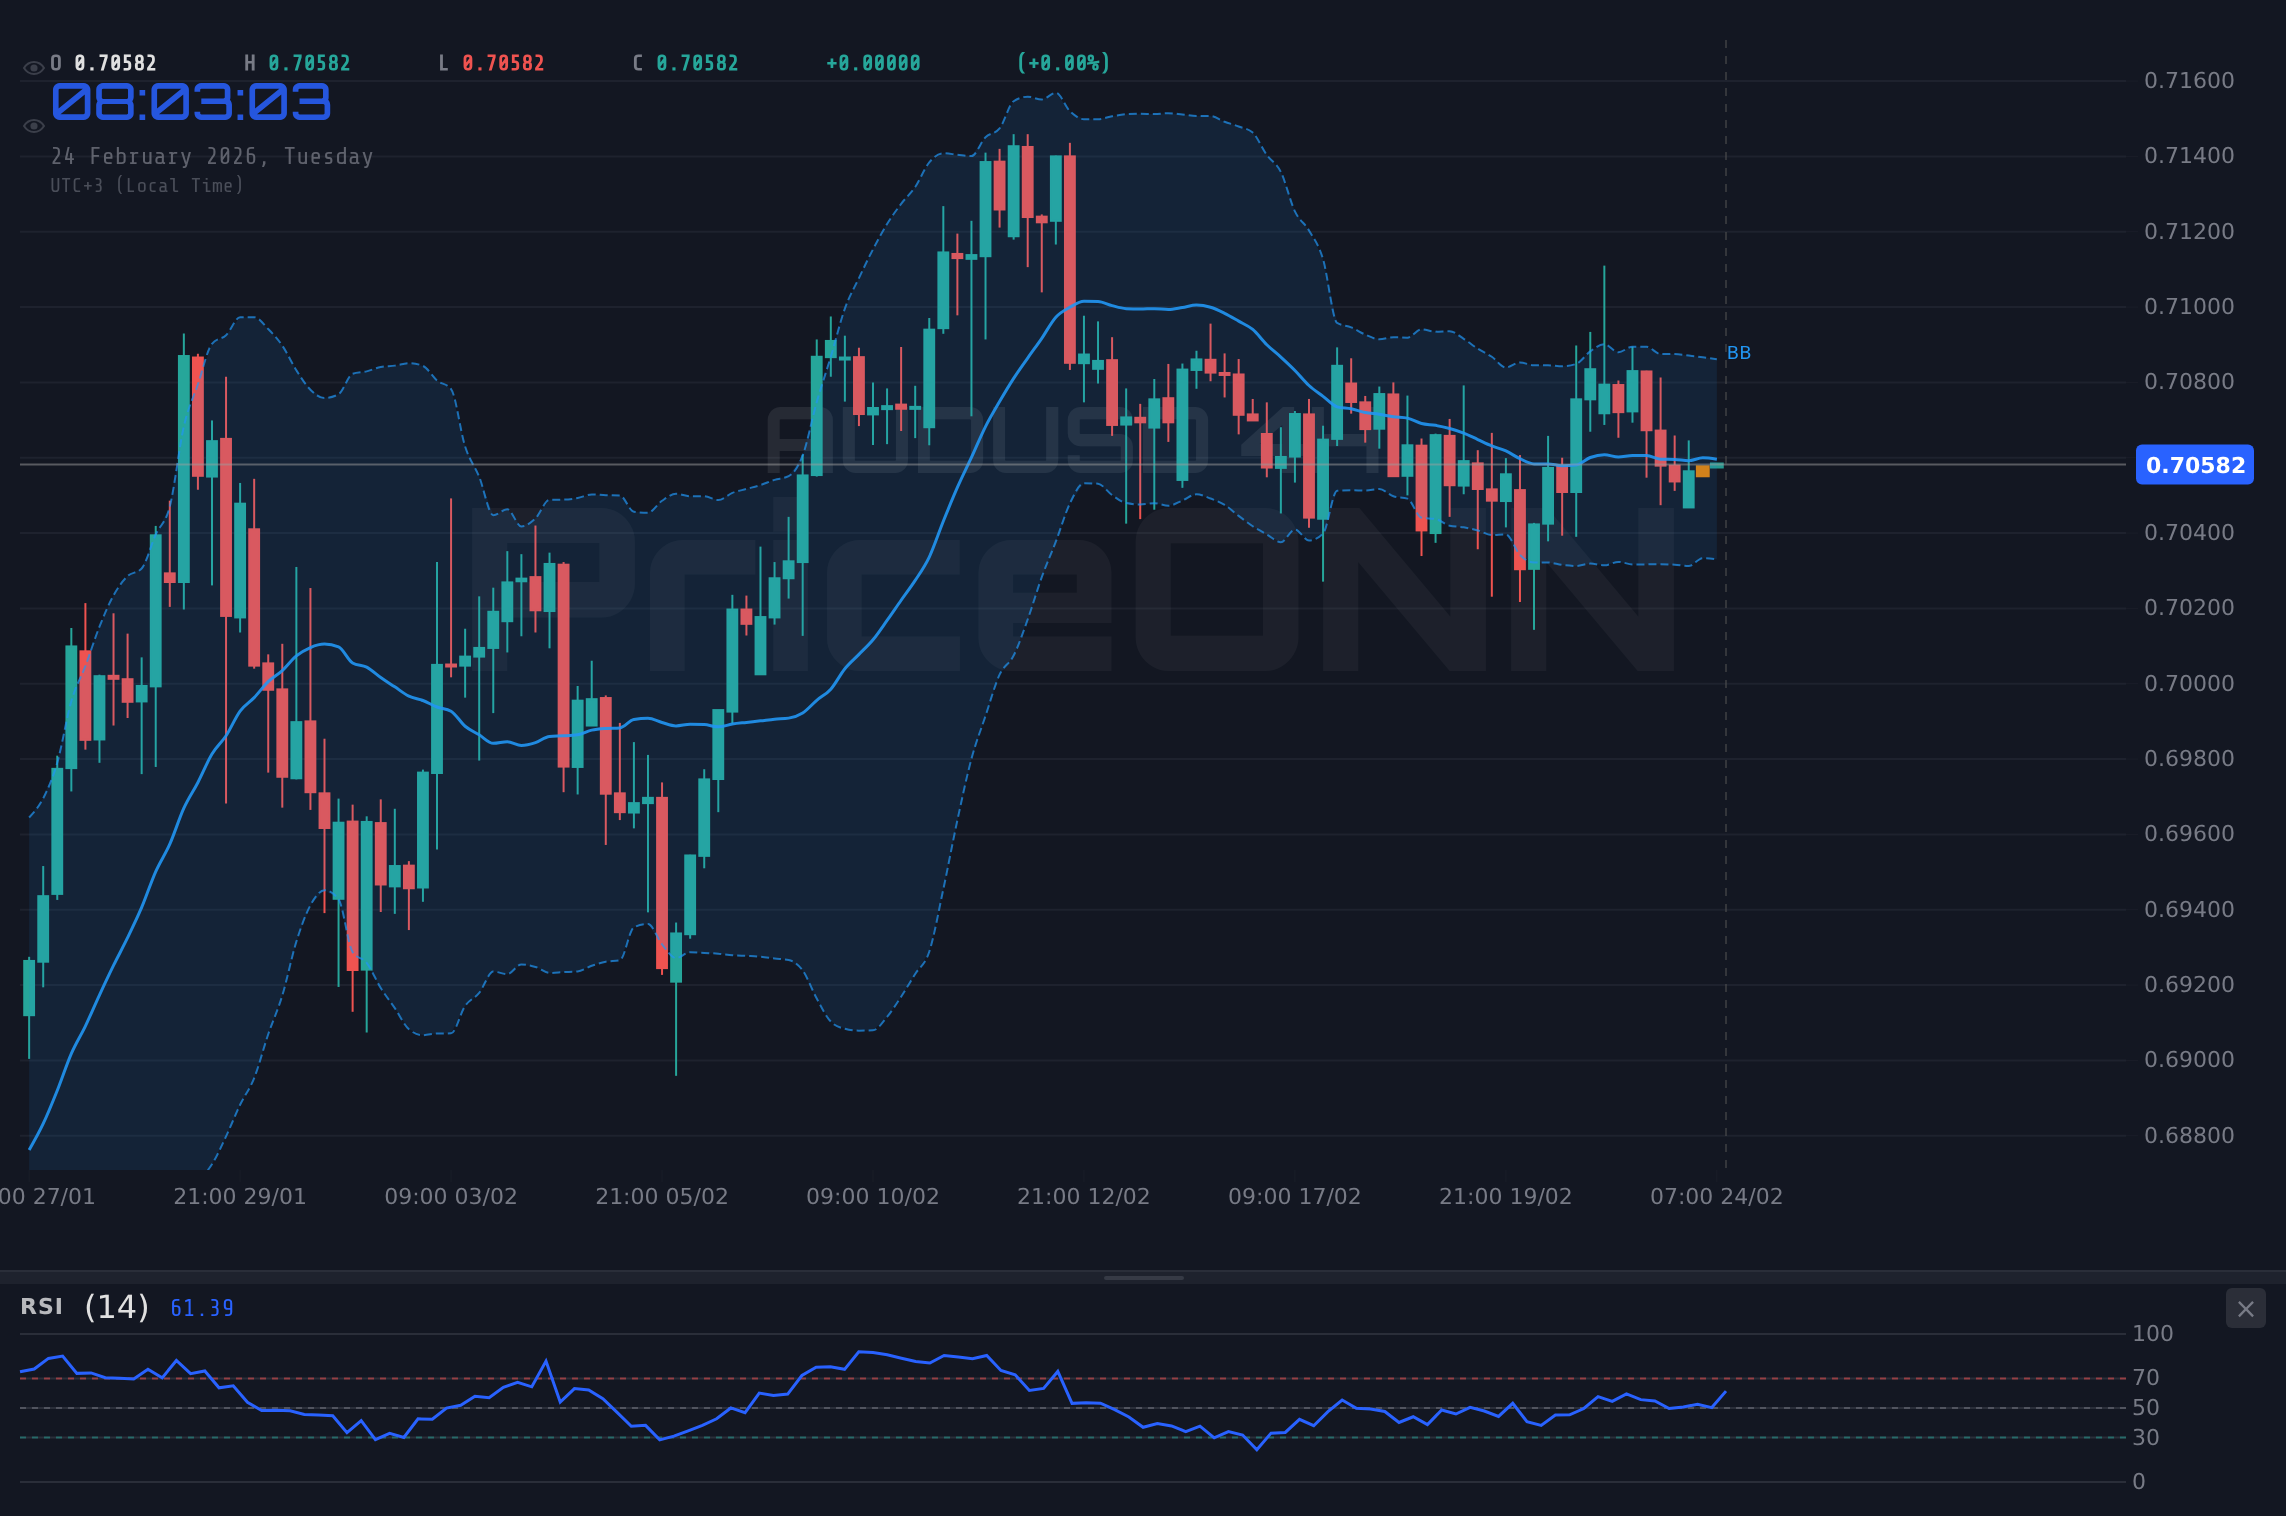
- Current Price: $0.70961
- Daily Range: 0.70747 - 0.71459
- Direction: Bearish
Support levels are firmly established below the current price, with critical points at:
- S1: 0.70785
- S2: 0.70678
- S3: 0.70608
Resistance levels are set above the current price, providing clear targets for potential upward movement:
- R1: 0.70962
- R2: 0.71032
- R3: 0.71139
Key Indicators Analysis
Indicator Note: RSI is at 42.64, indicating a neutral market condition, while the MACD shows bearish momentum under the signal line. Traders should watch for potential upward corrections if momentum shifts.
Economic Calendar Insights
Several crucial economic indicators are expected to release in the coming days:
Trade Plan
Trade Plan
Scenario A: Continuation of Downtrend
- Direction: Short
- Trigger: Close below $0.70960 on H4
- Target 1: $0.70785 (~7.6 pips)
- Target 2: $0.70678 (~8.5 pips)
- Stop/Invalidation: Close above $0.71032
Scenario B: Potential Reversal
- Condition: Holding of support at 0.70785 + RSI divergence
- Trigger: Close above $0.70962 on H4 + volume increase
- Target: $0.71032
- Invalidation: Close below $0.70608
News Risk: CPI data release on February 15 could increase volatility. Consider reducing position size.
Technical Summary
| Indicator | Value | Signal | Interpretation |
|---|---|---|---|
| RSI (14) | 42.64 | Neutral | Market is stable |
| MACD | -0.002 | Bearish | Under signal line |
| ADX | 19.05 | Weak Trend | Low momentum |
Support and Resistance Levels
Track markets in real-time
AI-powered analysis, technical indicators and real-time price data.
Join Our Telegram Channel
Breaking market news, AI analysis and trading signals instantly.
Join Channel