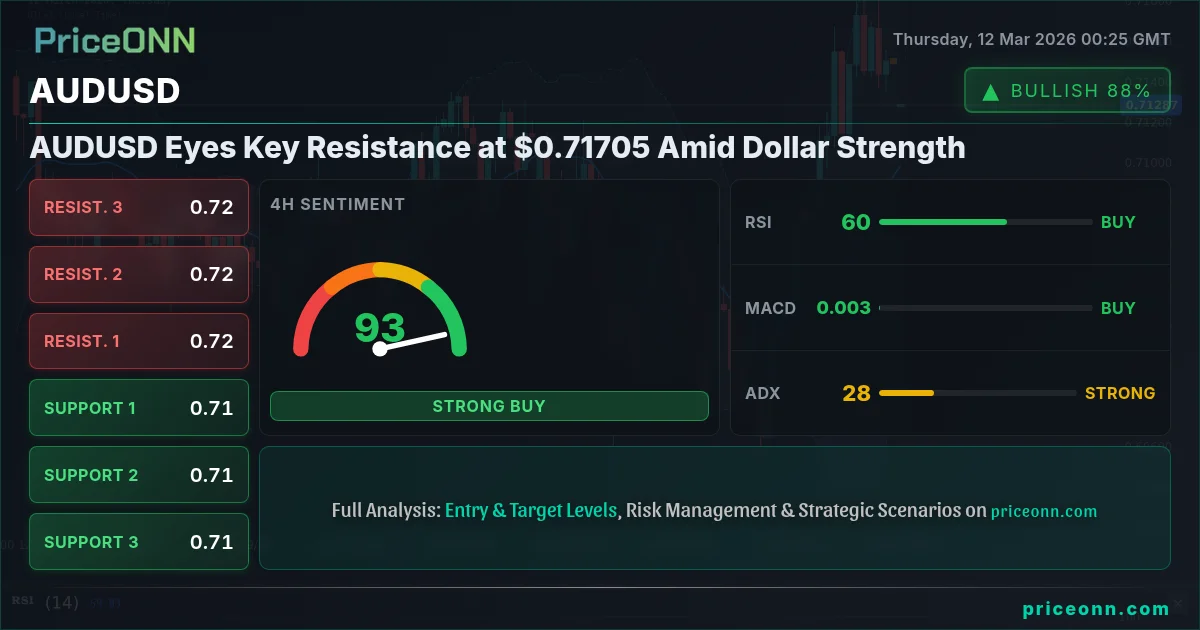
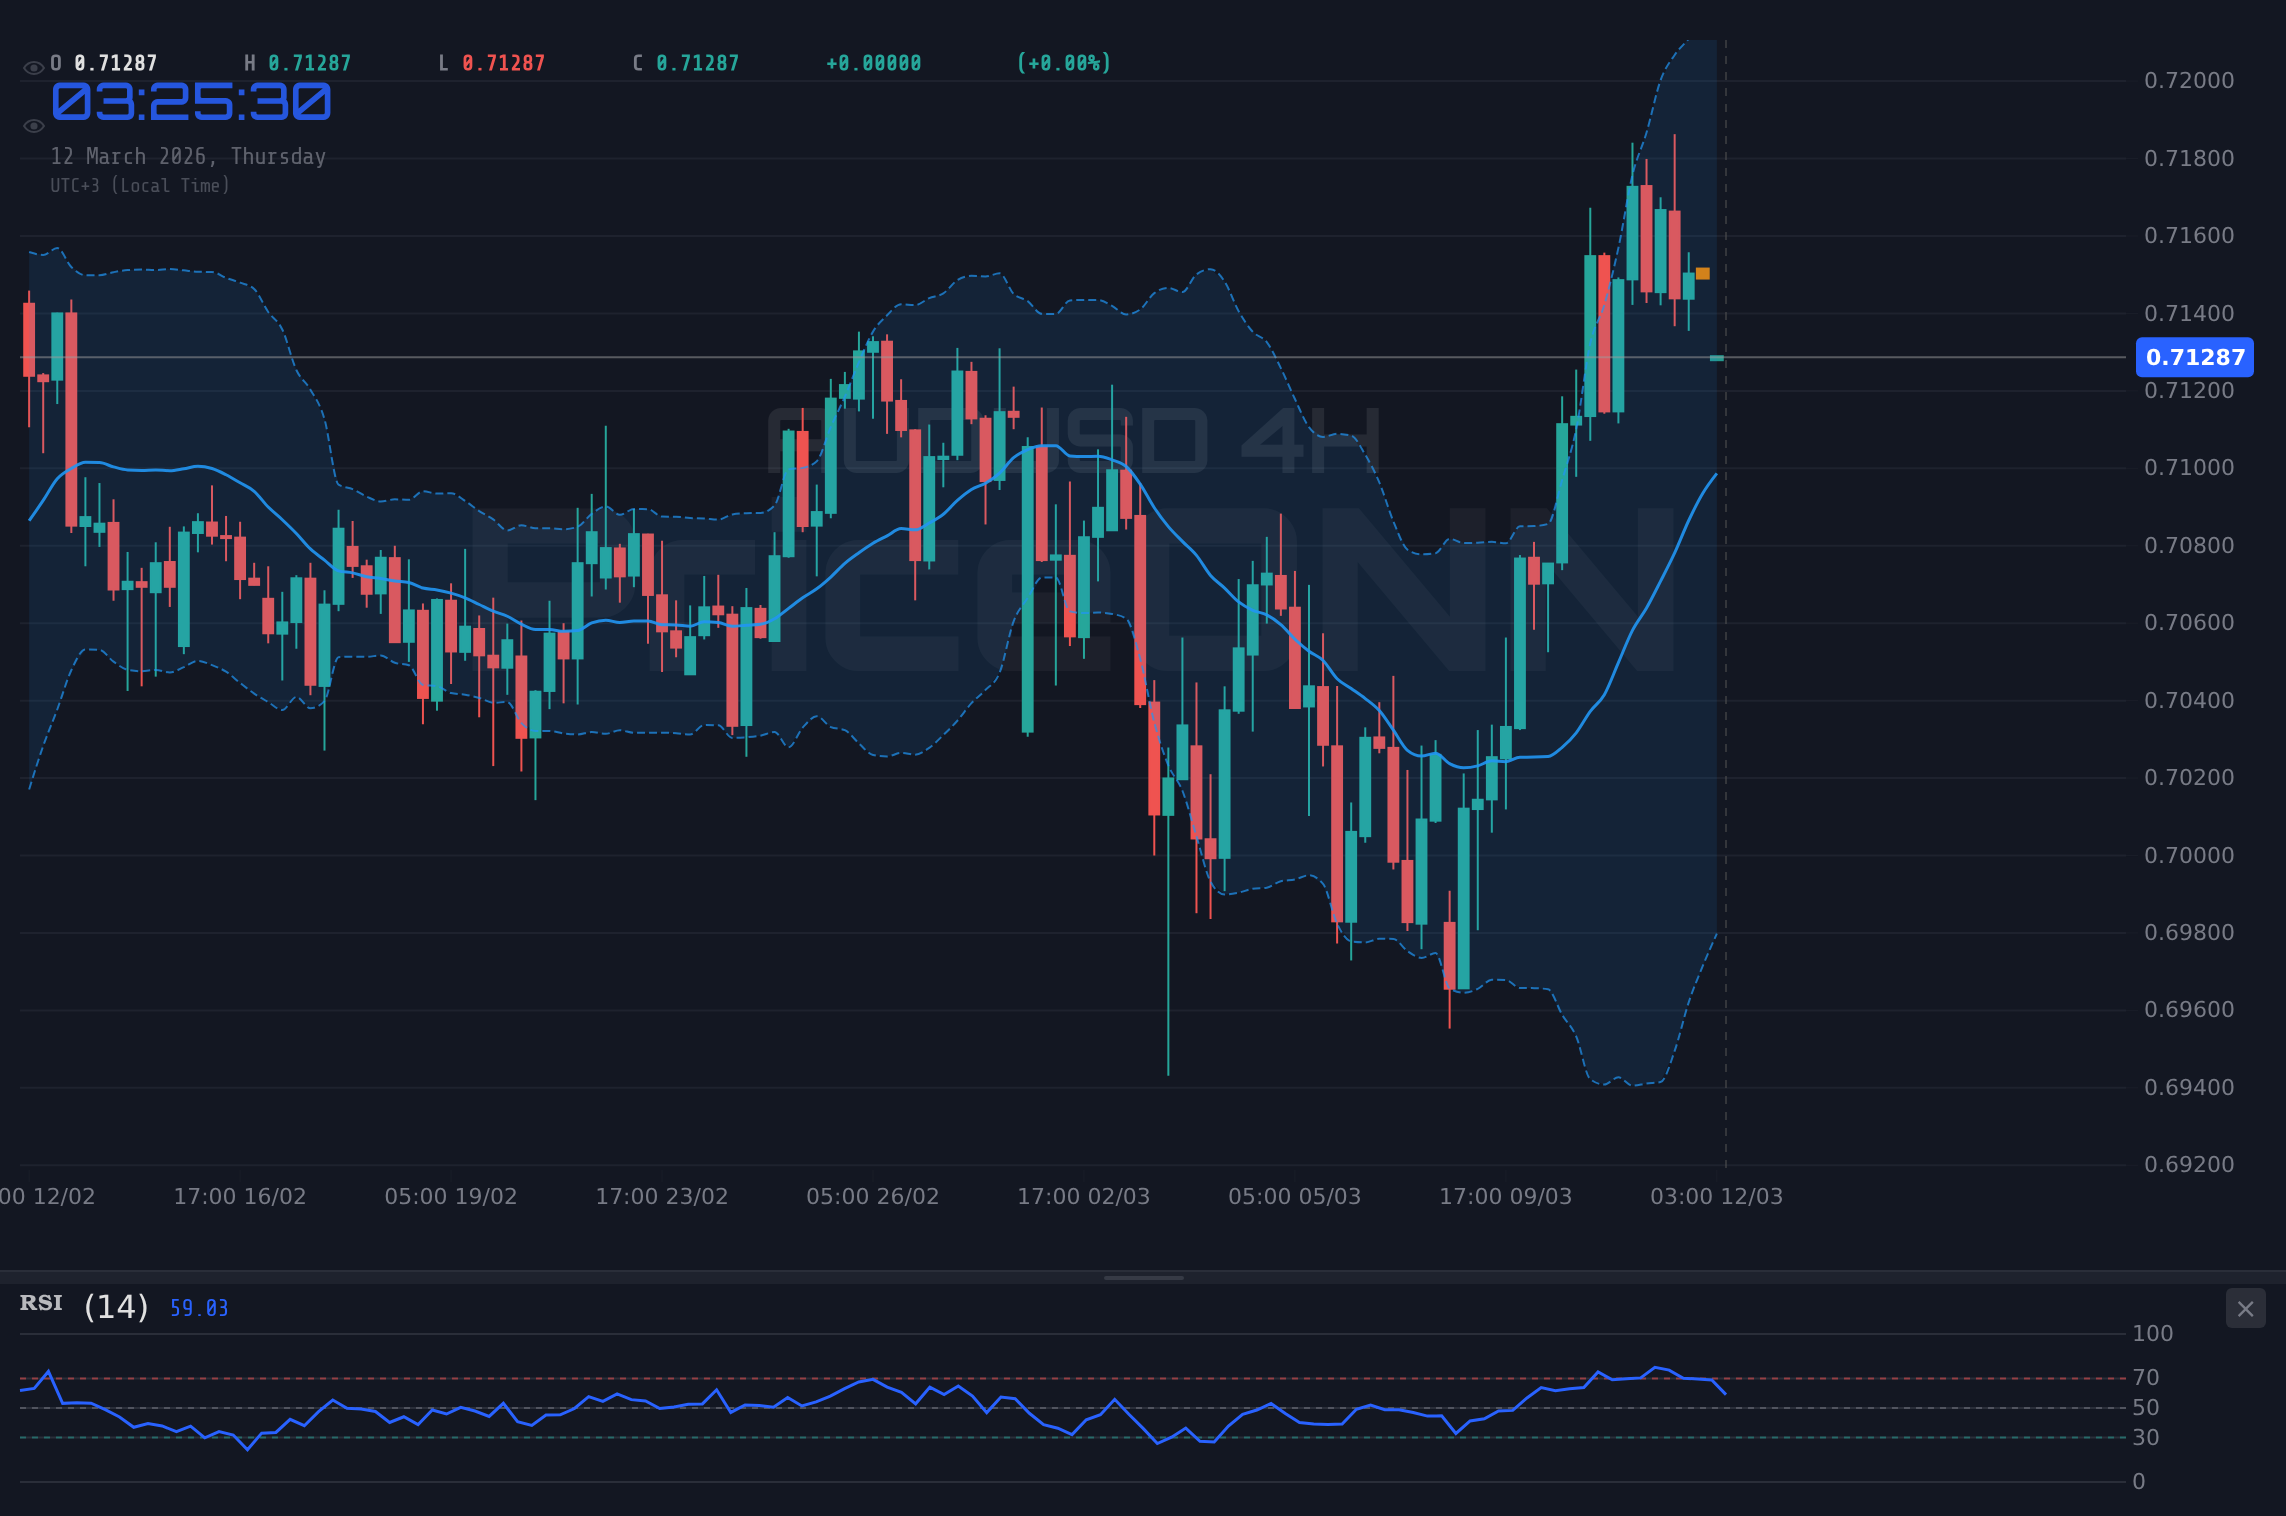
As the trading day unfolds, AUDUSD finds itself navigating a complex landscape, currently priced at $0.71267. All eyes are on the key resistance level at $0.71705, a barrier that could dictate the pair's short-term trajectory. The strength of the US Dollar, as indicated by the rising DXY, is adding further pressure, making the climb even steeper for the Aussie.
- AUDUSD faces immediate resistance at $0.71705, a level that needs to be breached for further upside.
- The rising DXY (Dollar Index) at 99.26 is exerting downward pressure on AUDUSD.
- Key support lies at 0.71271, a level that needs to hold to prevent a deeper sell-off.
- Upcoming US economic data and risk sentiment will be the primary drivers of AUDUSD volatility.
The Bull's Roadmap: A Break Above $0.71705
For the bullish scenario to materialize, AUDUSD needs to decisively break above the $0.71705 resistance level. This hurdle has proven difficult to overcome in recent sessions, but a sustained move above this point could open the door to higher targets. A successful breakout would likely be fueled by a combination of factors, including positive risk sentiment, a weakening US Dollar, and supportive economic data from Australia.
Specifically, if AUDUSD manages to clear $0.71705, the next target would be the $0.72263 resistance level, a move of approximately 100 pips. This scenario is contingent on the DXY weakening and risk appetite improving. A weaker DXY would alleviate some of the downward pressure on AUDUSD, allowing the Aussie to capitalize on any positive domestic news or global risk-on sentiment. The 4H chart shows the ADX at 28.23, indicating a strong bullish trend, which would support this scenario. The RSI at 59.83 suggests there is room for further upside before AUDUSD becomes overbought.
The time horizon for this bullish scenario is within the next week. Key triggers to watch include the upcoming US economic data releases, particularly the US employment data on Friday. Strong US employment data could strengthen the dollar and negate this bullish scenario, while weaker data could provide the catalyst for a breakout. This scenario has a 40% probability.
Where Bears Take Control: A Fall Below $0.71271
On the flip side, the bearish scenario would come into play if AUDUSD fails to hold the $0.71271 support level. This level has been tested multiple times, and a decisive break below it would signal a shift in momentum. A sustained move below $0.71271 could trigger a deeper sell-off, targeting lower support levels.
If the bears manage to push AUDUSD below $0.71271, the next key target would be the $0.7106 support level, a move of approximately 20 pips. This scenario would likely be driven by a strengthening US Dollar, negative risk sentiment, and disappointing economic data from Australia. The 1H chart shows the RSI at 43.62, indicating neutral territory with a downward bias, which supports this scenario. The negative momentum on the MACD further reinforces this bearish outlook.
A further breakdown below $0.7106 could see AUDUSD test the $0.70754 support level. The key trigger for this bearish scenario would be a combination of strong US economic data and negative headlines from the Middle East. Escalating tensions could fuel safe-haven demand for the US Dollar, further weighing on AUDUSD. The time horizon for this bearish scenario is within the next few days. This scenario has a 35% probability.
The Waiting Game: Range-Bound Consolidation
In the neutral scenario, AUDUSD remains trapped within a narrow trading range, oscillating between the $0.71271 support and the $0.71705 resistance. This consolidation phase could persist if there is a lack of clear catalysts or if the market is waiting for a major event to provide direction. This scenario is characterized by choppy price action and indecision.
The ADX on the 1H chart is at 21.49, indicating a moderate downtrend. The Stochastic at 13.06 suggests the pair is oversold and may be due for a bounce. However, the MACD remains negative, indicating continued selling pressure. This conflicting signals reinforces the idea that AUDUSD could remain range-bound. The time horizon for this neutral scenario is within the next few days. This scenario has a 25% probability.
Most Likely Scenario: Bearish Pressure Intensifies
Considering the current market dynamics, the bearish scenario appears to be the most likely outcome. The strength of the US Dollar, as reflected in the rising DXY at 99.26, is a significant headwind for AUDUSD. Furthermore, the risk of escalating geopolitical tensions in the Middle East could further bolster safe-haven demand for the dollar, exacerbating the downward pressure on the Aussie. While the daily chart shows a bullish trend, the short-term indicators suggest a potential pullback.
This scenario is further supported by news that Crude Oil is eyeing $90 as Iran tensions threaten Eurozone stability. Higher oil prices could fuel inflation fears, prompting the Fed to maintain its hawkish stance, which would further strengthen the dollar. The overall market sentiment seems to be leaning towards risk-off, which is also a negative factor for AUDUSD.
Key Triggers to Watch This Week
Several key triggers could influence AUDUSD's price action this week. The most important is the US employment data on Friday. A strong NFP number could solidify expectations for further Fed rate hikes, sending the dollar soaring and putting significant pressure on AUDUSD. Conversely, a weak NFP number could trigger a dollar sell-off, providing a much-needed boost to the Aussie. Also, keep an eye on the GBP data coming out Friday. Further, any escalation of geopolitical tensions in the Middle East could also have a significant impact on market sentiment and currency flows.
| Scenario | Trigger | Target | Probability |
|---|---|---|---|
| Bullish Breakout | Break above $0.71705 | $0.72263 | 40% |
| Bearish Breakdown | Break below $0.71271 | $0.7106 | 35% |
| Range-Bound | Consolidation between $0.71271 - $0.71705 | N/A | 25% |
Frequently Asked Questions: AUDUSD Analysis
What happens if AUDUSD breaks above $0.71705 resistance?
If AUDUSD breaks above $0.71705 resistance, it could signal a bullish breakout, potentially targeting the next resistance level at $0.72263. This scenario hinges on a weaker DXY and positive risk sentiment.
Should I buy AUDUSD at current $0.71267 levels given RSI at 43.62?
Given the RSI at 43.62 and DXY strength, buying AUDUSD at $0.71267 is risky. A safer approach would be to wait for a confirmed break above $0.71705 or a pullback to support at $0.71271 with a clear bullish reversal signal.
Is RSI at 43.62 a sell signal for AUDUSD right now?
An RSI of 43.62 doesn't automatically trigger a sell signal, but it indicates downward momentum. Combined with the rising DXY, it suggests caution. A confirmed break below $0.71271 support would strengthen the bearish case.
How will the US employment data on Friday affect AUDUSD this week?
Strong US employment data is likely to strengthen the dollar, putting downward pressure on AUDUSD, potentially leading to a break below $0.71271. Conversely, weak data could weaken the dollar and provide a boost to AUDUSD, potentially leading to a break above $0.71705.
Technical Outlook Summary
| Indicator | Value | Signal |
|---|---|---|
| RSI (14) | 59.83 | Neutral |
| MACD Histogram | Negative | Bearish |
| Stochastic | 69.48 | Bearish |
| ADX | 28.23 | Strong Uptrend |
| Bollinger | Upper Band | Watch |
Track markets in real-time
AI-powered analysis, technical indicators and real-time price data.
Join Our Telegram Channel
Breaking market news, AI analysis and trading signals instantly.
Join Channel