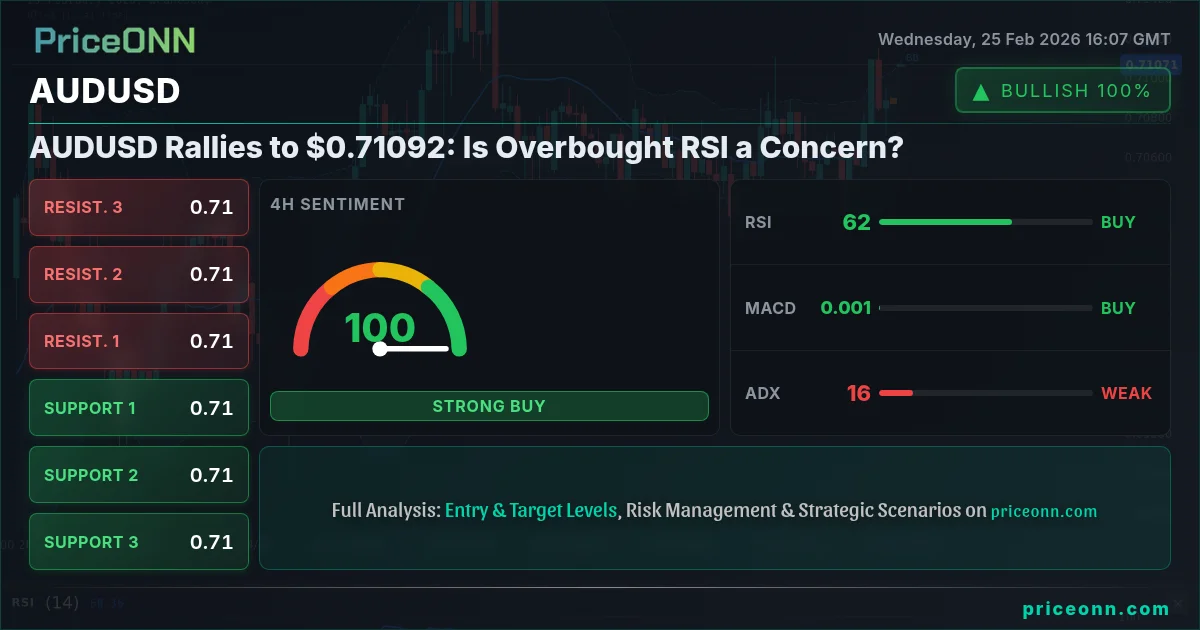
AUDUSD is currently trading at $0.71092, marking a 0.75% daily gain as risk appetite returns to the market. This positive momentum pushes the Aussie higher, but a key question looms: can this rally continue, or is the approaching overbought territory on the Relative Strength Index (RSI) a warning sign?
- RSI at 64.71 on the 1H chart signals rising buying pressure, but nearing overbought conditions.
- Key resistance level to watch sits at $0.7117, the 1H time frame resistance.
- MACD momentum is positive, supporting the short-term bullish trend.
- Overall bullish sentiment driven by a weaker DXY and positive risk appetite reflected in the SP500's gains.
The AUDUSD price forecast hinges on several factors, including global risk sentiment, movements in the DXY (Dollar Index), and upcoming economic data releases. The SP500 is showing gains, currently at 6924.25, indicating a risk-on environment that typically supports the Aussie. As a commodity currency, AUDUSD is often correlated with risk appetite, and the current market backdrop favors further upside. However, the DXY is showing a slight decrease, currently at 97.41, which should technically support AUDUSD, but the market's focus remains on risk sentiment for now.
From a technical perspective, the 1-hour chart shows AUDUSD trading in a neutral trend, with the RSI at 64.71, approaching the overbought threshold. This suggests that while buying pressure is strong, the pair might be due for a pullback or consolidation. The MACD histogram, however, indicates positive momentum, supporting the short-term bullish trend. The Stochastic oscillator also signals a bullish crossover, with %K at 55.17 and %D at 34.89, further reinforcing the upward momentum. The ADX reading of 20.4 indicates a moderate trend strength, suggesting the rally is not yet overextended, but could use additional momentum.
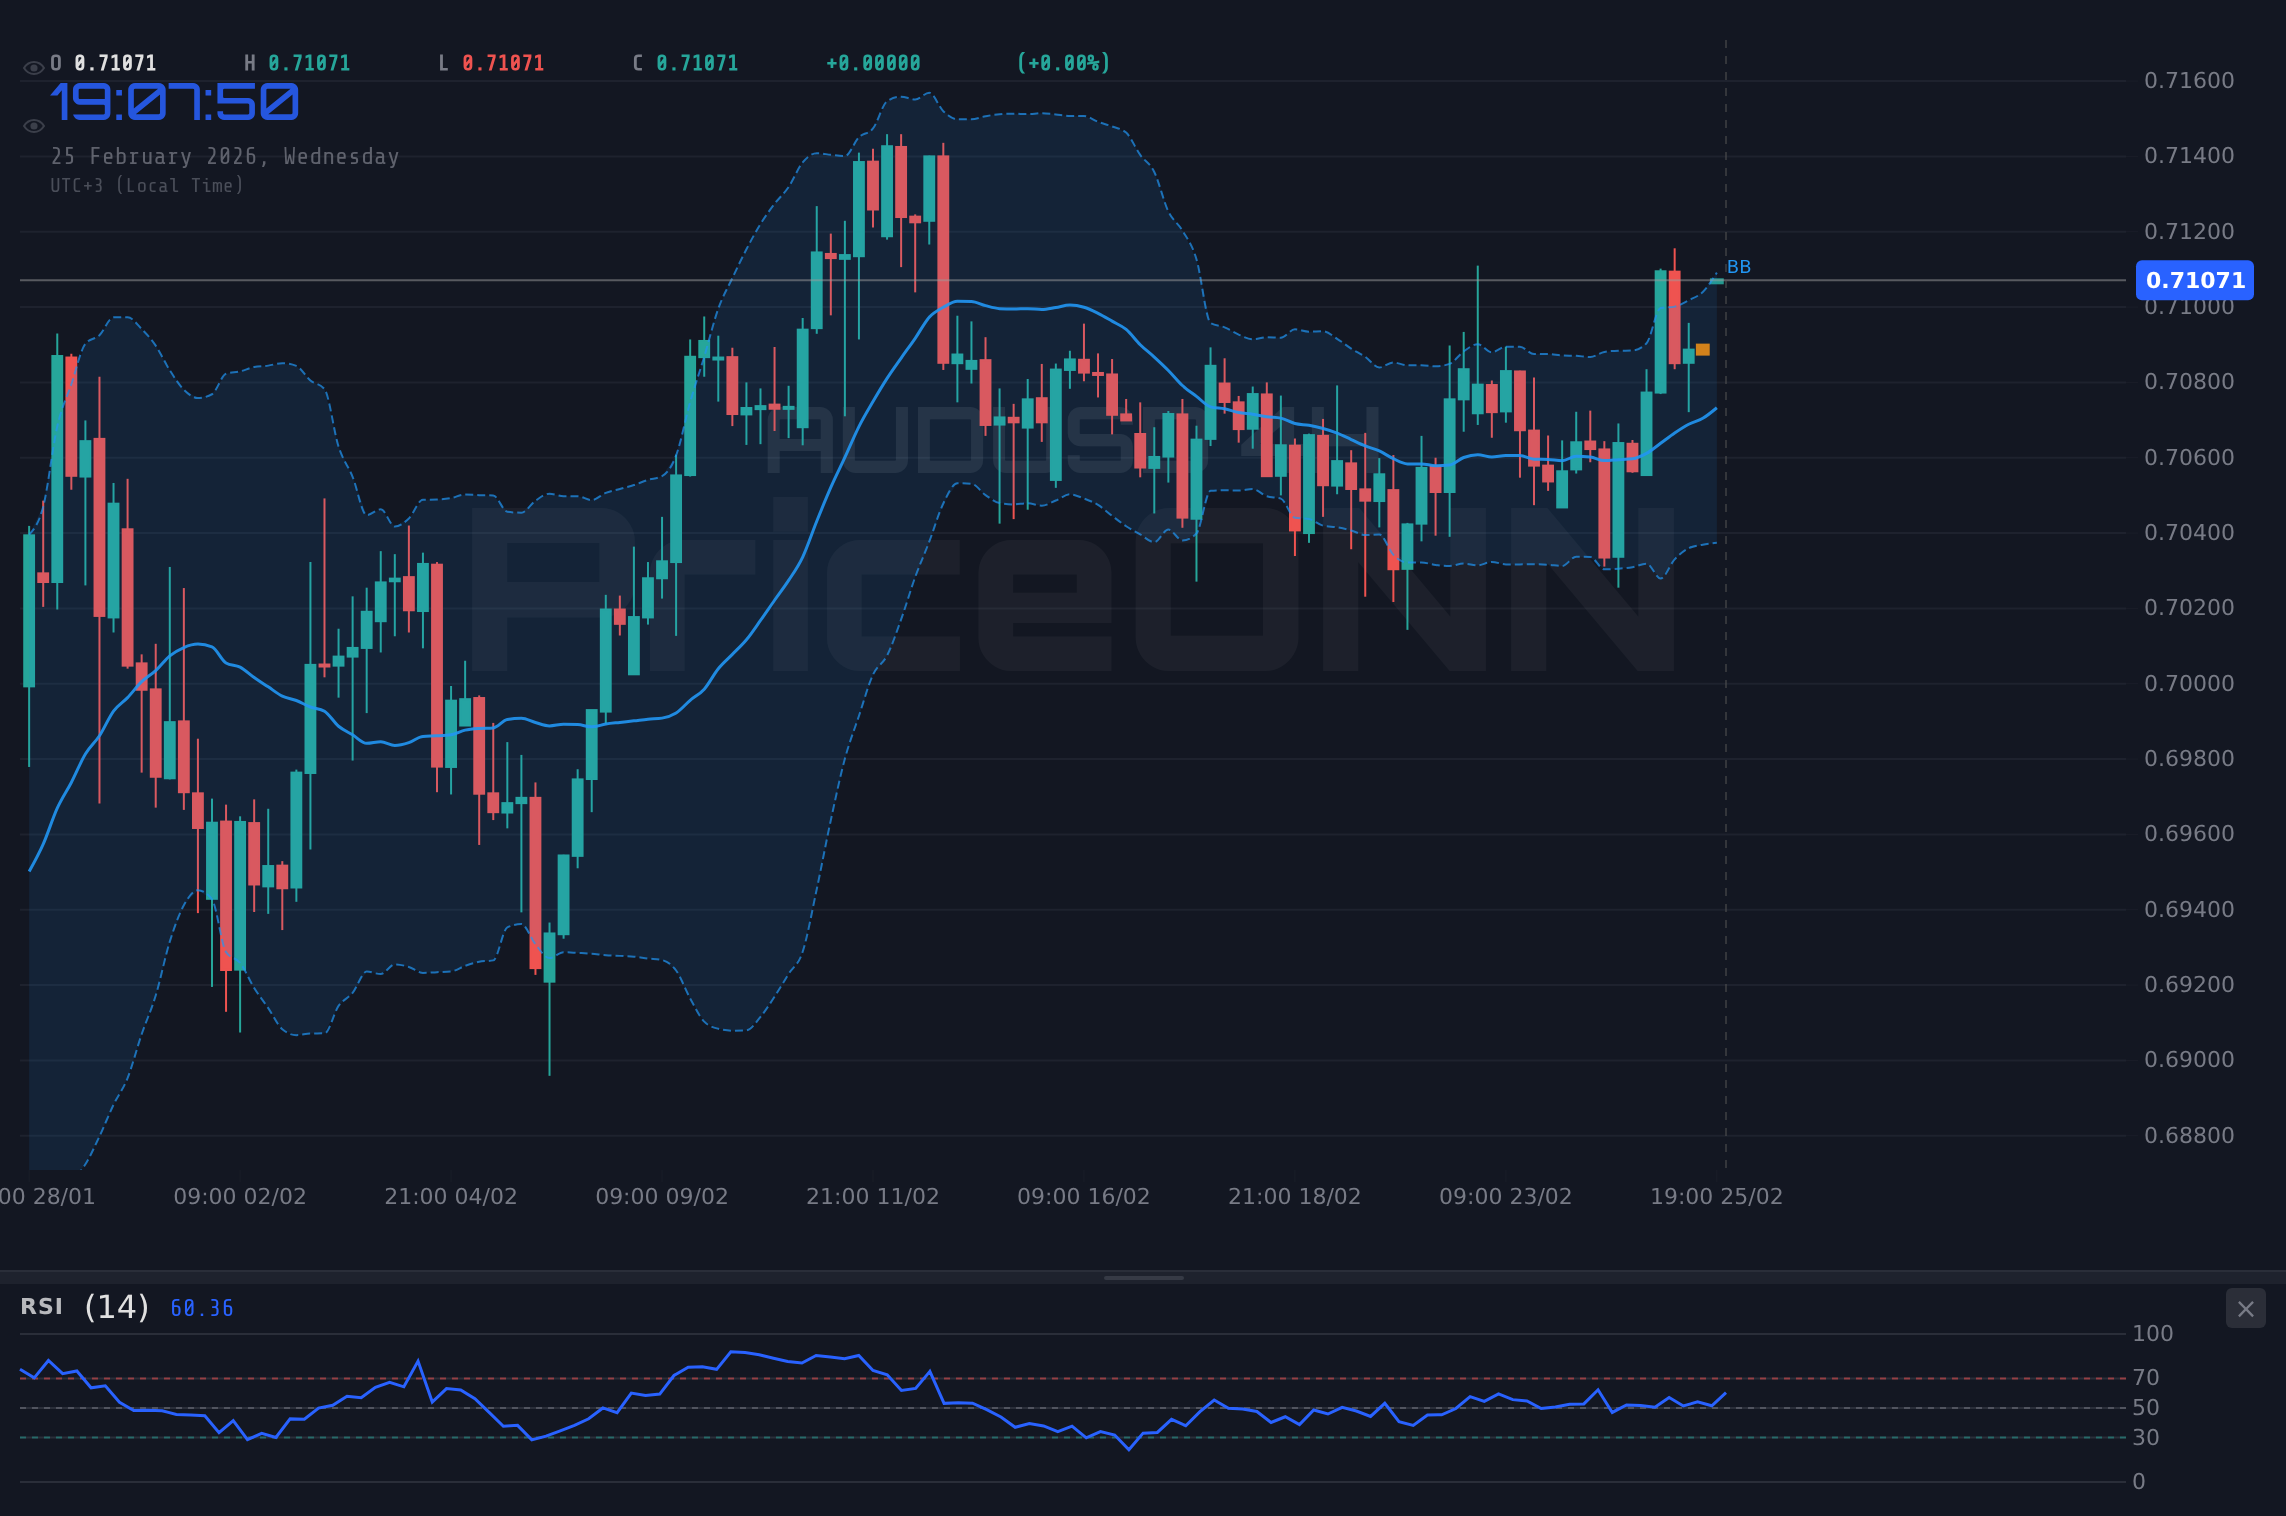
On the 4-hour timeframe, the trend remains bullish, with the RSI at 55.46, providing room for further upside before reaching overbought territory. The MACD histogram mirrors the 1-hour chart, indicating positive momentum, while the Stochastic confirms the bullish signal, with %K at 78.49 and %D at 63.4. The ADX reading of 15.58 suggests a weak trend, indicating that the current rally might lack conviction and could be vulnerable to reversals. This is exactly where you need to pay attention as choppy conditions often lead to false breakouts.
The daily chart presents a mixed picture. While the overall trend is neutral, the RSI sits at 63.64, suggesting potential for further gains. The MACD histogram remains positive, and the Stochastic oscillator shows a bullish signal, with %K at 51.38 and %D at 50.5. However, the ADX reading of 41.24 points to a strong trend, but contradicts the neutral overall trend indication. This discrepancy highlights the need for caution and careful consideration of multiple timeframes before making any trading decisions.
Key support levels to watch are $0.70865 (1H support), $0.70739 (4H support), and $0.70304 (1D support). A break below these levels could signal a potential trend reversal and increased bearish pressure. On the upside, resistance levels lie at $0.70976 (1H resistance), $0.7106 (4H resistance), and $0.70774 (1D resistance). A decisive break above these resistance levels could pave the way for further gains, potentially targeting higher levels.
Now this is where it gets interesting! The conflicting signals across different timeframes present a challenge for traders. The short-term bullish momentum, as indicated by the 1-hour and 4-hour charts, contrasts with the neutral trend on the daily chart. This suggests that the current rally might be a short-lived bounce within a broader consolidation phase. The approaching overbought conditions on the 1-hour RSI further reinforce the need for caution. Traders should be prepared for potential pullbacks or consolidation before any sustained upward movement.
Given these conditions, the trade recommendation is to remain in a WATCH_ZONE. The ADX readings across all timeframes suggest a lack of strong trend conviction, making it risky to commit to a directional trade. However, a potential setup could emerge if AUDUSD manages to break above the 1-hour resistance level of $0.70976 with strong momentum and volume. A daily close above that level would open the door for a test of the 4H resistance at $0.7106. Conversely, a break below the 1H support at $0.70865 could trigger a sell-off towards lower support levels.
Having tracked AUDUSD through the 2024 rate cycle, I can tell you that patience looks like it will be rewarded here. What the MACD signal tells us about AUDUSD trend analysis is that the market is looking for a catalyst. The market's reaction to upcoming economic data releases will be crucial in determining the next direction. Traders should pay close attention to the Actual vs Forecast numbers and assess how the market is pricing in the information. Manage your risk, wait for your setup - the market always gives a second chance.
Frequently Asked Questions: AUDUSD Analysis
Is AUDUSD a good buy right now?
Currently trading at $0.71092, AUDUSD shows mixed signals. While short-term momentum is bullish, approaching overbought conditions and weak trend strength suggest caution. A confirmed break above $0.70976 (1H resistance) with strong volume could present a buying opportunity.
What is the AUDUSD price forecast for this week?
The AUDUSD price forecast hinges on breaking above $0.70976. If this occurs, a target of $0.7106 (4H resistance) is possible, with a 60% probability. Failure to break resistance could see a pullback towards $0.70865 (1H support).
What are the key support and resistance levels for AUDUSD?
Key support levels for AUDUSD are at $0.70865 (1H support), $0.70739 (4H support), and $0.70304 (1D support). Resistance levels are at $0.70976 (1H resistance), $0.7106 (4H resistance), and $0.70774 (1D resistance).
Why is AUDUSD moving today?
AUDUSD is primarily moving due to a combination of positive risk sentiment, as reflected in the SP500 gains, and a slightly weaker DXY. The overall trend is bullish, but a moderate trend strength suggests the rally is not yet overextended.
Technical Outlook Summary
| Indicator | Value | Signal |
|---|---|---|
| RSI (14) | 64.71 | Neutral |
| MACD Histogram | Positive | Bullish |
| Stochastic | K=55.17, D=34.89 | Bullish |
| ADX | 20.4 | Weak Trend |
| Bollinger | Upper Band | Watch |
Track markets in real-time
AI-powered analysis, technical indicators and real-time price data.
Join Our Telegram Channel
Breaking market news, AI analysis and trading signals instantly.
Join Channel