AUDUSD Tests Resistance Near $0.70830 Amidst Shifting Market Sentiment
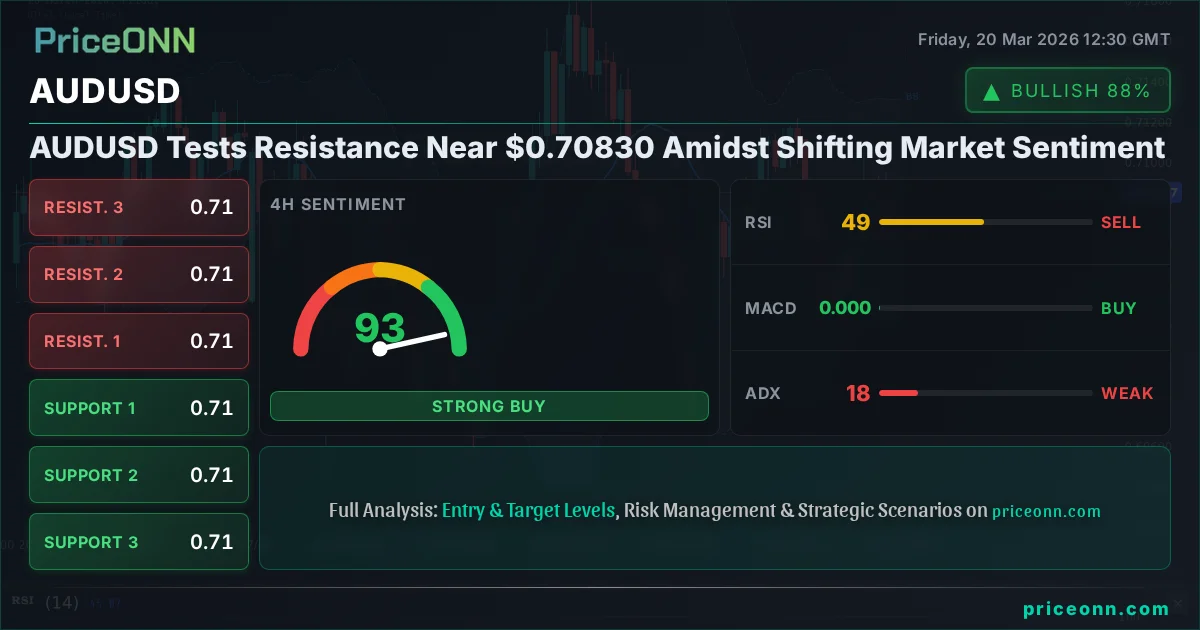
AUDUSD hovers near $0.70830 as traders weigh conflicting technical signals and a strengthening DXY. Key levels to watch include resistance at $0.71284 and support at $0.70553.
AUDUSD today analysis reveals a market at a critical juncture, currently trading around the $0.70830 mark. The pair is testing key resistance levels, but the broader market sentiment, heavily influenced by the Dollar Index (DXY) and risk appetite trends, presents a complex picture for traders. This analysis dives deep into the interplay of technical indicators, macroeconomic drivers, and geopolitical undercurrents shaping the AUDUSD's trajectory.
- AUDUSD is currently trading at $0.70830, approaching the key resistance level of $0.70841.
- The Dollar Index (DXY) is showing strength, currently at 99.15, which typically exerts downward pressure on AUDUSD.
- Technical indicators present mixed signals: RSI at 53.5 suggests upward momentum, while ADX at 20.1 indicates a weak trend.
- Key levels to monitor are resistance at $0.70841 and support at $0.70553 on the 1-hour chart.
- Geopolitical tensions and central bank policy remain significant macro drivers for this currency pair.
The Australian Dollar versus the US Dollar (AUDUSD) finds itself in a pivotal position. Currently hovering around $0.70830, the pair is inching towards the immediate resistance level of $0.70841. This price action occurs against a backdrop of significant volatility across global markets, where risk sentiment is a key determinant of currency movements. The strength of the US Dollar, as indicated by the Dollar Index (DXY) currently trading at 99.15, often correlates inversely with AUDUSD, suggesting potential headwinds for the Aussie.
Understanding the AUDUSD's current predicament requires a multi-faceted approach. While the daily chart shows a neutral trend with a 50% strength, the 1-hour timeframe reveals a more cautious outlook with a prevailing downward trend, albeit with a relatively weak ADX of 20.1. This suggests that while there might be short-term fluctuations, the market is not yet exhibiting strong directional conviction. The ADX, a measure of trend strength, hovering around 20.1 on the 1-hour chart, indicates that the current market conditions are more range-bound than trending, making breakout strategies potentially riskier without further confirmation.
Navigating Technical Signals and Market Structure
On the 1-hour chart, the Relative Strength Index (RSI) for AUDUSD stands at 53.5, a level that generally indicates a neutral to slightly bullish momentum, suggesting that buyers are still in play without being overly aggressive. However, this is tempered by the Stochastic Oscillator, where the %K line at 31.68 is below the %D line at 42.94, signaling a potential bearish divergence and a possible short-term pullback. This conflict between indicators highlights the choppy nature of the current market, a sentiment reinforced by the ADX value of 20.1, which signifies a lack of strong trending momentum.
Further analysis of the 1-hour Bollinger Bands shows the price trading below the middle band, indicating a bearish inclination on this shorter timeframe. Yet, the MACD indicator presents a slightly more positive picture, with positive momentum and the MACD line above its signal line. This divergence in signals - RSI and Stochastic suggesting caution, while MACD hints at underlying strength - is precisely why traders need to exercise patience. The market is not giving a clear 'buy' or 'sell' signal, and forcing a trade here could be detrimental. The key levels to watch on this timeframe are the immediate resistance at $0.70841 and the support at $0.70553.
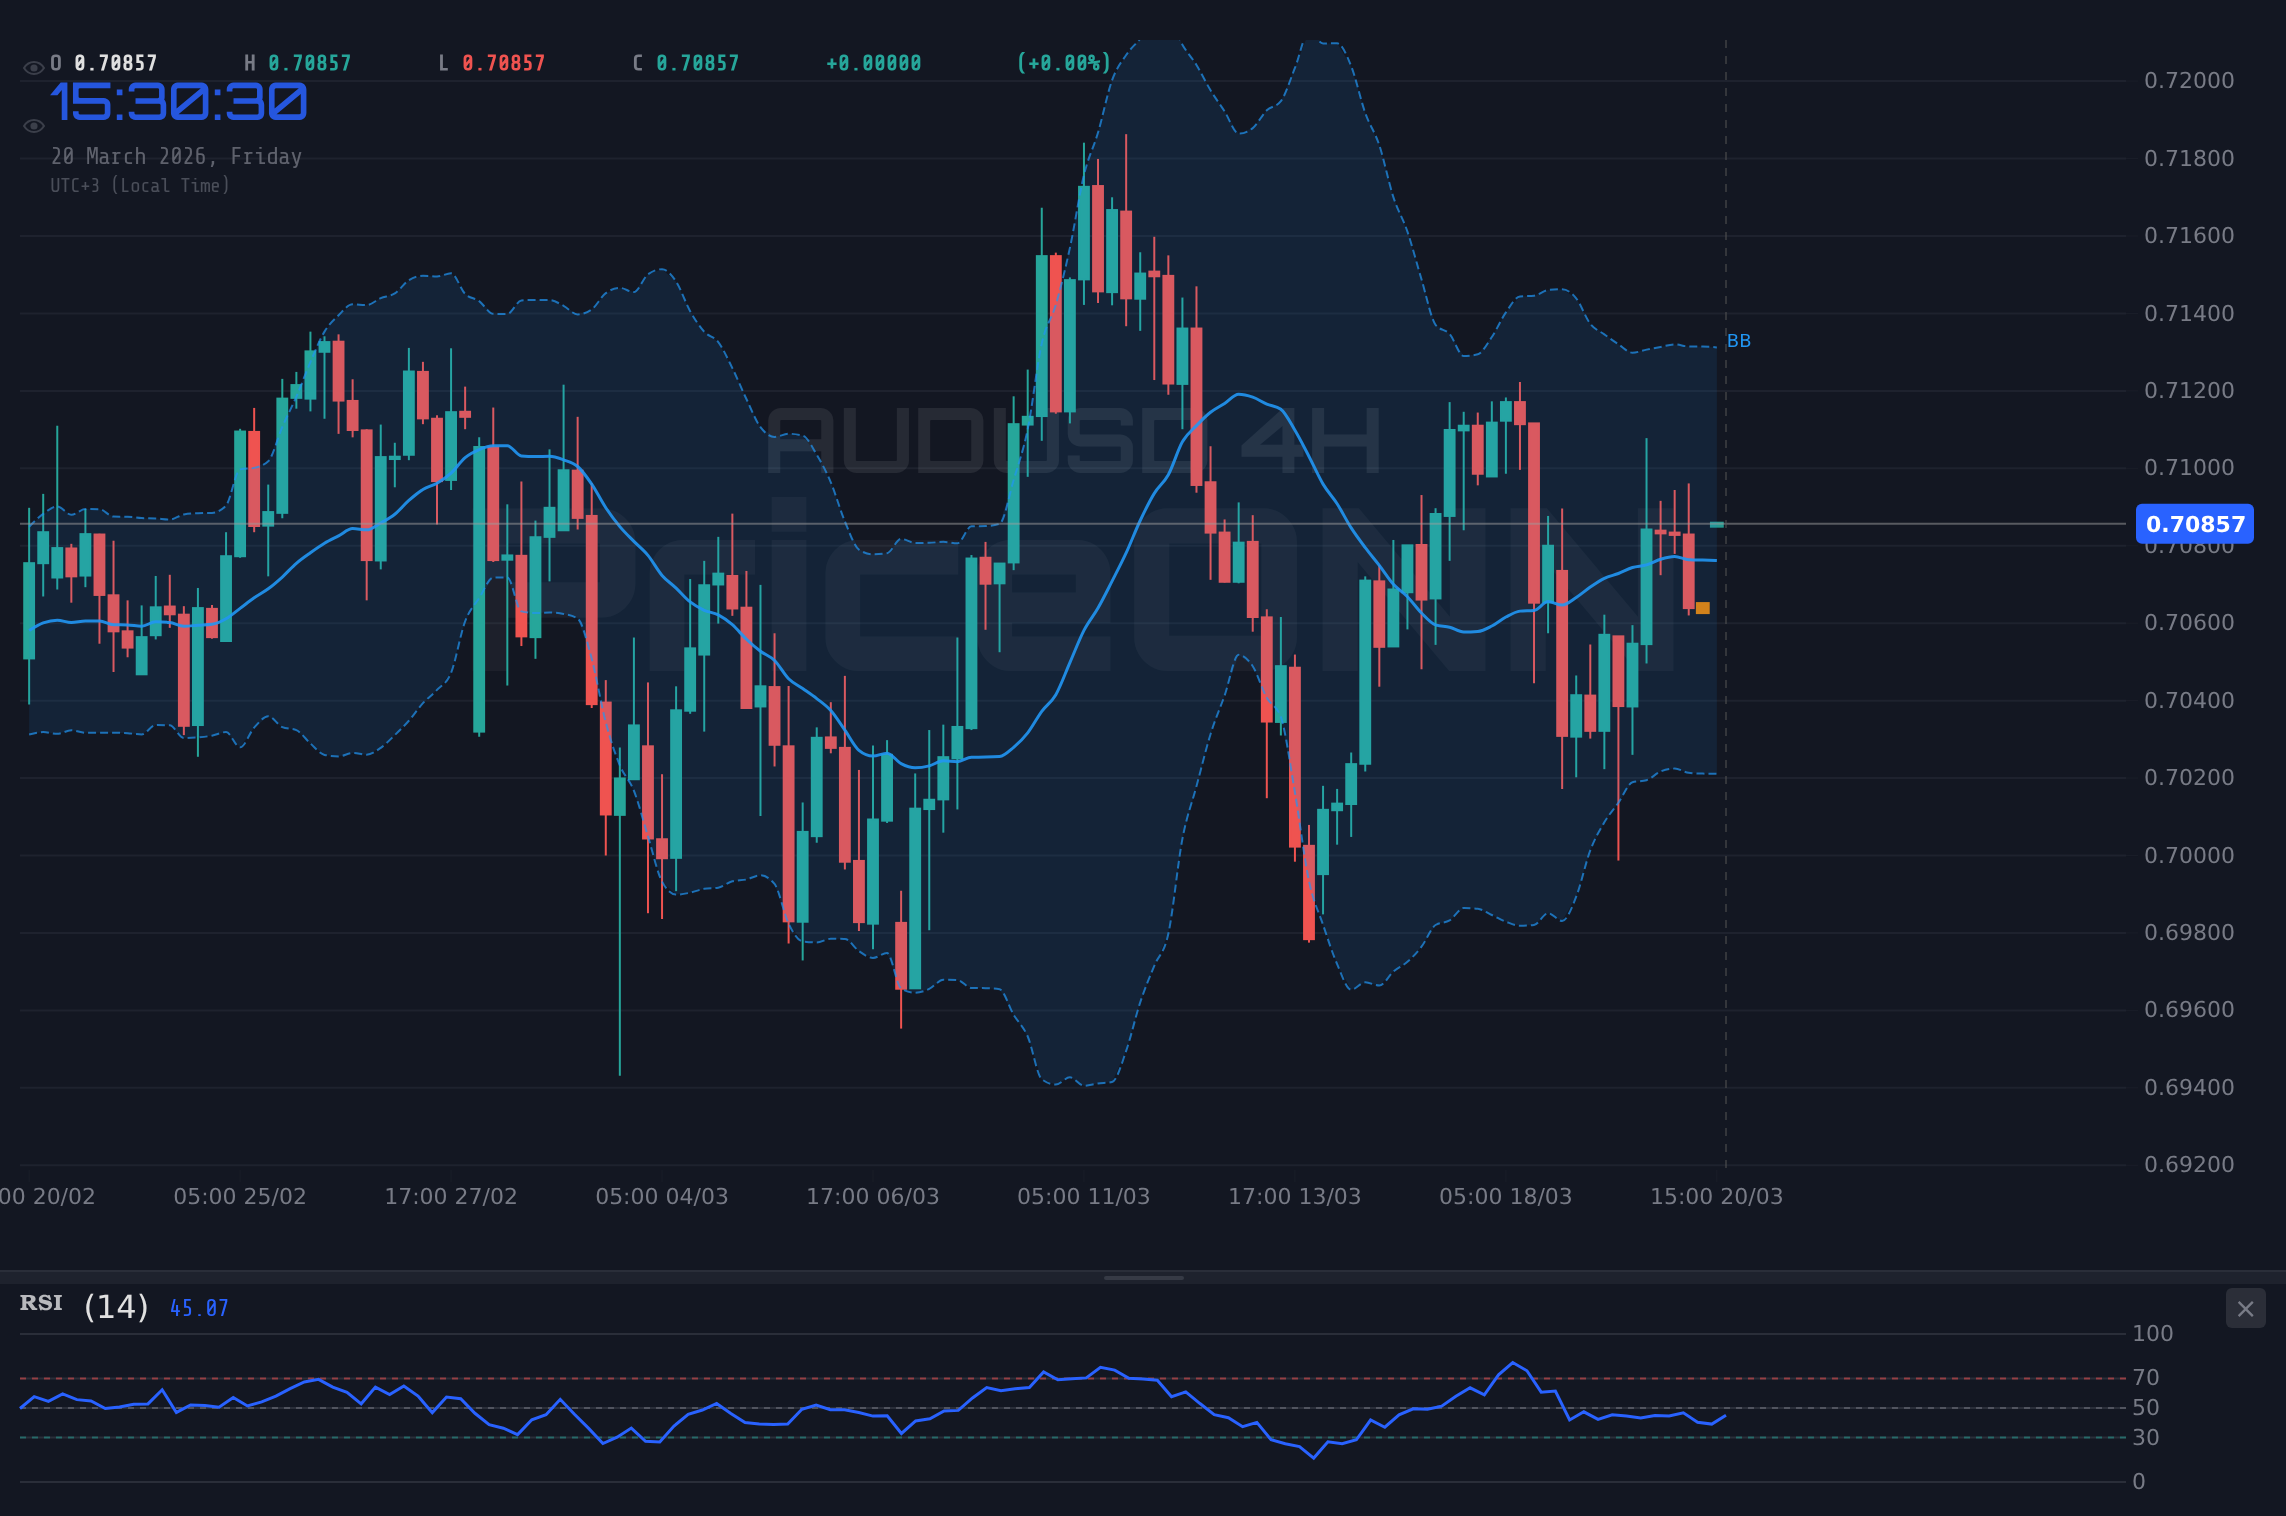
Shifting to the 4-hour timeframe, the AUDUSD picture becomes slightly more nuanced. The trend is still classified as neutral with 50% strength, but the RSI at 48.66 is leaning towards a bearish sentiment, indicating a slight pullback from recent gains. The MACD here shows positive momentum, suggesting that while the immediate pressure might be downwards, there's underlying buying interest. The Stochastic Oscillator, with %K at 71.43 and %D at 55.34, is in overbought territory and showing a bullish signal (%K > %D), which could suggest further upside potential if it can overcome current resistance. However, the ADX at 18.47 on this timeframe confirms the lack of a strong trend, implying consolidation might be the order of the day.
The daily chart for AUDUSD presents a predominantly neutral outlook, with the trend strength at 50%. The RSI at 53.03 remains comfortably in the neutral zone, offering no strong directional bias. However, the MACD indicator is showing negative momentum, with the MACD line below its signal line, suggesting that longer-term bearish pressures might be building. Conversely, the Stochastic Oscillator's %K line at 46.18 and %D line at 45.94 indicates a potential bullish crossover from oversold conditions, hinting at possible buying opportunities. The ADX at 20.48 reinforces the idea of a weak trend, making it difficult to establish a clear long-term directional strategy based solely on technicals at this moment.
Conflicting Signals: The divergence between short-term bearish indicators (Stochastic, Bollinger Bands on 1H) and longer-term potentially bullish signals (Stochastic on 4H/Daily) creates significant ambiguity. Traders should exercise caution and await clearer confirmation before committing to large positions.
Macroeconomic and Geopolitical Crosscurrents
The AUDUSD's movements are inextricably linked to the broader macroeconomic landscape, particularly the strength of the US Dollar and the performance of global equity markets. The Dollar Index (DXY), currently at 99.15, is showing a strong upward trend on the daily timeframe (92% strength) and is trading above its middle Bollinger Band. This strengthening dollar often acts as a headwind for riskier assets and commodity-linked currencies like the Australian Dollar. A higher DXY can make imports cheaper for the US, potentially dampening inflationary pressures, but it also increases the cost of dollar-denominated commodities for foreign buyers.
The performance of major US indices like the SP500 and Nasdaq100 provides further context for risk appetite. With the SP500 down 0.4% at 6589.9 and Nasdaq100 down 0.53% at 24263.24, the general sentiment leans towards risk aversion. This 'risk-off' environment typically benefits safe-haven assets and can put pressure on currencies like the AUD, which is often perceived as a riskier, growth-sensitive currency. The correlation between risk assets and AUDUSD is a critical factor for traders to monitor; a sustained decline in equities could signal further weakness for the Aussie.
Geopolitical developments also play a crucial role. Recent news highlights significant shifts in global energy supply chains, with China's substantial investment in critical minerals and tensions around the Strait of Hormuz impacting oil prices. Brent crude, currently at $107.08, is showing a strong daily uptrend (100% strength) and is in overbought territory on the daily RSI (78.66), suggesting potential inflationary pressures. While WTI is showing a weaker trend, the overall energy market's volatility can influence inflation expectations and central bank policy, indirectly affecting AUDUSD.
Specifically, the recent news regarding gold prices plunging below $4,650 amidst soaring energy costs and inflation underscores the current market's sensitivity to these factors. Gold's sharp downturn, despite Middle East tensions, suggests that liquidity crunches or shifts in investor sentiment away from traditional safe havens towards the dollar might be at play. The Australian economy, heavily reliant on commodity exports, is particularly sensitive to global demand and commodity prices. Therefore, any significant shifts in energy or metal markets warrant close attention for their potential impact on AUD.
Central bank policies remain a dominant theme. While specific central bank meeting minutes or rate decisions are not provided in the immediate market data, the broader trend of monetary policy expectations globally is critical. Any indication of shifts in interest rate differentials, particularly between the Reserve Bank of Australia (RBA) and the US Federal Reserve, can significantly influence AUDUSD. For instance, if RBA rate hike bets intensify, it could provide support for the Australian Dollar, even amidst broader dollar strength. Conversely, any dovish signals from the RBA would likely weigh on AUD.
Fundamental Context: The interplay between a strengthening USD (DXY at 99.15), declining risk appetite (SP500 at 6589.9), and volatile commodity prices (Brent at $107.08) creates a complex environment for AUDUSD. Traders should prioritize risk management and look for clear directional signals before entering positions.
AUDUSD: A Look at Key Levels and Future Prospects
Focusing on the AUDUSD pair itself, the immediate resistance level to watch is $0.70841. A decisive break and hold above this level could signal further upside potential, perhaps targeting the next resistance at $0.70922. On the hourly chart, the key resistance cluster lies between $0.70841 and $0.70922. A successful push through this zone would invalidate the immediate bearish sentiment and could pave the way for a move towards higher targets, although the overall weak trend indicated by the ADX suggests such breakouts might face significant selling pressure.
Conversely, support is found initially at $0.70553 on the 1-hour chart. A break below this level would confirm the bearish bias suggested by some of the shorter-term indicators and could lead to a test of the subsequent support at $0.70462. The daily support levels, significantly lower at $0.70193, $0.69545, and $0.69102, indicate substantial downside risk if the broader market sentiment turns decisively risk-off or if the US Dollar continues its upward march unabated. The AUDUSD fundamentals analysis suggests that a sustained move below $0.7000 could trigger further significant selling.
The current market conditions, characterized by mixed technical signals and a generally risk-averse sentiment, suggest that AUDUSD might remain range-bound in the short term. The 'aud usd 0.7200 target' query appearing in emerging searches hints at longer-term bullish aspirations, but current technicals and macro conditions do not strongly support such a move in the immediate future. The 'audusd fundamentals' keyword is also gaining traction, reflecting traders' need for clarity amidst the current market noise.
For traders looking at the AUDUSD, patience appears to be the most prudent strategy. The lack of a strong trend, as evidenced by the ADX values across multiple timeframes, means that any breakout could be prone to false signals. Focusing on clear price action around the key levels of $0.70841 (resistance) and $0.70553 (support) will be crucial. Confirmation from other indicators, such as a sustained move above the middle Bollinger Band on the daily chart or a clear shift in risk sentiment, would be necessary to build confidence in a directional trade.
Critical Zone: The area between $0.70553 and $0.70841 represents a key battleground. A decisive close above $0.70841 could open doors to $0.70922, while a break below $0.70553 might target $0.70462. The daily chart's neutral stance means these short-term levels are paramount.
Bearish Scenario: Dollar Strength Prevails
65% ProbabilityNeutral Scenario: Consolidation Around $0.70830
25% ProbabilityBullish Scenario: Breakout Above Resistance
10% ProbabilityFrequently Asked Questions: AUDUSD Analysis
What happens if AUDUSD breaks below the $0.70553 support level?
A break below $0.70553 on the 1-hour chart would likely confirm the bearish sentiment suggested by some short-term indicators. This could trigger a move towards the next support at $0.70462, potentially extending towards the $0.70409 level if selling pressure intensifies.
Should I buy AUDUSD at current levels near $0.70830 given the mixed signals?
Buying at current levels around $0.70830 is a high-risk proposition due to conflicting technical signals and a strengthening DXY. A more prudent approach would be to wait for confirmation, such as a sustained break above $0.70841 resistance with increased volume, or a clear reversal signal from oversold conditions on a higher timeframe.
Is the RSI at 53.5 a sell signal for AUDUSD right now?
An RSI of 53.5 is generally considered neutral, leaning slightly bullish, and is not inherently a sell signal. However, when viewed alongside other indicators like the Stochastic Oscillator's bearish divergence on the 1-hour chart and the overall weak trend indicated by the ADX at 20.1, it suggests caution rather than a clear buy or sell instruction.
How will the strengthening DXY at 99.15 affect AUDUSD this week?
The current upward trend in the Dollar Index (DXY) at 99.15 generally exerts downward pressure on AUDUSD, as the US Dollar becomes more attractive relative to the Australian Dollar. This macro environment could limit upside potential for AUDUSD unless there are strong counteracting factors, such as a significant shift in RBA policy expectations or a sharp decline in US equity markets.
The AUDUSD's path forward hinges on its ability to navigate the immediate resistance zone around $0.70841. While the daily chart remains neutral, the short-term technicals and the prevailing risk-off sentiment driven by a strong DXY suggest that upside may be capped. The weak trend strength across most timeframes indicates that a clear directional move requires further catalysts, whether from economic data releases, central bank commentary, or shifts in geopolitical stability. Until then, managing risk and waiting for high-probability setups around key support and resistance levels remains the most sensible strategy.
| Indicator | Value | Signal | Interpretation |
|---|---|---|---|
| RSI (14) | 53.5 | Neutral | Slight upward momentum, but not overbought. |
| MACD Histogram | Positive | Bullish Momentum | Suggests underlying buying interest. |
| Stochastic | K=31.68, D=42.94 | Bearish Divergence | Potential short-term pullback indicated. |
| ADX | 20.1 | Weak Trend | Market lacks strong directional conviction. |
| Bollinger Bands | Below Middle Band (1H) | Bearish Inclination | Suggests downward pressure on shorter timeframes. |
Suivez les marchés en temps réel
Analyses IA et données en temps réel.