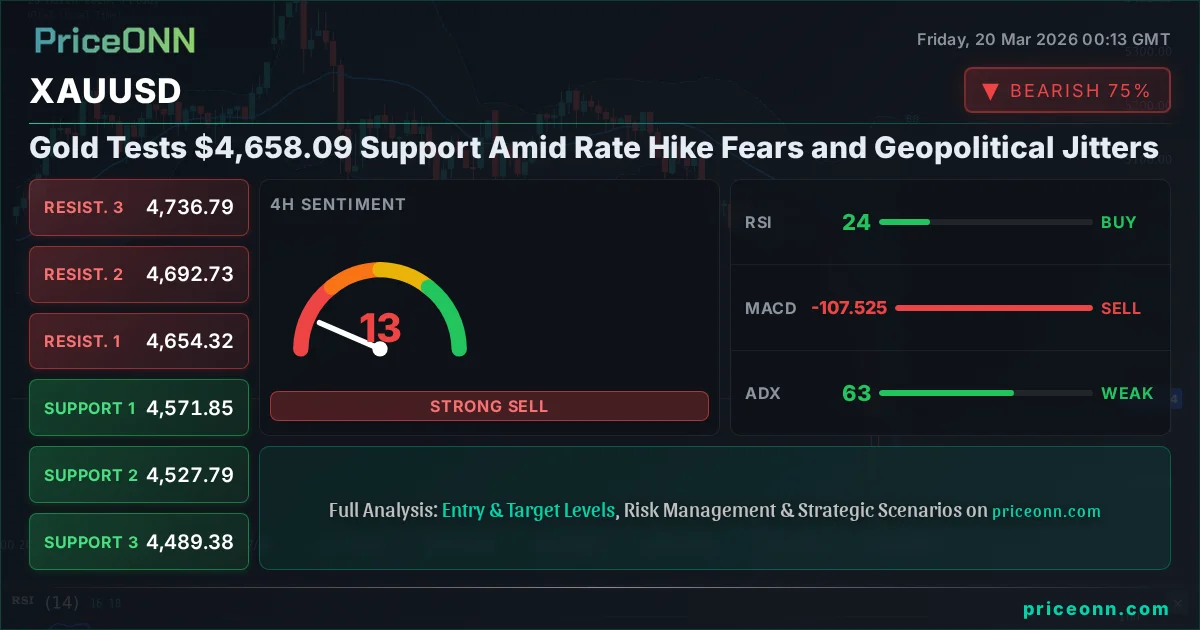
Gold Tests $4,658.09 Support Amid Rate Hike Fears and Geopolitical Jitters
XAUUSD tumbles to $4,658.09 as Fed hawkishness and Middle East tensions clash. Key levels and technical signals analyzed for potential opportunities.
Gold, the traditional safe haven, is currently facing significant headwinds, with the price of XAUUSD testing critical support levels around $4,658.09. This sharp decline, marking a 3.33% drop (-$160.48) on the day, is occurring against a backdrop of renewed hawkish sentiment from the Federal Reserve and escalating geopolitical tensions in the Middle East. The interplay between these forces creates a complex trading environment, demanding a close look at the underlying drivers and potential market reactions. As traders and investors assess this volatile landscape, understanding the nuanced signals from both technical indicators and macro drivers becomes paramount in navigating these choppy waters.
- XAUUSD is currently trading at $4,658.09, down 3.33% as a strong downtrend on the 4H chart (ADX 62.5) dominates.
- Critical support sits at $4,622.58 (1H) and $4,571.85 (4H), tested amidst RSI(14) readings in oversold territory (23.92 on 4H).
- The US Dollar Index (DXY) at 99.09 is showing a bearish trend on 1H and 4H, potentially offering some respite to gold.
- Geopolitical tensions and Fed rate hike fears are the primary drivers, creating significant volatility and a challenging outlook.
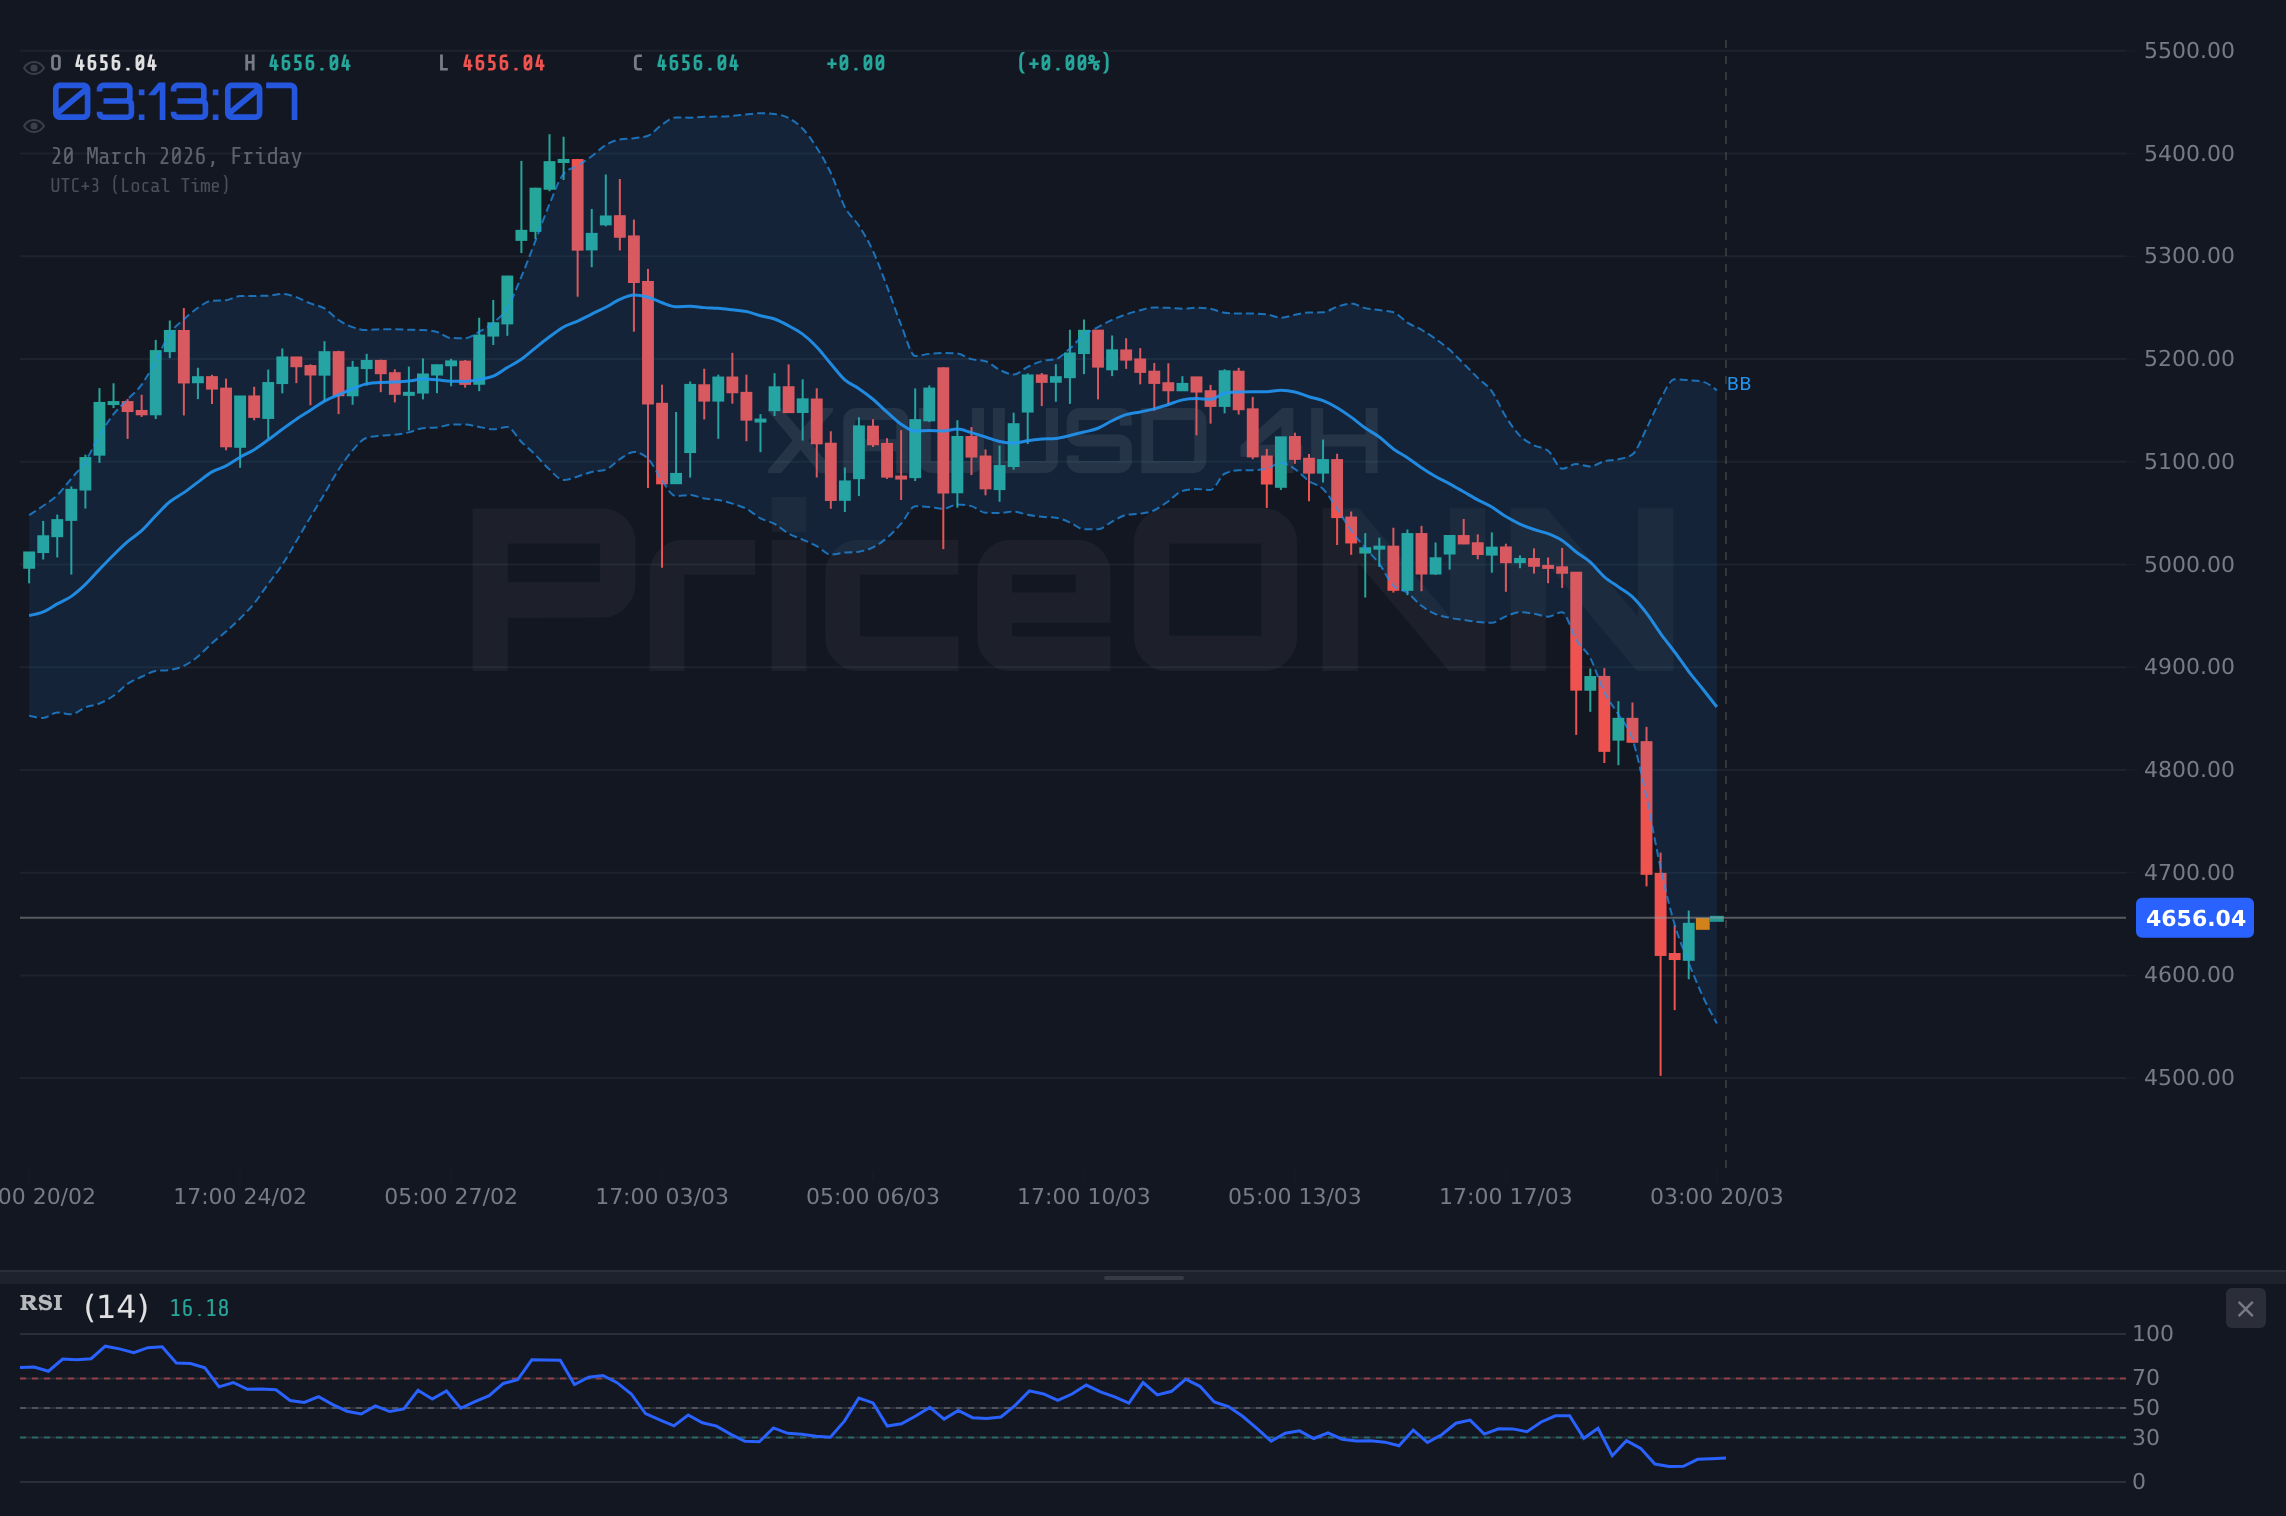
The daily chart, while showing a neutral trend with an ADX of 17.05, reveals that gold has fallen below the lower Bollinger Band, a classic sign of potential oversold conditions or a strong bearish breakout. This divergence between the daily's weaker trend and the shorter timeframes' strong bearish momentum paints a picture of a market in flux. The recent news flow certainly isn't helping gold's cause. Reports indicate that the Federal Reserve is signaling a more hawkish stance, potentially delaying or even eliminating interest rate cut expectations for 2026. This shift in monetary policy expectations typically strengthens the US dollar and increases the yield on US Treasuries, both of which are headwinds for non-yielding gold. Simultaneously, escalating geopolitical tensions, particularly in the Middle East, which have sent crude oil prices soaring, often act as a catalyst for safe-haven demand. However, in this instance, the Fed's policy concerns appear to be overshadowing traditional safe-haven flows, leading to a sharp sell-off. This unusual market behavior underscores the complexity of current market dynamics.
The DXY, or US Dollar Index, is currently trading at 99.09, reflecting a mixed technical picture across different timeframes. While the daily chart shows a strong bullish trend (ADX 34.58), the 1-hour and 4-hour charts are exhibiting bearish momentum. This suggests that while the longer-term dollar trend might still be upward, short-term weakness is present, which could offer some temporary relief to gold. However, any significant strengthening of the dollar, driven by persistent inflation fears or hawkish Fed commentary, would likely exacerbate the downward pressure on XAUUSD. The correlation between gold and the dollar is a well-established phenomenon; a stronger dollar generally makes gold more expensive for holders of other currencies, thus reducing demand. Conversely, a weaker dollar can make gold more attractive. The current technical signals for the DXY suggest a potential pause or minor pullback, which might provide a brief window for gold to stabilize, but the overarching trend and the drivers behind it are crucial to monitor.
Looking at the broader risk sentiment, major equity indices like the S&P 500 (trading at 6625.35) and the Nasdaq 100 (at 24414.13) are showing a predominantly bearish trend on their 4-hour and daily charts, despite some intraday gains. The S&P 500, for instance, has a strong bearish trend on the daily timeframe with an ADX of 42.88. This suggests a general risk-off sentiment in the market, which would typically favor safe-haven assets like gold. However, the current price action in gold seems to be defying this correlation. This decoupling could be attributed to the overwhelming influence of interest rate expectations. When the market anticipates higher-for-longer interest rates, the opportunity cost of holding non-yielding assets like gold increases, making them less attractive even in a risk-off environment. The conflicting signals between equity market weakness and gold's sharp decline highlight a market driven more by monetary policy fears than traditional risk aversion at this moment.
Navigating the Technical Landscape: Short-Term Signals
On the 1-hour chart, XAUUSD exhibits a neutral trend with a moderate strength of 50% (ADX 58.21 indicating a strong downtrend despite the neutral trend strength designation). The immediate support is found at $4,622.58, followed by $4,608.89 and $4,581.73. Resistance levels are situated at $4,663.43, $4,690.59, and $4,704.28. The RSI(14) at 39.46 is in neutral territory but shows a bearish inclination, aligning with the prevailing downward pressure. However, the Stochastic Oscillator is flashing a bullish signal with K at 83.9 and D at 63.85, suggesting a potential for a short-term bounce or a cooling-off of the sell-off. The MACD is showing positive momentum, with the MACD line above its signal line, which can sometimes precede a reversal. Yet, the Bollinger Bands are trading below the middle band, reinforcing the bearish sentiment in the short term. The conflicting signals from Stochastic and RSI/Bollinger indicate uncertainty in the immediate direction, but the overall trend momentum on this timeframe leans bearish.
The 4-hour timeframe presents a more definitive bearish picture. The trend is clearly defined as bearish with 100% strength, and the ADX at 62.5 confirms a very strong downtrend. Immediate support levels are identified at $4,571.85, $4,527.79, and $4,489.38. Resistance is seen at $4,654.32, $4,692.73, and $4,736.79. The RSI(14) is deep in oversold territory at 23.92, which historically could signal an impending bounce or a capitulation event. The Stochastic Oscillator is also showing a bullish divergence, with K at 25.61 and D at 16.12, %K crossing above %D, suggesting that the selling pressure might be exhausting. Conversely, the MACD is firmly in negative momentum, below its signal line, and the Bollinger Bands are below the middle band, confirming the strong bearish sentiment. This timeframe suggests that while the trend is strongly down, the oversold conditions might be setting up for a potential relief rally or a short squeeze.
Daily Chart Perspective: Long-Term Signals and Divergences
On the daily chart, the trend is classified as neutral with 50% strength and a relatively weak ADX of 17.05, indicating a lack of a strong directional trend over a longer period. However, the price action has broken below the lower Bollinger Band, suggesting extreme selling pressure or a potential exhaustion point. Key support levels on this timeframe are located at $4,744.83, $4,671.11, and $4,535.46. Resistance is more distant, starting at $4,954.2, then $5,089.85, and $5,163.57. The RSI(14) is at 33.87, in the lower end of the neutral zone and showing a bearish inclination, but not yet in oversold territory. The Stochastic Oscillator is deeply oversold, with K at 12.6 and D at 17.74, indicating that the asset is significantly undervalued on this timeframe and ripe for a potential reversal. The MACD is below its signal line with negative momentum, reinforcing the bearish pressure seen on shorter timeframes. The contrast between the daily's weak trend and oversold stochastic, versus the shorter timeframes' strong bearish momentum, presents a critical juncture for gold. A failure to hold the immediate support levels could signal a deeper decline, while a bounce from these oversold conditions could initiate a significant recovery.
The current technical signals present a mixed bag, particularly when comparing shorter timeframes with the daily chart. The 1-hour and 4-hour charts are dominated by strong bearish momentum, with ADX values indicating robust downtrends. The oversold readings on the Stochastic Oscillator across all timeframes, especially on the daily chart, are a significant signal. While this does not negate the current bearish trend, it suggests that the selling may be nearing exhaustion. The conflict between the prevailing bearish trend and the deeply oversold indicators is a classic sign of market indecision or a potential turning point. For a bullish reversal to gain traction, gold would need to reclaim key resistance levels, particularly the 1-hour resistance at $4,663.43 and then push towards $4,690.59. Conversely, a break below the 4-hour support at $4,571.85 would likely accelerate the sell-off, potentially targeting the $4,489.38 level.
The Macroeconomic Crosscurrents: Fed, Inflation, and Geopolitics
The narrative surrounding the Federal Reserve's monetary policy remains a dominant force in the gold market. Recent commentary from Fed officials has significantly dampened expectations for interest rate cuts in 2026, pushing Treasury yields higher and strengthening the US dollar. This shift is crucial because higher real interest rates increase the opportunity cost of holding non-yielding assets like gold. If the Fed maintains a hawkish stance, implying that inflation remains a persistent concern requiring higher rates for longer, gold’s appeal as an investment asset diminishes. The market is now pricing in a lower probability of rate cuts, which directly impacts gold's valuation. This is a significant departure from earlier expectations and is a primary reason for the current downward pressure on gold prices, even as geopolitical risks remain elevated. The CME FedWatch tool, if available, would show the precise shift in probabilities for future rate decisions, but the general sentiment is clear: the era of easy money might be extended.
Geopolitical tensions, typically a strong tailwind for gold, are currently presenting a complex scenario. The ongoing conflict in the Middle East, which has driven crude oil prices significantly higher (Brent at 107.81, WTI at 94.08), usually increases demand for gold as a safe-haven asset. Crude oil’s rise also feeds into inflation concerns, which historically benefits gold as an inflation hedge. However, the market's reaction suggests that the fear of prolonged high interest rates is currently a more potent driver for gold price action than geopolitical instability. This is an unusual dynamic, as gold typically thrives in environments of heightened global uncertainty. The fact that gold is falling despite rising oil prices and significant geopolitical risk suggests that the macro-economic outlook, particularly concerning interest rates, is exerting a stronger influence on investor behavior. The market seems to be prioritizing the impact of central bank policy over immediate geopolitical threats, a situation that could change rapidly but is currently defining the price action.
The performance of other major currency pairs also provides context. EUR/USD is trading at 1.15749, showing signs of a potential rebound on the 1-hour chart, but facing headwinds on the daily timeframe. GBP/USD is at 1.34245, also showing upward momentum in the short term but with a bearish daily trend. AUD/USD and NZD/USD are similarly exhibiting short-term strength but battling longer-term bearish trends. This mixed picture in the forex market reflects the broader global economic uncertainty and the dominant influence of the US dollar. As the DXY shows weakness on shorter timeframes, these pairs might find some temporary support, but the overarching trend dictated by Fed policy and inflation expectations will likely continue to play a crucial role. The resilience of these currency pairs, or their continued decline, will offer further clues about global risk appetite and the strength of the US dollar.
Trade Scenarios and Outlook
Bearish Scenario: Downside Acceleration
65% ProbabilityNeutral Scenario: Consolidation and Observation
25% ProbabilityBullish Scenario: Oversold Bounce
10% ProbabilityThe current technical setup on XAUUSD suggests a bearish bias, primarily driven by strong downtrend momentum on shorter timeframes and the macroeconomic environment favoring a stronger dollar and higher yields. The daily chart's oversold Stochastic signal offers a glimmer of hope for a potential bounce, but the overwhelming bearish signals on the 1-hour and 4-hour charts, coupled with a strong ADX, indicate that downside risks are more pronounced. A break below the critical $4,571.85 support level on the 4-hour chart would likely trigger further selling, potentially accelerating towards $4,489.38. The bullish scenario, while less probable at this juncture, hinges on gold holding key intraday supports, such as $4,622.58, and showing signs of recovery, potentially targeting immediate resistance at $4,663.43. The neutral scenario anticipates a period of consolidation as the market digests conflicting signals and awaits clearer direction from upcoming economic data or geopolitical developments.
The interplay between the Federal Reserve's monetary policy stance and geopolitical risks creates a volatile environment for gold. While geopolitical tensions typically boost safe-haven demand, the current focus on inflation and interest rates seems to be overshadowing these traditional drivers. The strong bearish trend indicated by the ADX on shorter timeframes, coupled with the RSI's position in oversold territory on the daily chart, suggests that gold is currently caught between strong selling pressure and potential exhaustion. Traders should remain vigilant, paying close attention to the $4,658.09 price point and the key support levels below it. Any sustained move above the $4,663.43 resistance might signal a temporary reprieve, but the overall trend remains bearish until key macroeconomic factors shift or geopolitical events dramatically alter market sentiment. Patience and disciplined risk management are crucial in this environment.
Frequently Asked Questions: XAUUSD Analysis
What happens if XAUUSD breaks below the $4,571.85 support level?
A break below the 4-hour support at $4,571.85 would likely confirm a continuation of the bearish trend, potentially accelerating towards the next support target at $4,527.79. This would signal further downside pressure driven by macroeconomic concerns, outweighing safe-haven demand.
Should I buy XAUUSD at current levels around $4,658.09 given the oversold RSI on the daily chart?
Buying at current levels carries significant risk due to the strong bearish momentum on shorter timeframes. While the daily RSI is oversold (33.87), confirmation of a bullish reversal would require holding above $4,622.58 and breaking key resistance levels, with a low probability (10%) for this scenario currently.
Is the Stochastic Oscillator's oversold signal a reliable buy signal for XAUUSD at $4,658.09?
The oversold Stochastic reading (K=12.6, D=17.74 on daily) suggests potential exhaustion of selling pressure, but it is not a standalone buy signal in the face of strong bearish trends (ADX 62.5 on 4H). Confirmation from price action reclaiming resistance levels is essential.
How will the Fed's hawkish stance affect XAUUSD's price around $4,658.09 this week?
A hawkish Fed, signaling higher-for-longer interest rates, generally puts downward pressure on gold by increasing the opportunity cost of holding non-yielding assets. This macro driver is currently a key reason for gold testing support at $4,658.09, potentially limiting any upside until Fed policy expectations shift.
Technical Outlook Summary
| Indicator | Value | Signal | Interpretation |
|---|---|---|---|
| RSI (14) | 39.46 | Neutral | Bearish inclination on 1H, oversold on 4H (23.92) |
| MACD | -15.20 | Bearish | Negative momentum on 4H, confirming downtrend |
| Stochastic | 12.6 | Bullish | Deeply oversold on Daily, potential reversal signal |
| ADX | 62.5 | Bearish | Very strong downtrend on 4H, confirming selling pressure |
| Bollinger | Below Middle Band | Bearish | Confirms bearish sentiment across timeframes |
Key Levels
Support Levels
Resistance Levels
Volatility creates opportunity - those prepared will be rewarded. Markets are cyclical; every downturn plants seeds for the next rally. With disciplined risk management, these choppy waters can be navigated safely. Patient investors always find opportunities - the key is waiting for the right moment. Be bold when the market is fearful, cautious when euphoric - this golden rule applies today.
Track markets in real-time
AI-powered analysis, technical indicators and real-time price data.
Join Our Telegram Channel
Breaking market news, AI analysis and trading signals instantly.
Join Channel