DXY Tests Resistance at $99.93: Dollar Eyes Gains Post-Fed Hawkishness
The US Dollar Index (DXY) holds steady near $99.93 as markets digest hawkish Fed signals and rising geopolitical tensions. Will the dollar extend its rally?
The US Dollar Index (DXY) is currently navigating a critical juncture, holding firm around the $99.93 mark. This level represents a significant test of resistance, particularly as the market grapples with the aftermath of a surprisingly hawkish Federal Reserve stance and escalating geopolitical tensions. The dollar's recent strength, coupled with a surge in crude oil prices and higher-than-expected US PPI data, paints a complex picture for global markets. As traders brace for further volatility, the DXY's ability to break above $99.93 could signal a more sustained bullish trend, while a failure to do so might indicate consolidation or a potential pullback. The interplay between monetary policy expectations, inflation data, and global risk sentiment is currently dictating the dollar's trajectory, making this a pivotal moment for currency markets.
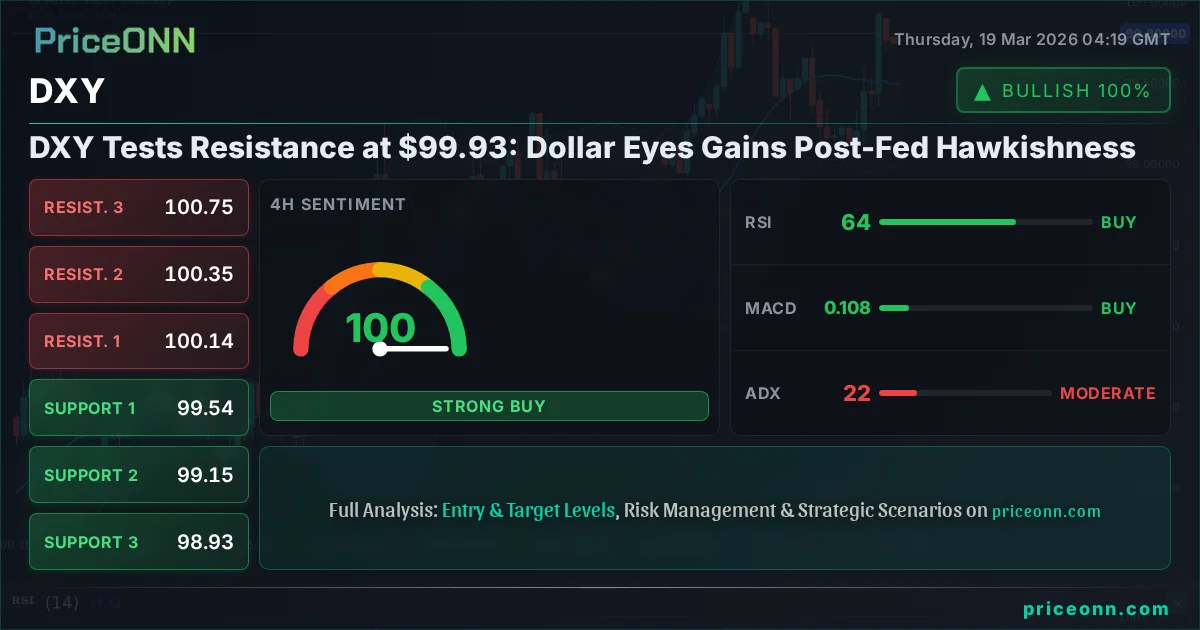
- The DXY is testing resistance at $99.93, a critical level influenced by hawkish Fed signals.
- US PPI data soared, increasing inflation concerns and supporting dollar strength, with a reading of 3.2% vs 2.8% forecast.
- Crude oil prices surged past $108, adding to inflationary pressures and potentially boosting safe-haven demand for the dollar.
- The 4-hour ADX at 21.82 indicates a moderate trend, while RSI at 63.84 suggests a bullish lean but not yet extreme overbought conditions.
The Federal Reserve's latest policy decision has undoubtedly injected a dose of hawkishness into the market's bloodstream, and the DXY is at the forefront of this repricing. While initial expectations leaned towards a more dovish outlook, the central bank's commentary signaled a potential delay in rate cuts, emphasizing the persistent nature of inflation. This shift in sentiment has been a primary driver for the dollar's recent ascent. The 1D RSI reading of 66.22, while in the upper neutral zone, suggests there is still room for upward momentum before reaching overbought territory, indicating that bulls might have further to push. This divergence from earlier expectations has sent ripples across global financial markets, prompting a reassessment of risk appetites and currency valuations.
Navigating the Dollar's Climb: Technical Indicators and Price Action
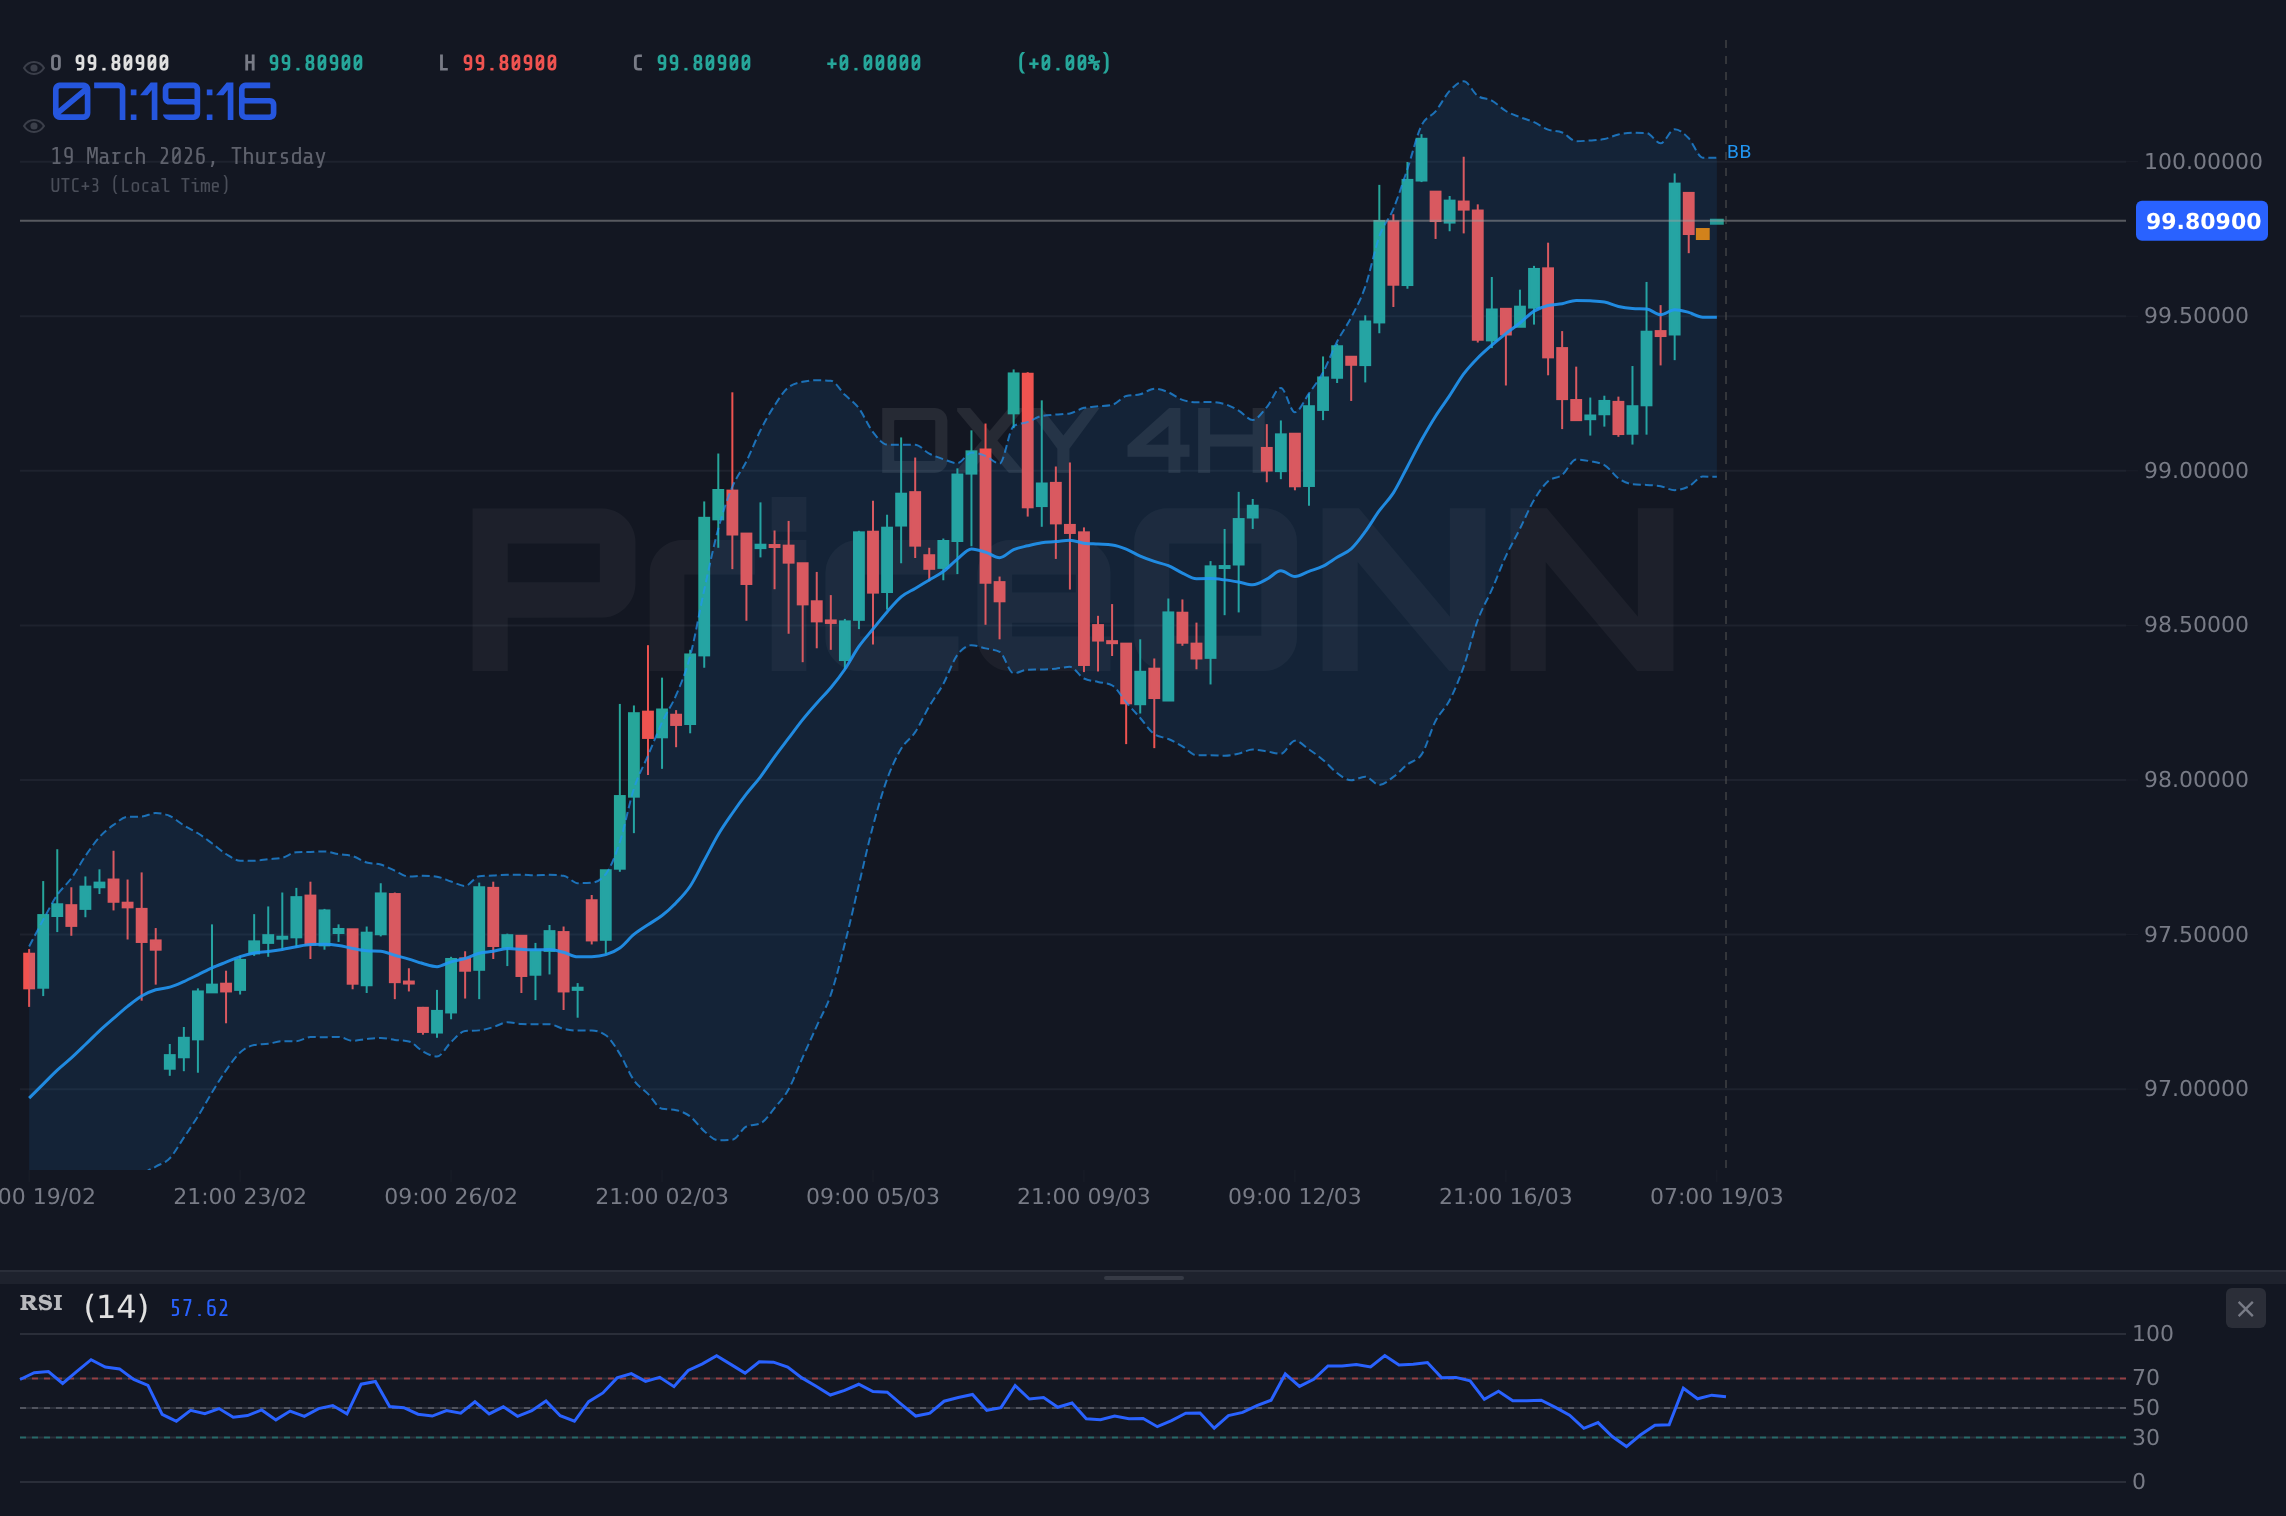
On the 4-hour chart, the DXY is exhibiting a moderate trend strength, as indicated by the ADX reading of 21.82. This suggests that while a trend is present, it may not be overwhelmingly dominant, leaving room for potential consolidation or pullbacks. However, the RSI is sitting at a robust 63.84, indicating bullish momentum is building. This suggests that the upward pressure on the dollar is significant, even if the trend isn't yet at extreme levels. The Stochastic Oscillator, with K at 82.04 and D at 40.19, clearly shows a bullish signal, as the %K line has crossed above the %D line, reinforcing the positive outlook for the dollar in this timeframe. Traders are closely watching the confluence of these indicators, seeking confirmation for a sustained move higher.
Digging deeper into the daily timeframe, the DXY's trend is decidedly bullish, supported by an ADX of 35.86, signifying a strong trend. The RSI stands at 66.22, comfortably within the neutral zone but trending upwards, indicating room for further appreciation. The MACD is also showing positive momentum, with the MACD line above the signal line, further bolstering the bullish case. This alignment across multiple timeframes, from the daily down to the 4-hour, suggests that the current upward move in the dollar has a solid technical foundation. The key question now is whether the DXY can overcome the psychological barrier at $100.00 and establish new ground.
The immediate resistance level to watch is $100.14 on the 4-hour chart, followed by $100.35 and $100.75. A decisive break above $100.14 could trigger a rapid ascent as the market chases the next resistance level. Conversely, support is found at $99.54, $99.15, and $98.93. A failure to hold $99.54 could signal a short-term reversal, inviting sellers to test lower ground. The interplay between these levels, particularly the psychological $100.00 mark, will be crucial in determining the short-to-medium term direction of the dollar index. The current price of $99.93 places it precariously close to this significant resistance, making the next few trading sessions highly instructive.
Macroeconomic Crosscurrents: Inflation, Geopolitics, and the Fed's Shadow
The recent surge in US Producer Price Index (PPI) data, coming in at 3.2% against a forecast of 2.8%, has undeniably fanned the flames of inflation concerns. This hotter-than-expected reading provides a strong underpinning for the Federal Reserve's hawkish stance, suggesting that inflationary pressures may indeed be more persistent than initially anticipated. This data point directly supports the dollar's strength, as higher inflation often leads to expectations of higher interest rates for longer, making dollar-denominated assets more attractive. The DXY's current position at $99.93 is a direct reflection of these macroeconomic crosscurrents, as traders price in a potentially tighter monetary policy environment for longer than previously expected.
Adding another layer of complexity is the significant surge in Brent crude oil prices, which have now surpassed $108 per barrel. This rise, driven by ongoing geopolitical tensions in the Middle East, not only fuels broader inflation concerns but also tends to increase demand for safe-haven assets. While the dollar itself is often considered a safe haven, the increased cost of energy can have a dampening effect on global economic growth, creating a mixed signal. However, in the current environment, the dollar's role as a primary safe haven appears to be taking precedence, particularly when juxtaposed with the Fed's hawkish tilt. The correlation between rising oil prices and dollar strength is not always direct, but the underlying inflationary impact and geopolitical uncertainty currently favor the greenback.
The market's reaction to the Federal Reserve's latest meeting minutes and subsequent commentary highlights a significant shift in expectations regarding interest rate policy. While the Fed previously signaled a potential path towards rate cuts, the persistent inflation data has forced a reassessment. The CME FedWatch tool, if it were to reflect this shift accurately, would show a reduced probability of imminent rate cuts and an increased likelihood of rates remaining higher for longer. This recalibration is a powerful tailwind for the DXY. The dollar's current strength at $99.93 is a direct consequence of this repricing, as investors adjust their portfolios to a higher-for-longer interest rate environment. The implications extend beyond the DXY, influencing everything from bond yields to equity market sentiment.
The market is highly sensitive to upcoming economic data, particularly inflation figures and central bank commentary. Any deviation from current hawkish expectations from the Fed could trigger significant volatility across all asset classes, potentially impacting the DXY's trajectory. Traders should maintain strict risk management protocols.
Intermarket Dynamics: DXY's Impact on Gold, Forex, and Equities
The strength of the US Dollar Index (DXY) at $99.93 has a palpable impact across various asset classes. For XAUUSD (Gold), the strengthening dollar typically acts as a headwind. With the DXY pushing towards resistance, gold prices have faced pressure, although geopolitical tensions and inflation fears are providing some underlying support. The 1D ADX for XAUUSD at 15.81 indicates a weak trend, suggesting that price action might be more range-bound, waiting for a clearer directional catalyst. However, the 4H chart shows a strong downtrend (ADX 52.97), and RSI at 29.42 is in oversold territory, hinting at a potential bounce if the dollar falters even slightly. The current price of $4851.39 for gold is a key level to watch in this context.
In the forex market, the DXY's upward momentum directly influences major currency pairs. EUR/USD, currently trading around 1.1473, faces pressure from a stronger dollar. The 1D trend for EUR/USD is bearish with an ADX of 38.79, indicating a strong trend. The RSI at 34.88 reinforces the bearish sentiment. Similarly, GBP/USD at 1.3277 and AUD/USD at 0.70445 are also under pressure, with their respective 1D charts showing strong bearish trends (ADX 32.5 and 20.9, respectively). USD/JPY, however, presents a different picture. While the DXY is strong, USD/JPY is showing a bullish trend on the daily chart (ADX 23.99) with RSI at 66.03, suggesting that the pair's upward movement might be driven by factors specific to the Bank of Japan's ultra-loose monetary policy, despite the broader dollar strength. This divergence is a crucial point for currency traders to monitor.
The equity markets, particularly the US indices, are also sensitive to the DXY's movements. SP500, trading at 6624.6, and Nasdaq100 at 24421.48, are currently exhibiting weakness on their 1H and 4H charts, with strong downtrend signals from the ADX (45.56 and 45.49, respectively). This suggests that a stronger dollar, potentially driven by higher interest rate expectations and a risk-off sentiment exacerbated by geopolitical events and rising oil prices, is weighing on equities. The Dow Jones Industrial Average, at 46228, also shows a strong downtrend on the 1H chart (ADX 47.37). This broad-based weakness in equities, coupled with the DXY's push towards resistance, paints a picture of risk aversion, where investors might be rotating towards the perceived safety of the US dollar and potentially other safe-haven assets like gold, provided inflation fears don't completely overshadow the risk-off sentiment.
Pay close attention to the correlation between the DXY and US Treasury yields. Rising yields often accompany dollar strength, especially when driven by hawkish central bank expectations. Conversely, falling yields might signal a shift towards risk aversion, which could also benefit the dollar as a safe haven, but potentially at the expense of equities.
Trade Scenarios and Outlook
Bearish Scenario: Dollar Stumbles Below $99.54
35% ProbabilityNeutral Scenario: Consolidation Around $99.93
30% ProbabilityBullish Scenario: Dollar Breaks Above $100.14
35% ProbabilityThe DXY's current positioning at $99.93 presents a fascinating technical and fundamental crossroads. The hawkish signals from the Federal Reserve, coupled with persistent inflation data and geopolitical risks, create a strong case for continued dollar strength. The technical indicators across multiple timeframes generally support this outlook, with the daily and 4-hour charts showing bullish momentum and strong trend readings, despite some cautionary signals on the 1-hour chart. The key will be the DXY's ability to decisively break through the $100.14 resistance level. A successful breach could unlock further upside potential, targeting $100.35 and potentially $100.75. However, failure to overcome this hurdle, especially if supported by a shift in Fed sentiment or easing geopolitical tensions, could lead to a pullback towards $99.54 and potentially lower.
| Indicator | Value | Signal | Interpretation |
|---|---|---|---|
| RSI (14) | 66.22 | Bullish | Trending upwards, room before overbought on daily. |
| MACD Histogram | +0.12 | Bullish | Positive momentum on daily chart. |
| Stochastic | K=82.04, D=40.19 | Bullish | Bullish crossover on 4H, K above D. |
| ADX | 35.86 | Strong Trend | Strong uptrend confirmed on daily timeframe. |
| Bollinger Bands | Middle Band | Watch | Price above middle band on daily, indicating upward pressure. |
Frequently Asked Questions: DXY Analysis
What happens if DXY breaks above the $100.14 resistance level?
A decisive close above $100.14 on the 4-hour chart would invalidate the immediate bearish scenario and likely trigger further upside. This could lead to price targeting the next resistance at $100.35, with a potential extension towards $100.75 as bulls gain momentum.
Should I buy DXY at current levels of $99.93 given the hawkish Fed signals?
Buying at current levels carries risk as $99.93 is a resistance point. A more prudent approach might involve waiting for a confirmed breakout above $100.14 to confirm bullish momentum, or for a pullback to support around $99.54 for a better risk-reward ratio. The probability of a bullish scenario is currently estimated at 35% from this resistance.
Is the RSI at 66.22 a sell signal for DXY right now?
An RSI of 66.22 on the daily chart is not considered an immediate sell signal; it sits within the upper neutral zone. While it indicates bullish momentum, it suggests there is still room for further price appreciation before reaching overbought territory (typically above 70). This reading supports the potential for a continued move higher, rather than an immediate reversal.
How will the persistent inflation data affect DXY this week?
Persistent inflation data, like the recent surge in PPI, strengthens the case for the Federal Reserve to maintain a hawkish stance. This typically leads to higher interest rate expectations, which are supportive of the US Dollar. Therefore, continued high inflation readings could further bolster the DXY, potentially pushing it towards and above the $100.00 psychological level.
Track markets in real-time
AI-powered analysis, technical indicators and real-time price data.
Join Our Telegram Channel
Breaking market news, AI analysis and trading signals instantly.
Join Channel