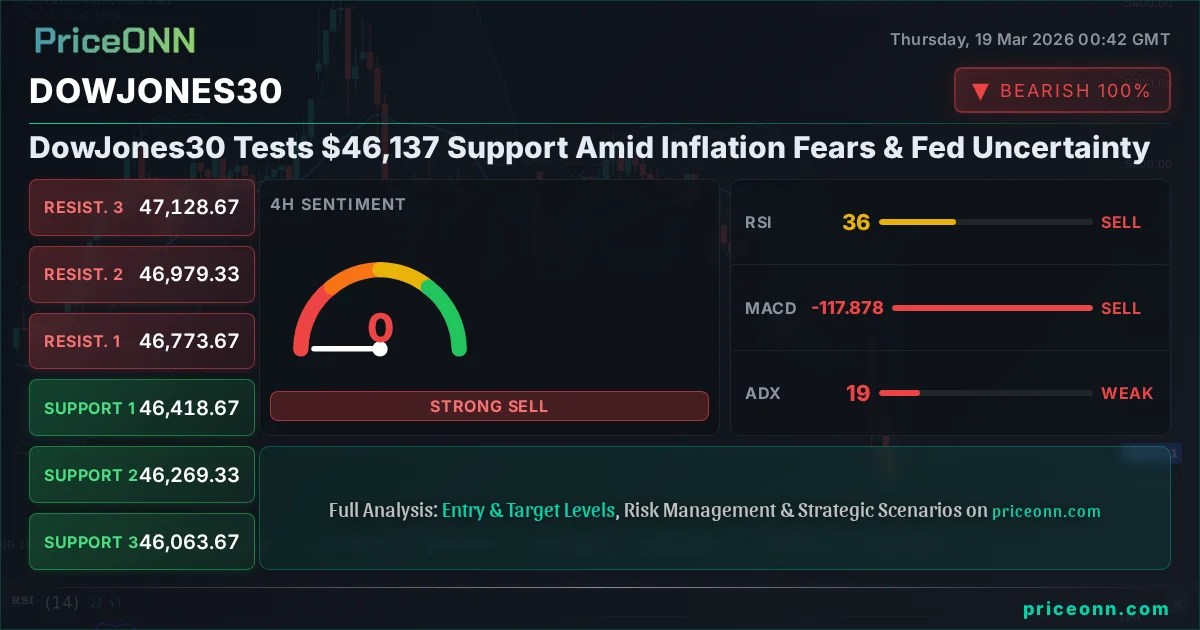
DowJones30 Tests $46,137 Support Amid Inflation Fears & Fed Uncertainty
DowJones30 hovers around $46,137 as US PPI skyrockets and oil prices surge, increasing Fed hawkishness fears. Key support at $46,063.67.
Is the Dow Jones Industrial Average poised to hold its ground at $46,137.00, or will escalating inflation fears and a hawkish Federal Reserve stance push it lower? The index is currently navigating a critical juncture, with traders keenly watching key support levels as geopolitical tensions and robust economic data paint a complex picture for risk assets. The surge in US Producer Price Index (PPI) data, coupled with a sharp rise in crude oil prices, has intensified market anxiety ahead of the crucial Federal Reserve decision, potentially signaling a more aggressive stance on inflation control. This confluence of factors creates a high-stakes environment for the Dow Jones, demanding a close examination of its technical posture and the broader market correlations that are currently driving its price action.
- The Dow Jones 30 is trading near $46,137, with immediate support at $46,063.67 and resistance at $46,160.00.
- US PPI surged significantly, raising inflation concerns and increasing the likelihood of a more hawkish Fed stance.
- Crude oil prices rallied sharply, adding to inflationary pressures and geopolitical risk premiums.
- DXY strength above 99.97 could pressure the Dow Jones, while a falling S&P 500 (at 6,614.80) indicates waning risk appetite.
The Dow Jones Industrial Average (DJIA) finds itself at a pivotal moment, currently trading around the $46,137.00 mark. This level is more than just a number; it represents a battleground between bulls and bears, with significant implications for the broader market sentiment. On the 1-hour chart, the ADX reading of 46.22 signals a strong downtrend, suggesting that any upward movement might be met with strong selling pressure. This technical indicator, combined with a generally bearish signal across multiple timeframes, paints a cautious picture. However, the 1D chart shows a weaker ADX of 38.72, hinting at a potential shift or consolidation phase, though the overall trend remains decidedly bearish. The stark contrast between the strong short-term trend signals and the weaker daily trend indicators creates a degree of ambiguity that traders must navigate carefully.
The immediate support level to watch is $46,063.67, a level that has shown some resilience but is under considerable pressure. A decisive break below this point, especially on increasing volume, could trigger further downside, potentially targeting the next support at $45,988. On the upside, resistance is currently capped around $46,160.00. A sustained move above this level would be necessary to alleviate immediate selling pressure and could pave the way for a test of higher resistance levels. However, given the prevailing bearish sentiment and the current technical indicators, such a move appears challenging without a significant shift in market drivers.
The Inflationary Storm: PPI and Oil's Role
The recent surge in US Producer Price Index (PPI) data has sent shockwaves through financial markets. Coming in significantly higher than expected, the PPI report underscored persistent inflationary pressures within the economy. This data point is particularly concerning for central bankers, as rising input costs for businesses often translate into higher consumer prices, fueling a potentially persistent inflation cycle. The immediate market reaction was a palpable increase in risk aversion, as investors recalibrated their expectations for future monetary policy. The prospect of inflation proving more stubborn than anticipated has led to a reassessment of the Federal Reserve's likely path forward, with many now anticipating a more cautious, potentially hawkish, stance.
This inflationary data is amplified by the concurrent surge in crude oil prices. Brent crude, for instance, has climbed past $108 per barrel, while WTI is trading around $99.35, driven by escalating geopolitical tensions in the Middle East. This rise in energy costs acts as a double-edged sword: it directly contributes to higher PPI and CPI figures, while also increasing operational costs for businesses across all sectors. The correlation between rising oil prices and inflationary fears is well-established. Historically, sustained high oil prices have been a precursor to broader economic slowdowns and have often prompted central banks to tighten monetary policy more aggressively. The current spike, particularly the strength in Brent relative to WTI, suggests that global energy supply concerns are paramount, adding another layer of uncertainty to the economic outlook and putting further pressure on indices like the Dow Jones.
Fed Uncertainty and the Dollar's Strength
The Federal Reserve finds itself in a precarious position. Faced with persistent inflation, evidenced by the hot PPI numbers and rising oil costs, the central bank is under immense pressure to demonstrate its commitment to price stability. While the market had anticipated a potential pause or even a pivot in Fed policy, the latest data suggests that such hopes might be premature. The US Dollar Index (DXY) has responded to this uncertainty, finding support and currently trading around 99.97. A stronger dollar typically exerts downward pressure on US equity indices like the Dow Jones, as it makes American exports more expensive and can signal tighter financial conditions.
The DXY's current level near the psychological 100.00 mark is a key indicator of global risk sentiment. Its upward trajectory, fueled by inflation concerns and potential Fed hawkishness, suggests a 'risk-off' environment is taking hold. This is further corroborated by the performance of major equity indices. The S&P 500 is down 1.54% at 6,614.80, and the Nasdaq 100 has fallen 1.67% to 24,383.75. This broad-based decline in equities indicates that investors are moving away from riskier assets and seeking the perceived safety of the dollar. The Dow Jones, while often seen as more defensive than the tech-heavy Nasdaq, is not immune to these broad market flows. The inverse correlation between the DXY and the Dow Jones is a critical dynamic to monitor, especially as the Fed's policy path becomes less certain.
The Dow Jones's Technical Tightrope
Technically, the Dow Jones Industrial Average is teetering on a critical support level. The 1-hour chart presents a bearish picture, with an ADX of 46.22 indicating a strong downward trend. The RSI(14) at 23.96 is deep in oversold territory, suggesting that a short-term bounce is possible, but it does not negate the overall bearish momentum indicated by the MACD histogram being negative and below the signal line. Stochastic K and D lines are also in extreme oversold conditions, with K (7.53) below D (6.04), which is technically a bearish signal despite the oversold readings.
The 4-hour chart offers a slightly less severe, though still bearish, outlook. The ADX at 18.58 suggests a weaker trend compared to the 1-hour timeframe, but the RSI at 35.61 and MACD remain bearish. The Stochastic shows K (12.25) below D (48.37), reinforcing the bearish bias. The Bollinger Bands are below the middle band, indicating downward pressure. The daily chart, however, presents a more nuanced view. The ADX at 38.72 still signals a strong trend, but the RSI at 29.00 is also in oversold territory, similar to the 1-hour chart. The MACD remains negative. The Stochastic K (18.88) is below D (23.67), but both are deeply oversold. This divergence in trend strength across timeframes highlights the complexity of the current market environment. While short-term indicators scream 'sell', the oversold conditions and weaker daily trend strength might offer temporary reprieve or a potential for a short-covering rally.
The Bull's Roadmap: Navigating the Upside
For the bulls to regain control, a significant shift in market dynamics is required. The immediate trigger for a bullish scenario would be a decisive close above the resistance at $46,160.00 on the 1-hour chart. This would need to be accompanied by increasing volume and a confirmation from other technical indicators. If this level is breached, the next target would be the $46,207.00 resistance, followed by $46,246.00. A sustained move above these levels, particularly if it breaks the psychological $46,300 barrier, could signal a short-term reversal. This bullish thesis would be invalidated if the price fails to hold above $46,160.00 and instead breaks down below the critical support at $46,063.67.
The broader context for this bullish scenario involves a cooling of inflation fears, a less hawkish-than-expected Fed, or a significant de-escalation of geopolitical tensions in the Middle East. If inflation data unexpectedly moderates and the Fed signals a more patient approach, risk appetite could return, lifting indices like the Dow Jones. However, given the current data and sentiment, this scenario appears less probable in the short term. The probability of this scenario playing out this week is estimated at around 20%, contingent on a significant change in the macroeconomic narrative.
Where Bears Take Control: The Downside Scenario
The bearish scenario appears more aligned with the current technical and fundamental backdrop. The primary trigger for this scenario would be a confirmed break below the immediate support level of $46,063.67. This breakdown would likely be accompanied by increased selling volume and a negative confirmation from oscillators like the RSI and MACD. If this support fails, the next logical target would be the 4-hour support at $45,988. A further break below this level could accelerate the decline towards the 1D support at $45,873.33. The invalidation of this bearish thesis would occur if the price manages to reclaim and hold above the $46,160.00 resistance level.
The fundamental drivers supporting this bearish outlook include persistently high inflation, a hawkish Fed, escalating geopolitical risks, and a strengthening dollar. The surge in US PPI and oil prices provides ample justification for the Fed to maintain a tight monetary policy, which typically weighs on equity markets. Furthermore, the ongoing Middle East conflict adds a layer of geopolitical risk that often leads to 'risk-off' sentiment, benefiting safe-haven assets like the US dollar at the expense of equities. Given these factors, the probability of the bearish scenario unfolding in the near term is estimated at 65%. This outlook is particularly sensitive to upcoming economic data and any further escalation of geopolitical events.
The Waiting Game: Consolidation and Range-Bound Trading
A third possibility is that the Dow Jones enters a period of consolidation, trading within a defined range as market participants digest the conflicting signals and await clearer direction. This scenario often occurs when technical indicators present mixed signals or when key economic events are on the horizon. In this case, the index could remain range-bound between the current support at $46,063.67 and resistance at $46,160.00. Price action within this range might be choppy, characterized by failed breakouts and short-covering rallies.
The technical indicators on the 1-hour chart, particularly the oversold RSI and Stochastic readings, could support a temporary bounce within this range. However, the strong ADX readings on the 1- and 4-hour charts suggest that any range-bound movement might eventually give way to a directional trend. This consolidation phase could be driven by a stalemate in geopolitical tensions, a Fed that signals a data-dependent approach without committing to a hawkish path, or simply market participants waiting for the outcome of key upcoming economic releases. The probability of this scenario playing out over the next few trading sessions is estimated at 15%, acting as a bridge between the immediate bearish pressure and a potential longer-term trend.
What I'm Watching: Key Triggers for the Week
The coming week is critical for the Dow Jones Industrial Average. Several key triggers will likely dictate its direction. Firstly, the Federal Reserve's policy decision and accompanying statement will be paramount. Any hint of increased hawkishness, even without an immediate rate hike, could reinforce the bearish sentiment. Conversely, a more dovish tone or a signal of patience could provide a much-needed reprieve for equities. Traders will be dissecting every word for clues about future policy direction, particularly concerning inflation and growth outlooks.
Secondly, ongoing developments in the Middle East will be closely monitored. Any escalation or de-escalation of tensions will directly impact oil prices and, consequently, inflation expectations and overall market risk appetite. A significant geopolitical event could trigger a flight to safety, bolstering the dollar and pressuring the Dow Jones further. Finally, upcoming economic data, beyond the recent PPI figures, will also play a crucial role. Key employment reports or consumer sentiment surveys could either confirm the inflationary concerns or provide evidence of economic resilience, influencing both Fed policy expectations and market positioning.
Bearish Scenario: Downside Momentum Builds
65% ProbabilityNeutral Scenario: Range-Bound Choppiness
15% ProbabilityBullish Scenario: Short-Covering Rally
20% ProbabilityFrequently Asked Questions: DowJones30 Analysis
What happens if DowJones30 breaks below $46,063.67 support?
A break below $46,063.67 would likely trigger further selling, targeting $45,988.00 and potentially $45,873.33. This scenario is favored by high inflation data and potential Fed hawkishness.
Should I buy DowJones30 at current levels of $46,137 given RSI at 23.96?
While the RSI is oversold at 23.96, indicating potential for a short-term bounce, the strong downtrend signals (ADX 46.22) suggest caution. A confirmed close above $46,160.00 would be needed for a more reliable bullish signal.
Is the RSI at 23.96 a sell signal for DowJones30 right now?
An RSI of 23.96 is considered oversold, typically signaling potential for a bounce rather than a direct sell signal. However, in a strong downtrend, oversold conditions can persist, so it's crucial to watch for confirmation from other indicators and price action.
How will the Fed decision affect DowJones30 this week?
If the Fed signals increased hawkishness due to persistent inflation (like the recent PPI surge), it could pressure the Dow Jones lower. Conversely, a more patient tone might offer temporary relief, but significant upside requires a shift in the inflation narrative.
Track markets in real-time
AI-powered analysis, technical indicators and real-time price data.
Join Our Telegram Channel
Breaking market news, AI analysis and trading signals instantly.
Join Channel