BTCUSD Tests $72,744 Support: A Technical Deep-Dive Amidst Market Cross-Currents
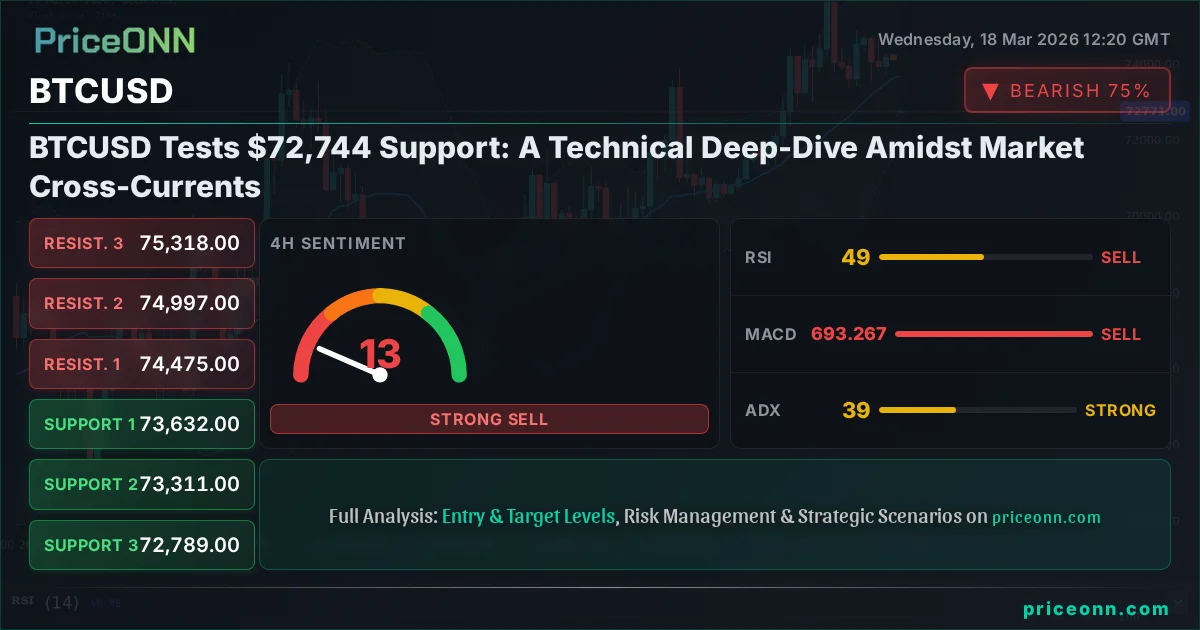
BTCUSD hovers near $72,744 support. With RSI at 32.57 and ADX at 13.65, the current trend is weak, hinting at potential consolidation or a retest.
Bitcoin's price action around the $72,744 mark is drawing significant attention, as the cryptocurrency tests key support levels amidst a complex web of market indicators and broader financial trends. The current trading range reflects a period of consolidation, but with underlying signals suggesting a critical juncture for the digital asset. Understanding the interplay between Bitcoin's immediate technicals and the wider macroeconomic landscape is paramount for navigating the volatility ahead.
- BTCUSD is currently trading at $72,744, testing support levels around $73,303.
- The RSI(14) at 32.57 signals oversold conditions on the 1H chart, while the ADX at 13.65 indicates a weak trend.
- The Dollar Index (DXY) is showing strength at 99.39, potentially pressuring risk assets like Bitcoin.
- Geopolitical tensions and upcoming Fed decisions are creating a cautious market environment, impacting crypto's risk sentiment.
Navigating the $72,744 Tightrope
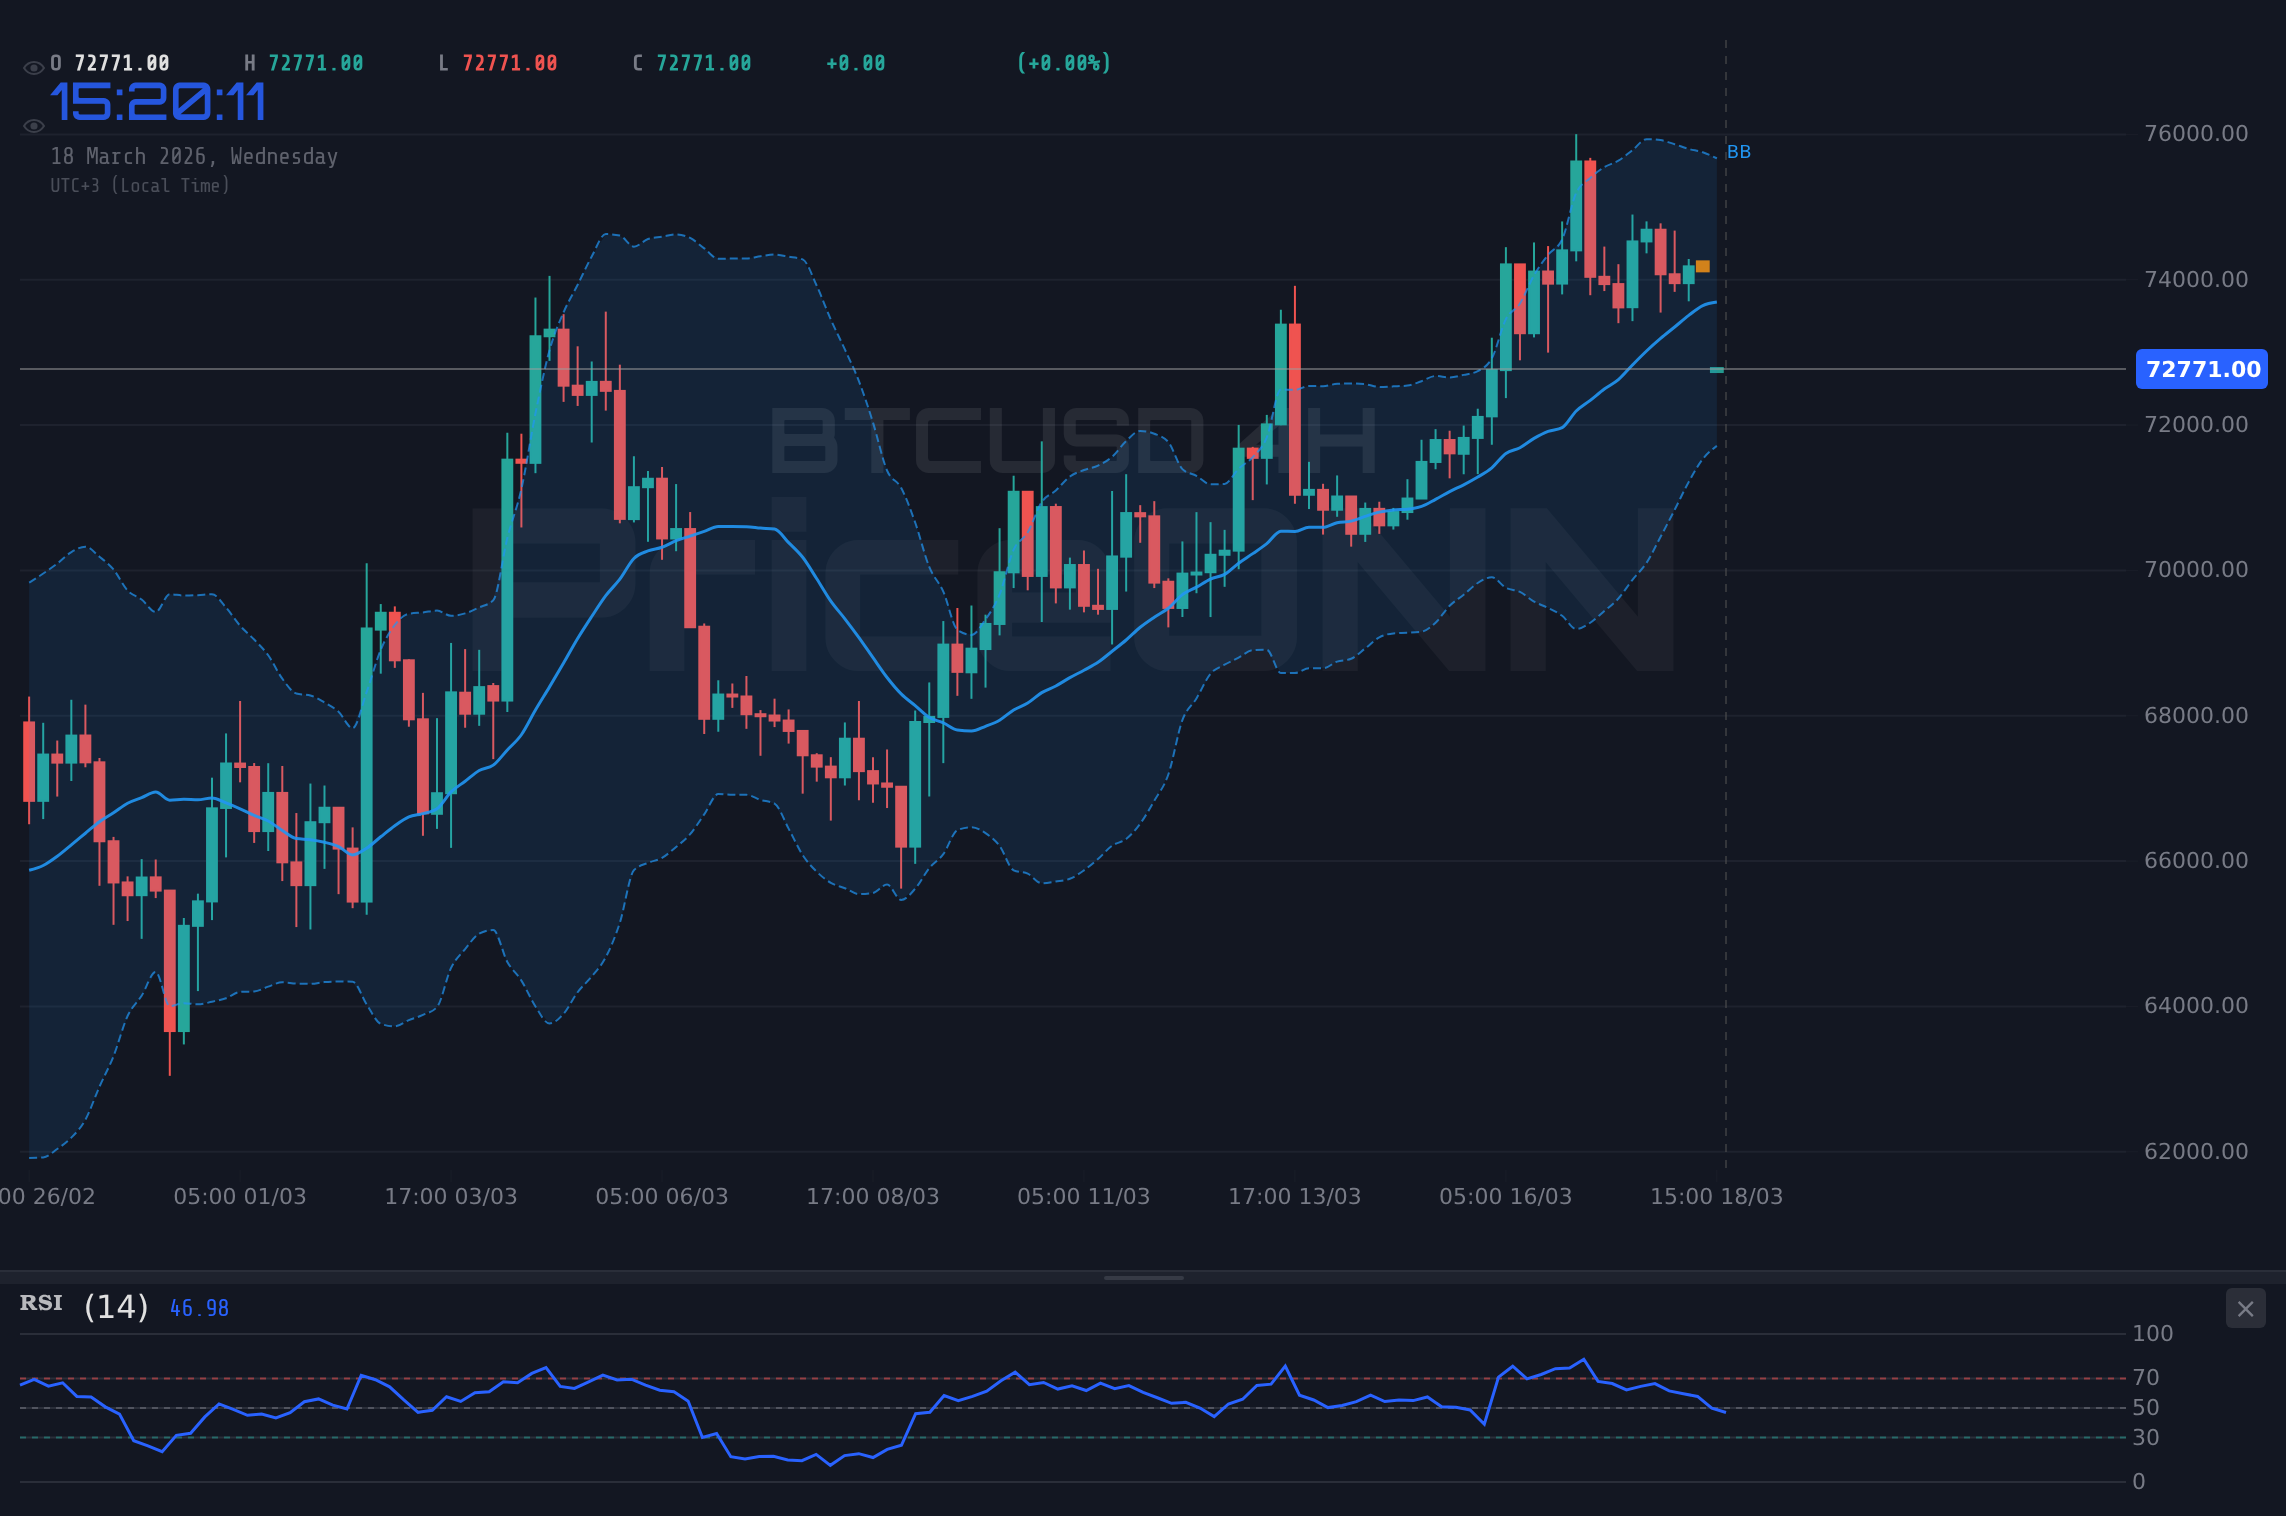
Bitcoin has found itself at a critical juncture, with the $72,744 level acting as a crucial psychological and technical support. The recent pullback from higher price points, which saw the daily range hit $74,776, has now brought the price back to test the waters near the $73,303 support zone on the 1-hour chart. This dance around key price points is not happening in a vacuum; it's deeply intertwined with a broader market sentiment shaped by macroeconomic uncertainties and geopolitical undercurrents. The current downward momentum, reflected in the -2.6% daily change, underscores the immediate pressure on the digital asset, but the proximity to significant support levels prevents a definitive bearish outlook without further confirmation.
The Story Told by the Indicators
Diving deeper into the technicals, the 1-hour chart paints a picture of a market at a crossroads. The Relative Strength Index (RSI) at 32.57 is firmly in oversold territory, historically a zone where buying pressure might emerge, suggesting a potential for a short-term bounce. However, this is counterbalanced by a weak trend indicated by the ADX at 13.65. This low ADX reading on the 1H chart signifies a lack of strong directional conviction, meaning any upward movement might struggle for momentum. Furthermore, the MACD is below its signal line, reinforcing the negative momentum observed in the price action. The Stochastic Oscillator, with %K at 24.94 and %D at 35.39, also supports a bearish bias in the short term, indicating that the downward momentum, while perhaps losing steam, is still dominant. The Bollinger Bands are hugging the lower band, a classic sign of bearish pressure, but also a potential precursor to a reversal if buying interest picks up.
Multi-Timeframe Perspective: The Bigger Picture
Shifting our focus to the 4-hour and daily charts provides a more nuanced view. On the 4-hour timeframe, the trend is categorized as neutral, a state of equilibrium where neither bulls nor bears have a clear upper hand, despite the overall negative MACD momentum and Stochastic's continued bearish signal (%K at 19.02, %D at 41.17). The ADX here, however, climbs to 39.23, indicating a strong trend is in play, which, when combined with the bearish signals, suggests that the prevailing trend might be downwards, despite the neutral classification. The daily chart presents a more conflicted signal: the trend is neutral, but the RSI is at 54.85, showing a slight bullish inclination, while the MACD is positive and above its signal line, pointing towards potential upside. This divergence across timeframes highlights the choppiness and uncertainty currently present in the Bitcoin market. The ADX at 27.23 on the daily chart suggests a strong trend is developing, but the conflicting signals from other indicators mean the direction is not yet decisively established.
Cross-Market Correlations: DXY and Equities
The performance of Bitcoin cannot be assessed in isolation. The Dollar Index (DXY) is currently trading at 99.39, exhibiting a strengthening trend on the daily chart (ADX 34.21) and a bullish signal on the 1-hour chart. Historically, a stronger dollar often correlates with pressure on risk assets, including Bitcoin, as it increases the relative cost of holding non-dollar denominated assets and can signal a shift towards safer investments. The DXY's upward movement, coupled with the cautious sentiment in the broader equity markets - the SP500 at 6724.05 showing mixed signals across timeframes, and the Nasdaq 100 at 24817.75 exhibiting a bearish 1-hour trend - suggests a 'risk-off' environment is subtly taking hold. This risk-averse mood typically dampens enthusiasm for volatile assets like cryptocurrencies, potentially exacerbating downward price movements for BTCUSD.
Geopolitical Tensions and Macroeconomic Uncertainty
Adding another layer of complexity are the ongoing geopolitical developments and the looming macroeconomic events. Recent news highlights concerns about oil prices, with Brent Crude at $105.25 showing a strong daily uptrend and WTI at $95.51 also indicating bullish momentum. While oil prices are not directly correlated with Bitcoin, they can serve as a barometer for global risk appetite and inflationary pressures. Furthermore, the upcoming Federal Reserve decision, anticipated to keep rates steady but with potential signals of delayed cuts due to persistent inflation, creates a backdrop of uncertainty. The market is keenly watching for any indication of future monetary policy, as interest rate expectations significantly influence capital flows into and out of riskier assets. The recent news about European nations rejecting a U.S. request for military aid in securing the Strait of Hormuz, as reported by energy news outlets, could contribute to elevated oil prices and broader geopolitical risk premiums, indirectly impacting Bitcoin's sentiment.
Key Price Levels and What They Mean
The immediate focus for traders remains on the support and resistance levels derived from the live data. On the 1-hour chart, critical support lies at $73,303 and $73,561, with a more significant floor at $72,789 on the 4-hour chart. A break below this $72,789 level could trigger further downside, potentially targeting the $70,791 support on the daily chart. Conversely, for a bullish revival, Bitcoin needs to overcome the immediate resistance levels. The 1-hour resistance is pegged at $74,207 and $74,465, with a more substantial barrier at $74,997 on the 4-hour chart. A decisive move above this $74,997 resistance, ideally with increasing volume and confirming indicators, would be necessary to invalidate the current bearish sentiment and open the path towards higher targets.
The Trade Recommendation: Navigating the Current Landscape
Considering the confluence of technical signals and market conditions, the current outlook for BTCUSD warrants a cautious approach, leaning towards a bearish bias in the short term, while acknowledging the potential for consolidation or a bounce from oversold levels. The strong trend indicated by the ADX on multiple timeframes, combined with the bearish MACD and Stochastic signals on the 1-hour chart, suggests that downside risk is elevated. However, the oversold RSI on the 1H chart and the neutral-to-slightly-bullish leanings on the daily chart prevent an outright bearish call without further confirmation of a breakdown below key support. The current ADX reading of 39.23 on the 4-hour chart signals a strong trend, and given the other indicators, this trend is likely downwards in the immediate term. The probability leans towards a bearish continuation, but with significant support nearby, consolidation is also a strong possibility.
Bearish Scenario: Testing the Depths
The bearish scenario hinges on Bitcoin's inability to hold the $72,744 support and a subsequent breakdown below the $73,303 and $72,789 levels. This would likely be fueled by continued dollar strength, a 'risk-off' sentiment in equities, or disappointing news from the Federal Reserve. Such a move would invalidate any short-term bullish hopes and could accelerate selling pressure, potentially triggering stop-loss orders and pushing the price towards lower support levels. The ADX at 39.23 on the 4H chart supports the idea of a strong trend, and if it's downwards, the price could fall sharply.
Neutral Scenario: Choppy Waters Ahead
Given the conflicting signals across different timeframes - oversold RSI on 1H versus a bullish MACD on the daily, for instance - a period of consolidation or range-bound trading is highly probable. In this scenario, Bitcoin might oscillate between the current support levels around $72,744 and the immediate resistance near $74,207. This would be characterized by lower trading volumes and indecisive price action, reflecting the market's uncertainty and waiting for clearer directional cues from macroeconomic data or major geopolitical events. The weak ADX on the 1H chart (13.65) supports this lack of conviction.
Bullish Scenario: A Rebound from Support?
The bullish case relies on a strong bounce from the current support zone, potentially driven by a dovish surprise from the Fed, a de-escalation of geopolitical tensions, or a sudden surge in risk appetite. For this to materialize, Bitcoin would need to decisively break above the $74,207 and $74,465 resistance levels on the 1-hour chart, and ideally clear the $74,997 barrier on the 4-hour chart. Confirmation would come from rising RSI and MACD momentum, coupled with increasing trading volumes. The oversold RSI on the 1H chart (32.57) provides a potential catalyst for such a reversal, but it would require significant buying pressure to overcome the prevailing bearish momentum.
The Road Ahead: What to Watch
Looking forward, several factors will be critical in determining Bitcoin's next move. The Federal Reserve's upcoming policy decision and forward guidance will be a major catalyst. Any hint of a delayed rate cut could strengthen the dollar and pressure Bitcoin, while a more dovish tone might provide some relief. Geopolitical developments, particularly those impacting oil prices and global stability, will continue to influence risk sentiment. On the technical front, the $72,744 support level remains paramount. A sustained hold here could pave the way for a retest of higher resistance levels, while a decisive break below could signal a deeper correction. Traders will also be monitoring the correlation with traditional markets; if equities continue to falter while the dollar strengthens, Bitcoin may face further headwinds.
Conclusion: Patience and Risk Management are Key
The current market environment for BTCUSD is one of heightened uncertainty, characterized by conflicting technical signals across different timeframes and significant macroeconomic and geopolitical crosswinds. While oversold conditions on shorter timeframes offer a glimmer of hope for a bounce, the prevailing bearish momentum, strong dollar, and cautious risk sentiment suggest that downside risks remain elevated. The $72,744 support level is the immediate battleground. Patience and disciplined risk management will be crucial for traders as they await clearer directional signals from upcoming economic data and central bank communications. The market is cyclical; every downturn plants seeds for the next rally, but navigating the current volatility requires a keen eye on the data and a strategic approach.
| Indicator | Value | Signal | Interpretation |
|---|---|---|---|
| RSI (14) | 32.57 | Oversold | Potential bounce zone, but trend is weak. |
| MACD | -1944 | Below Signal Line | Negative momentum persists. |
| Stochastic | K=24.94, D=35.39 | Bearish Crossover | Downward pressure likely to continue. |
| ADX | 13.65 | Weak Trend | Lack of strong directional conviction. |
Bearish Scenario: Downside Risk Prevails
65% ProbabilityNeutral Scenario: Consolidation Zone
25% ProbabilityBullish Scenario: Rebound from Support
10% ProbabilityFrequently Asked Questions: BTCUSD Technical Analysis
What happens if BTCUSD breaks below the $72,744 support level?
A break below $72,744 would invalidate the current neutral stance and likely trigger further selling pressure, potentially targeting the $70,791 support. This scenario is assigned a 65% probability, supported by bearish indicators like MACD and Stochastic on the 1H chart.
Should I buy BTCUSD at current levels around $72,744 given the RSI at 32.57?
Buying at current levels carries significant risk due to the weak trend (ADX 13.65 on 1H) and prevailing bearish momentum. While the RSI is oversold, a confirmed bullish reversal pattern or a break above immediate resistance is needed for a high-probability setup. The bullish scenario has only a 10% probability.
Is the RSI at 32.57 a sell signal for BTCUSD right now?
An RSI of 32.57 on the 1-hour chart typically indicates oversold conditions, which can sometimes precede a bounce rather than being a direct sell signal. However, when combined with a weak trend (ADX 13.65) and bearish MACD, it suggests that while a bounce is possible, the immediate pressure remains downwards.
How will the upcoming Fed decision affect BTCUSD around the $72,744 level?
A hawkish Fed decision, suggesting higher-for-longer rates or delayed cuts, could strengthen the DXY (currently 99.39) and pressure risk assets like BTCUSD, increasing the likelihood of a break below $72,744. Conversely, a dovish tone could support a rebound, making the $74,207 resistance level the next key target.
The current market environment for BTCUSD is one of heightened uncertainty, characterized by conflicting technical signals across different timeframes and significant macroeconomic and geopolitical crosswinds. While oversold conditions on shorter timeframes offer a glimmer of hope for a bounce, the prevailing bearish momentum, strong dollar, and cautious risk sentiment suggest that downside risks remain elevated. The $72,744 support level is the immediate battleground. Patience and disciplined risk management will be crucial for traders as they await clearer directional signals from upcoming economic data and central bank communications. The market is cyclical; every downturn plants seeds for the next rally, but navigating the current volatility requires a keen eye on the data and a strategic approach.
Track markets in real-time
AI-powered analysis, technical indicators and real-time price data.
Join Our Telegram Channel
Breaking market news, AI analysis and trading signals instantly.
Join Channel