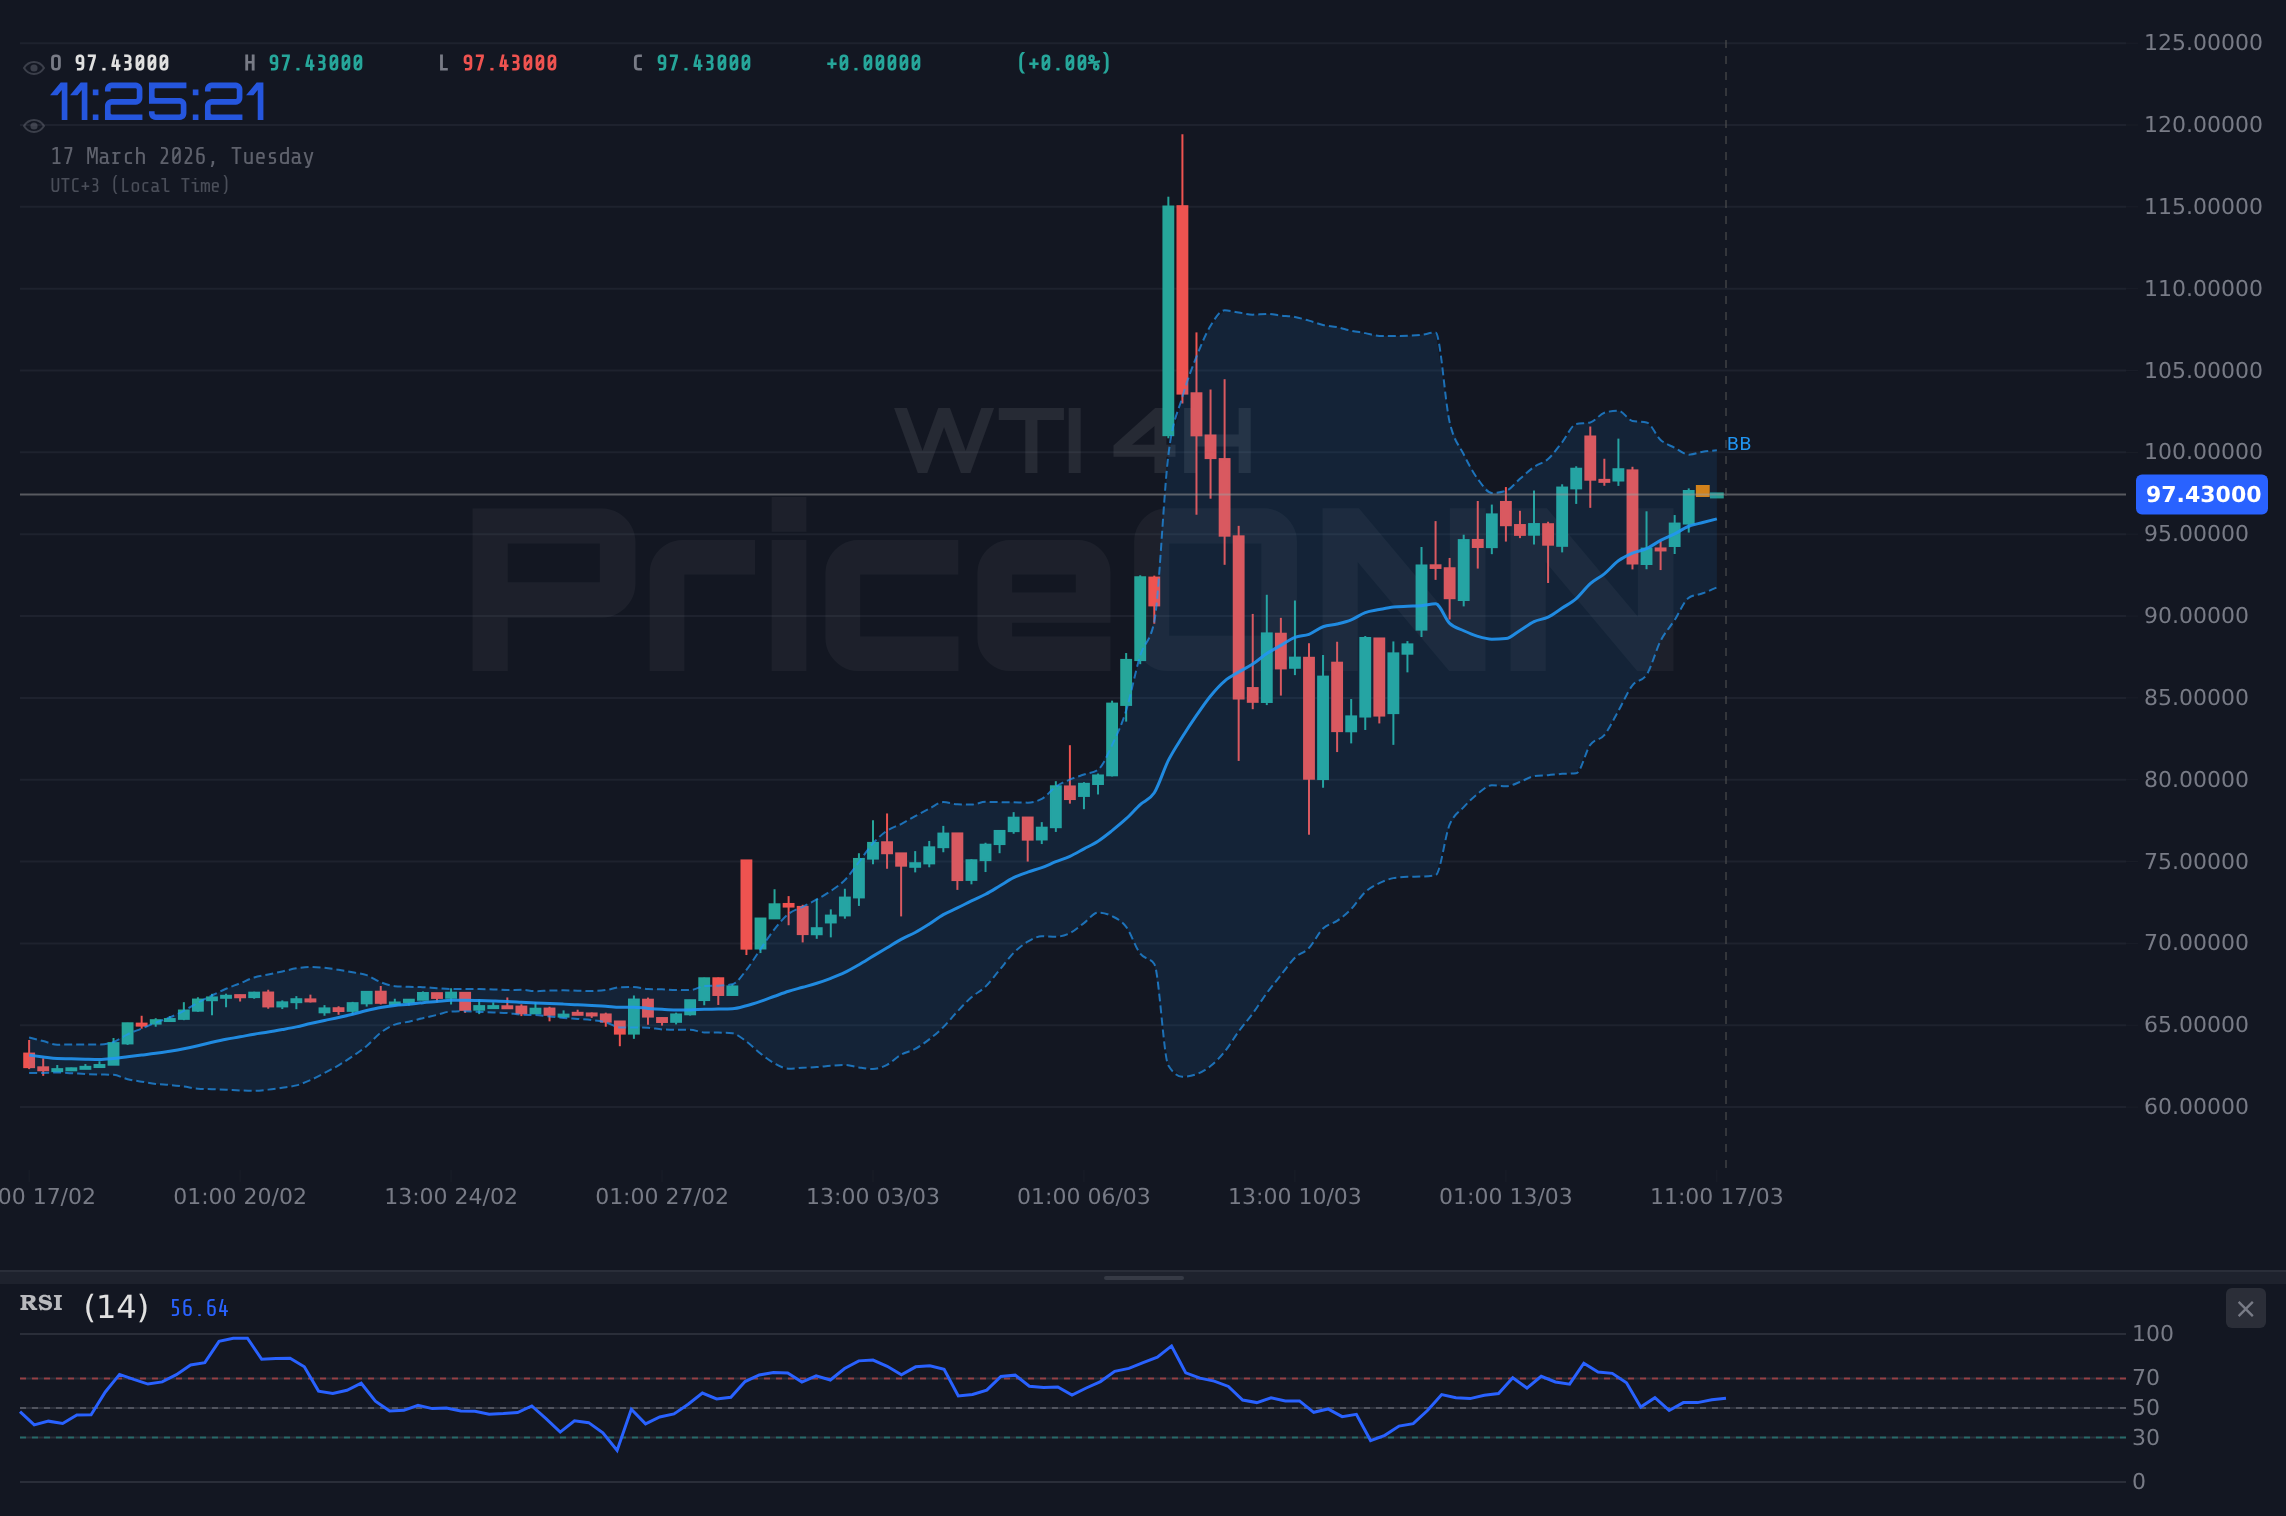
WTI Trades Near $97.69 Resistance: Bullish Trend Holds Amid Geopolitical Tensions
WTI crude oil hovers near $97.69 resistance as geopolitical tensions and a strong bullish trend support prices, though a break above is needed for further upside.
In a market environment increasingly defined by geopolitical friction and the ever-present demand for energy, WTI crude oil finds itself at a critical juncture, currently trading around the $97.69 mark. This price point is significant, representing a key resistance level that has been tested amid a broader bullish trend. The interplay between global supply concerns, the persistent demand from artificial intelligence data centers, and the broader macroeconomic landscape paints a complex picture for oil traders. Understanding the nuances of this market requires looking beyond simple price action and delving into the correlated movements of other major assets and the geopolitical undercurrents that often dictate the direction of energy markets.
- WTI crude oil is currently trading near the $97.69 resistance level, a critical point for the ongoing bullish trend.
- The ADX at 22.39 indicates a moderate trend strength, suggesting that while momentum exists, a clear commitment above resistance is needed for sustained upside.
- Geopolitical tensions, particularly those affecting the Strait of Hormuz, are a significant driver, as evidenced by the surge in Brent crude prices.
- The Dollar Index (DXY) at 99.65 is showing strength, which historically can put pressure on oil prices, creating a potential cross-current for WTI.
- A daily close above $98.10 would be a crucial confirmation signal for continued bullish momentum, targeting higher resistance levels.
The energy markets have been particularly sensitive to geopolitical developments, and recent events have only amplified this. News of potential disruptions, such as the closure of the Strait of Hormuz, has sent ripples through the oil complex, pushing prices like Brent crude up significantly. This heightened geopolitical risk premium is a key factor supporting WTI, even as it approaches levels where selling pressure might emerge. Traders are keenly observing how these tensions evolve, as any escalation could provide the catalyst needed for WTI to decisively break through its current resistance and target higher valuations. The underlying bullish trend, supported by factors like strong demand from AI data centers and robust 4H and 1D time frame signals, provides a foundation for such a move, but the immediate hurdle at $97.69 remains a significant one.
From a technical standpoint, the WTI chart presents a compelling, albeit cautious, bullish picture. On the 1-hour timeframe, the signals are mixed, with a neutral trend and conflicting indicators. However, the 4-hour and daily charts reveal a more consistent bullish bias. The ADX on the 4-hour chart is at 22.39, indicating a moderately strong trend, while the daily ADX at 13.07 suggests a weaker trend, highlighting a potential lack of conviction for a sustained breakout. The RSI values also paint a nuanced scenario: 59.81 on the 1H chart shows upward momentum, but the daily RSI at 75.05 is firmly in overbought territory, warning of potential pullbacks. This divergence suggests that while the overall sentiment is bullish, the immediate path higher might not be smooth, and traders should be mindful of potential profit-taking or consolidation.
The correlation with the US Dollar Index (DXY) is another crucial element to consider. With the DXY currently at 99.65 and showing a strong upward trend on the daily chart, there's an inherent pressure on dollar-denominated commodities like WTI. Historically, a stronger dollar tends to make oil more expensive for holders of other currencies, potentially dampening demand. However, in the current environment, other factors, particularly geopolitical risks and supply-side dynamics, appear to be overriding this inverse correlation to some extent. The fact that WTI is holding its ground and even showing bullish signs despite a strengthening dollar underscores the strength of the underlying bullish drivers in the oil market.
The Bullish Case: Demand Drivers and Technical Strength
The bullish sentiment surrounding WTI is not without foundation. On the 4-hour chart, the trend is clearly defined as bullish with a power score of 86%, and the daily chart reinforces this with a 100% power score. This sustained upward momentum is supported by several key indicators. The MACD on both the 4-hour and daily timeframes shows positive momentum, with the MACD line consistently above its signal line. Furthermore, the Stochastic Oscillator on the daily chart, with %K at 51.46 and %D at 49.82, suggests a potential continuation of the upward move, although it is approaching overbought territory. The RSI on the 1-hour chart at 59.81 indicates bullish momentum, even though the daily RSI at 75.05 is signaling overbought conditions, which warrants caution regarding further immediate gains.
The demand side of the equation is also playing a significant role. The insatiable appetite for power from the burgeoning artificial intelligence sector is creating a structural increase in energy demand. This is a longer-term factor that provides a solid underpinning for oil prices, suggesting that current demand levels might be sustained or even increase further. Coupled with the supply-side uncertainties stemming from geopolitical hotspots, the fundamental outlook for WTI remains broadly positive. Even with the current price hovering near resistance, the combination of strong demand and supply risks creates a favorable backdrop for prices to eventually break higher.
Navigating the Resistance: What Levels Matter?
The immediate challenge for WTI lies at its current resistance levels. On the 1-hour chart, the first resistance is at $98.10, followed by $98.86 and $99.49. On the 4-hour chart, these levels are $96.62, $97.58, and $99.00. The daily resistance levels are $99.47, $104.91, and $105.05. The current price of $97.69 sits between the 4-hour resistance of $97.58 and the 1-hour resistance of $98.10. A decisive break and sustained hold above $98.10 would be a significant signal, likely triggering further buying interest and pushing prices towards the next key levels. Conversely, failure to overcome this immediate hurdle could lead to a period of consolidation or a pullback towards support levels, such as $96.71 or $96.08 on the 1-hour chart.
The ADX reading of 22.39 on the 4-hour chart suggests a trend is in place, but not yet overwhelmingly strong. This means that while the bullish momentum is present, it might not have the power to immediately smash through resistance without facing some opposition. Traders looking for confirmation of a sustained breakout would likely want to see the ADX strengthen, perhaps moving above 25, and the RSI move out of overbought territory on the daily chart before committing to aggressive long positions. The Stochastic Oscillator on the daily chart, currently showing %K at 51.46 and %D at 49.82, is also in a zone that could precede a move higher, but it's not yet indicating a strong bullish signal.
Cross-Market Correlations: DXY, Equities, and Geopolitics
The performance of WTI is intrinsically linked to broader market movements. The Dollar Index (DXY), currently at 99.65, is exhibiting strength, particularly on the daily chart where it shows a 97% bullish trend. This presents a potential headwind for oil prices, as a stronger dollar typically makes commodities more expensive for international buyers. However, the current geopolitical climate seems to be creating a decoupling effect. The surge in Brent crude prices, partly due to concerns over the Strait of Hormuz, highlights how supply-side risks can override dollar strength. This indicates that the market is prioritizing physical supply concerns over currency movements at present.
Equity markets, represented by the S&P 500 and Nasdaq, are also providing context. The S&P 500 is showing a bearish trend on the daily chart, trading at 6676.45, down 0.28% on the day. This suggests a general risk-off sentiment in the broader market, which might typically lead investors towards safe-haven assets. While gold has seen some consolidation near $5,000, its inverse correlation with risk appetite is a factor to watch. However, the strong bullish trend in WTI, despite weakness in equities and strength in the dollar, points to specific bullish catalysts within the energy sector itself. The narrative around AI data center demand is a significant structural driver that appears to be overshadowing broader market sentiment for now.
The Impact of Recent News and Events
Recent news has further underscored the volatility and geopolitical sensitivity of the energy markets. Reports of oil prices surging amid concerns over the Strait of Hormuz closure and strategic reserve releases directly impact WTI's price dynamics. Such events inject an immediate risk premium into the market, providing a tailwind for prices and potentially enabling WTI to overcome the $97.69 resistance. Furthermore, the ongoing analysis of central bank policies, while not directly impacting WTI as much as currency pairs, contributes to the overall market sentiment. Any signals of monetary easing or tightening can influence global liquidity and risk appetite, indirectly affecting commodity demand.
The mention of AI's thirst for power forcing a potential nuclear renaissance is also noteworthy. While this speaks to long-term energy trends, it highlights the structural shifts occurring in energy consumption. This increasing demand, regardless of the source, adds another layer of support to the bullish case for oil in the medium to long term. For WTI traders, the immediate focus remains on the interplay between these geopolitical supply disruptions and the technical resistance at $97.69, with the broader bullish trend providing a supportive backdrop.
Trade Scenarios and Risk Management
Given the current technical setup and market conditions, WTI is in a WATCH_ZONE. The ADX at 22.39 suggests a moderate trend, and while the daily chart shows bullish strength, the RSI at 75.05 on the daily chart signals overbought conditions, indicating that immediate entry might be premature. The Stochastic Oscillator on the daily chart is also in an extreme zone, further complicating entry timing. Therefore, a clear setup would likely involve waiting for a decisive break above the resistance at $98.10. A daily close above this level would signal stronger conviction and potentially open the door for further upside towards the next resistance levels.
The bullish thesis would be invalidated if WTI were to close decisively below the support level at $96.71. Such a move would suggest that the upward momentum has stalled and that sellers are gaining control. In this scenario, traders might look for opportunities to re-evaluate their positions or consider bearish setups targeting lower support levels. Risk management remains paramount. Traders should ensure they have defined stop-loss levels in place, particularly if entering positions around the current resistance, to protect against adverse price movements. Patience in waiting for a clear breakout or a confirmed pullback to support levels would likely offer a more favorable risk-reward ratio.
FAQ Section
Frequently Asked Questions: WTI Analysis
What happens if WTI breaks above the $98.10 resistance?
A confirmed daily close above $98.10 would signal strong bullish momentum, likely triggering further buying and targeting higher resistance levels such as $99.49 and potentially $104.91. This would confirm the bullish trend despite the daily RSI being in overbought territory.
Should I buy WTI at current levels near $97.69 given the daily RSI at 75.05?
Entering at current levels carries a higher risk due to the daily RSI signaling overbought conditions. It would be prudent to wait for a confirmed breakout above $98.10 or a pullback to support levels like $96.71 before considering a long position, as this offers a better risk-reward profile.
Is the ADX at 22.39 a strong signal for a continued WTI uptrend?
An ADX reading of 22.39 on the 4-hour chart indicates a moderate trend strength. While it supports the ongoing bullish move, it suggests that the trend might not be overwhelmingly strong and could face challenges at resistance levels. Confirmation from other indicators or a sustained breakout is advisable.
How will geopolitical tensions around the Strait of Hormuz affect WTI prices this week?
Escalating geopolitical tensions, such as those reported around the Strait of Hormuz, are a significant bullish catalyst for WTI. They increase the risk premium on oil prices, potentially driving WTI above current resistance levels of $97.69 and towards higher targets, especially if supply disruptions are perceived as imminent.
The path forward for WTI hinges on its ability to decisively break through current resistance levels while navigating the cross-currents of a strengthening dollar and ongoing geopolitical risks. While the underlying bullish trend remains intact, confirmation signals are crucial for prudent trading. Managing risk and waiting for clear setups will be key for traders looking to capitalize on potential price movements in this dynamic energy market.
Track markets in real-time
AI-powered analysis, technical indicators and real-time price data.
Join Our Telegram Channel
Breaking market news, AI analysis and trading signals instantly.
Join Channel